Sandwell
124 state-funded schools with 62,292 pupils on roll, in the West Midlands region. Every school’s page has its published figures against Sandwell and England.
- Primary
- 93
- Secondary
- 22
- Special
- 6
- Alternative provision
- 3
- Maintained
- 65
- Academies
- 49
- Free schools
- 7
- Maintained special
- 3
Map
Zoom in to see each school. Open the full map
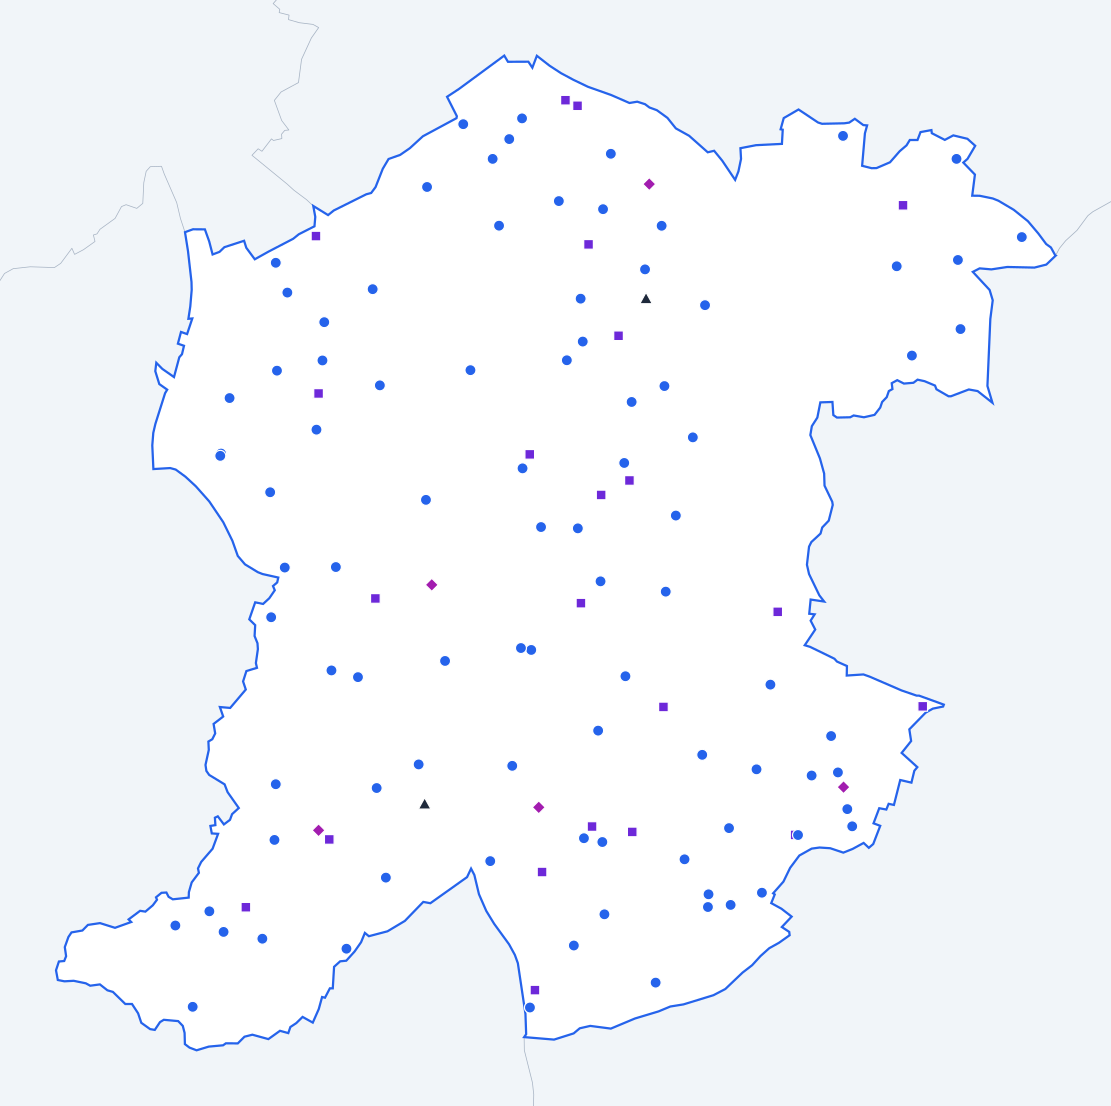
ONS, OS © Crown copyright 2025 · GIAS · © OpenStreetMap
Sandwell against England
Published figures for the authority’s schools, set against the same kind of school across England.
All state-funded schools
Overall absence
2024/256.8%
- England
- 6.8%
The same as England.
Show the figures as a table
| Year | Sandwell | England |
|---|---|---|
| 2017/18 | 4.7% | 4.8% |
| 2018/19 | 4.4% | 4.7% |
| 2020/21 | 4.6% | 4.6% |
| 2021/22 | 7.4% | 7.6% |
| 2022/23 | 7.6% | 7.4% |
| 2023/24 | 7.3% | 7.1% |
| 2024/25 | 6.8% | 6.8% |
Sessions missed for any reason, as a share of all possible sessions in the school year. Source: Department for Education, Explore Education Statistics, Pupil absence in schools in England, 2024/25.
Persistent absence
2024/2519.7%
- England
- 18.1%
1.6 percentage points higher than England.
Show the figures as a table
| Year | Sandwell | England |
|---|---|---|
| 2017/18 | 11.2% | 11.2% |
| 2018/19 | 10.3% | 10.9% |
| 2020/21 | 12.0% | 12.1% |
| 2021/22 | 23.3% | 22.5% |
| 2022/23 | 23.7% | 21.2% |
| 2023/24 | 21.5% | 20.0% |
| 2024/25 | 19.7% | 18.1% |
Pupils who missed 10% or more of their possible sessions, as a share of pupils. Source: Department for Education, Explore Education Statistics, Pupil absence in schools in England, 2024/25.
Severe absence
2024/252.2%
- England
- 2.4%
0.2 percentage points lower than England.
Show the figures as a table
| Year | Sandwell | England |
|---|---|---|
| 2017/18 | 0.7% | 0.8% |
| 2018/19 | 0.7% | 0.8% |
| 2020/21 | 0.9% | 1.1% |
| 2021/22 | 1.6% | 1.7% |
| 2022/23 | 2.0% | 2.0% |
| 2023/24 | 2.2% | 2.3% |
| 2024/25 | 2.2% | 2.4% |
Pupils who missed 50% or more of their possible sessions, as a share of pupils. Source: Department for Education, Explore Education Statistics, Pupil absence in schools in England, 2024/25.
Suspensions per 100 pupils
2024/256.47
- England
- 10.88
4.41 lower than England.
Show the figures as a table
| Year | Sandwell | England |
|---|---|---|
| 2017/18 | 3.69 | 5.08 |
| 2018/19 | 3.25 | 5.36 |
| 2019/20 | 1.66 | 3.76 |
| 2020/21 | 2.98 | 4.25 |
| 2021/22 | 4.79 | 6.91 |
| 2022/23 | 6.14 | 9.33 |
| 2023/24 | 7.80 | 11.31 |
| 2024/25 | 6.47 | 10.88 |
Suspensions in the school year for every 100 pupils on roll. One pupil can be suspended more than once. Source: Department for Education, Explore Education Statistics, Suspensions and permanent exclusions in England, 2024/25.
Permanent exclusions per 100 pupils
2024/250.09
- England
- 0.12
0.03 lower than England.
Show the figures as a table
| Year | Sandwell | England |
|---|---|---|
| 2017/18 | 0.14 | 0.10 |
| 2018/19 | 0.06 | 0.10 |
| 2019/20 | 0.07 | 0.06 |
| 2020/21 | 0.07 | 0.05 |
| 2021/22 | 0.09 | 0.08 |
| 2022/23 | 0.08 | 0.11 |
| 2023/24 | 0.11 | 0.13 |
| 2024/25 | 0.09 | 0.12 |
Permanent exclusions in the school year for every 100 pupils on roll. Source: Department for Education, Explore Education Statistics, Suspensions and permanent exclusions in England, 2024/25.
Eligible for free school meals
2024/2536.0%
- England
- 25.7%
10.3 percentage points higher than England.
Show the figures as a table
| Year | Sandwell | England |
|---|---|---|
| 2021/22 | 29.5% | 22.5% |
| 2022/23 | 31.7% | 23.8% |
| 2023/24 | 33.8% | 24.6% |
| 2024/25 | 36.0% | 25.7% |
Pupils known to be eligible for free school meals on census day in January. Source: Department for Education, Explore Education Statistics, Schools, pupils and their characteristics, 2024/25.
SEN support
2024/2514.0%
- England
- 14.0%
The same as England.
Show the figures as a table
| Year | Sandwell | England |
|---|---|---|
| 2021/22 | 12.5% | 12.4% |
| 2022/23 | 12.8% | 12.9% |
| 2023/24 | 13.3% | 13.4% |
| 2024/25 | 14.0% | 14.0% |
Pupils receiving special educational needs support without an education, health and care plan. Source: Department for Education, Explore Education Statistics, Schools, pupils and their characteristics, 2024/25.
Education, health and care plan
2024/254.3%
- England
- 5.2%
0.9 percentage points lower than England.
Show the figures as a table
| Year | Sandwell | England |
|---|---|---|
| 2021/22 | 3.3% | 3.8% |
| 2022/23 | 3.7% | 4.2% |
| 2023/24 | 4.0% | 4.7% |
| 2024/25 | 4.3% | 5.2% |
Pupils with an education, health and care plan. Source: Department for Education, Explore Education Statistics, Schools, pupils and their characteristics, 2024/25.
First language other than English
2024/2533.9%
- England
- 21.4%
12.5 percentage points higher than England.
Show the figures as a table
| Year | Sandwell | England |
|---|---|---|
| 2021/22 | 31.4% | 19.6% |
| 2022/23 | 32.4% | 20.2% |
| 2023/24 | 33.5% | 20.8% |
| 2024/25 | 33.9% | 21.4% |
Pupils whose first language is known or believed to be other than English. Source: Department for Education, Explore Education Statistics, Schools, pupils and their characteristics, 2024/25.
Pupils per qualified teacher
2025/2618.9
- England
- 18.5
0.4 higher than England.
Show the figures as a table
| Year | Sandwell | England |
|---|---|---|
| 2017/18 | 18.7 | 18.4 |
| 2018/19 | 18.9 | 18.6 |
| 2019/20 | 19.1 | 18.8 |
| 2020/21 | 19.0 | 18.5 |
| 2021/22 | 18.9 | 18.5 |
| 2022/23 | 19.0 | 18.5 |
| 2023/24 | 19.4 | 18.6 |
| 2024/25 | 19.3 | 18.6 |
| 2025/26 | 18.9 | 18.5 |
Full-time equivalent pupils for each full-time equivalent qualified teacher. Source: Department for Education, Explore Education Statistics, School workforce in England, 2025/26.
Teacher sickness absence
2024/255.5 days
- England
- 5.0 days
0.5 days higher than England.
Show the figures as a table
| Year | Sandwell | England |
|---|---|---|
| 2017/18 | 4.3 days | 4.0 days |
| 2018/19 | 4.4 days | 4.0 days |
| 2019/20 | Not published | Not published |
| 2020/21 | 4.2 days | 3.9 days |
| 2021/22 | 6.3 days | 6.3 days |
| 2022/23 | 6.2 days | 5.2 days |
| 2023/24 | 5.7 days | 5.3 days |
| 2024/25 | 5.5 days | 5.0 days |
Days lost to sickness absence in the school year, averaged across all teachers. Source: Department for Education, Explore Education Statistics, School workforce in England, 2024/25.
Primary schools
Overall absence
2024/255.5%
- England
- 5.2%
0.3 percentage points higher than England.
Show the figures as a table
| Year | Sandwell | England |
|---|---|---|
| 2017/18 | 4.3% | 4.2% |
| 2018/19 | 4.1% | 4.0% |
| 2020/21 | 4.1% | 3.6% |
| 2021/22 | 6.6% | 6.3% |
| 2022/23 | 6.6% | 5.9% |
| 2023/24 | 5.9% | 5.5% |
| 2024/25 | 5.5% | 5.2% |
Sessions missed for any reason, as a share of all possible sessions in the school year. Source: Department for Education, Explore Education Statistics, Pupil absence in schools in England, 2024/25.
Persistent absence
2024/2515.5%
- England
- 13.0%
2.5 percentage points higher than England.
Show the figures as a table
| Year | Sandwell | England |
|---|---|---|
| 2017/18 | 9.6% | 8.7% |
| 2018/19 | 9.2% | 8.2% |
| 2020/21 | 10.3% | 8.8% |
| 2021/22 | 20.6% | 17.7% |
| 2022/23 | 20.2% | 16.2% |
| 2023/24 | 16.6% | 14.6% |
| 2024/25 | 15.5% | 13.0% |
Pupils who missed 10% or more of their possible sessions, as a share of pupils. Source: Department for Education, Explore Education Statistics, Pupil absence in schools in England, 2024/25.
Severe absence
2024/251.0%
- England
- 0.9%
0.1 percentage points higher than England.
Show the figures as a table
| Year | Sandwell | England |
|---|---|---|
| 2017/18 | 0.3% | 0.4% |
| 2018/19 | 0.4% | 0.4% |
| 2020/21 | 0.7% | 0.7% |
| 2021/22 | 0.9% | 0.6% |
| 2022/23 | 0.9% | 0.7% |
| 2023/24 | 1.0% | 0.9% |
| 2024/25 | 1.0% | 0.9% |
Pupils who missed 50% or more of their possible sessions, as a share of pupils. Source: Department for Education, Explore Education Statistics, Pupil absence in schools in England, 2024/25.
Suspensions per 100 pupils
2024/251.35
- England
- 2.47
1.12 lower than England.
Show the figures as a table
| Year | Sandwell | England |
|---|---|---|
| 2017/18 | 1.31 | 1.40 |
| 2018/19 | 1.32 | 1.41 |
| 2019/20 | 0.91 | 1.00 |
| 2020/21 | 0.78 | 0.99 |
| 2021/22 | 1.19 | 1.42 |
| 2022/23 | 1.45 | 1.81 |
| 2023/24 | 1.45 | 2.27 |
| 2024/25 | 1.35 | 2.47 |
Suspensions in the school year for every 100 pupils on roll. One pupil can be suspended more than once. Source: Department for Education, Explore Education Statistics, Suspensions and permanent exclusions in England, 2024/25.
Permanent exclusions per 100 pupils
2024/250.02
- England
- 0.03
0.01 lower than England.
Show the figures as a table
| Year | Sandwell | England |
|---|---|---|
| 2017/18 | 0.05 | 0.03 |
| 2018/19 | 0.02 | 0.02 |
| 2019/20 | 0.02 | 0.02 |
| 2020/21 | 0.01 | 0.01 |
| 2021/22 | 0.02 | 0.02 |
| 2022/23 | 0.02 | 0.03 |
| 2023/24 | 0.04 | 0.03 |
| 2024/25 | 0.02 | 0.03 |
Permanent exclusions in the school year for every 100 pupils on roll. Source: Department for Education, Explore Education Statistics, Suspensions and permanent exclusions in England, 2024/25.
Reading, writing and maths: expected standard
2025/26 (provisional)60%
- England
- 63%
3 percentage points lower than England.
Show the figures as a table
| Year | Sandwell | England |
|---|---|---|
| 2021/22 | 55% | 59% |
| 2022/23 | 56% | 60% |
| 2023/24 | 59% | 61% |
| 2024/25 | 61% | 63% |
| 2025/26 (provisional) | 60% | 63% |
Pupils at the end of key stage 2 who met the expected standard in reading, writing and maths combined. Source: Department for Education, Explore Education Statistics, Key stage 2 attainment, 2025/26.
Reading, writing and maths: higher standard
2025/26 (provisional)7%
- England
- 9%
2 percentage points lower than England.
Show the figures as a table
| Year | Sandwell | England |
|---|---|---|
| 2021/22 | 5% | 7% |
| 2022/23 | 6% | 8% |
| 2023/24 | 5% | 8% |
| 2024/25 | 7% | 8% |
| 2025/26 (provisional) | 7% | 9% |
Pupils at the end of key stage 2 who met the higher standard in reading, writing and maths combined. Source: Department for Education, Explore Education Statistics, Key stage 2 attainment, 2025/26.
Eligible for free school meals
2024/2533.7%
- England
- 24.7%
9.0 percentage points higher than England.
Show the figures as a table
| Year | Sandwell | England |
|---|---|---|
| 2021/22 | 28.7% | 23.1% |
| 2022/23 | 30.8% | 24.0% |
| 2023/24 | 32.3% | 24.3% |
| 2024/25 | 33.7% | 24.7% |
Pupils known to be eligible for free school meals on census day in January. Source: Department for Education, Explore Education Statistics, Schools, pupils and their characteristics, 2024/25.
SEN support
2024/2515.1%
- England
- 15.0%
0.1 percentage points higher than England.
Show the figures as a table
| Year | Sandwell | England |
|---|---|---|
| 2021/22 | 12.7% | 13.0% |
| 2022/23 | 13.2% | 13.5% |
| 2023/24 | 14.0% | 14.1% |
| 2024/25 | 15.1% | 15.0% |
Pupils receiving special educational needs support without an education, health and care plan. Source: Department for Education, Explore Education Statistics, Schools, pupils and their characteristics, 2024/25.
Education, health and care plan
2024/252.9%
- England
- 3.5%
0.6 percentage points lower than England.
Show the figures as a table
| Year | Sandwell | England |
|---|---|---|
| 2021/22 | 2.3% | 2.3% |
| 2022/23 | 2.6% | 2.5% |
| 2023/24 | 2.8% | 3.0% |
| 2024/25 | 2.9% | 3.5% |
Pupils with an education, health and care plan. Source: Department for Education, Explore Education Statistics, Schools, pupils and their characteristics, 2024/25.
First language other than English
2024/2536.0%
- England
- 23.4%
12.6 percentage points higher than England.
Show the figures as a table
| Year | Sandwell | England |
|---|---|---|
| 2021/22 | 32.5% | 21.2% |
| 2022/23 | 33.7% | 22.0% |
| 2023/24 | 35.2% | 22.8% |
| 2024/25 | 36.0% | 23.4% |
Pupils whose first language is known or believed to be other than English. Source: Department for Education, Explore Education Statistics, Schools, pupils and their characteristics, 2024/25.
Pupils per qualified teacher
2025/2622.3
- England
- 21.2
1.1 higher than England.
Show the figures as a table
| Year | Sandwell | England |
|---|---|---|
| 2017/18 | 22.9 | 21.3 |
| 2018/19 | 22.8 | 21.4 |
| 2019/20 | 22.8 | 21.4 |
| 2020/21 | 22.5 | 21.1 |
| 2021/22 | 22.2 | 21.0 |
| 2022/23 | 22.1 | 21.1 |
| 2023/24 | 22.7 | 21.2 |
| 2024/25 | 22.6 | 21.3 |
| 2025/26 | 22.3 | 21.2 |
Full-time equivalent pupils for each full-time equivalent qualified teacher. Source: Department for Education, Explore Education Statistics, School workforce in England, 2025/26.
Secondary schools
Overall absence
2024/258.1%
- England
- 8.4%
0.3 percentage points lower than England.
Show the figures as a table
| Year | Sandwell | England |
|---|---|---|
| 2017/18 | 5.3% | 5.5% |
| 2018/19 | 4.7% | 5.5% |
| 2020/21 | 5.2% | 5.5% |
| 2021/22 | 8.5% | 9.0% |
| 2022/23 | 9.0% | 9.0% |
| 2023/24 | 9.1% | 8.9% |
| 2024/25 | 8.1% | 8.4% |
Sessions missed for any reason, as a share of all possible sessions in the school year. Source: Department for Education, Explore Education Statistics, Pupil absence in schools in England, 2024/25.
Persistent absence
2024/2524.3%
- England
- 23.4%
0.9 percentage points higher than England.
Show the figures as a table
| Year | Sandwell | England |
|---|---|---|
| 2017/18 | 13.2% | 13.9% |
| 2018/19 | 11.6% | 13.7% |
| 2020/21 | 14.1% | 14.8% |
| 2021/22 | 26.6% | 27.7% |
| 2022/23 | 27.8% | 26.5% |
| 2023/24 | 27.3% | 25.6% |
| 2024/25 | 24.3% | 23.4% |
Pupils who missed 10% or more of their possible sessions, as a share of pupils. Source: Department for Education, Explore Education Statistics, Pupil absence in schools in England, 2024/25.
Severe absence
2024/253.5%
- England
- 3.9%
0.4 percentage points lower than England.
Show the figures as a table
| Year | Sandwell | England |
|---|---|---|
| 2017/18 | 1.1% | 1.2% |
| 2018/19 | 1.0% | 1.3% |
| 2020/21 | 1.1% | 1.5% |
| 2021/22 | 2.6% | 2.7% |
| 2022/23 | 3.4% | 3.4% |
| 2023/24 | 3.8% | 3.8% |
| 2024/25 | 3.5% | 3.9% |
Pupils who missed 50% or more of their possible sessions, as a share of pupils. Source: Department for Education, Explore Education Statistics, Pupil absence in schools in England, 2024/25.
Suspensions per 100 pupils
2024/2513.58
- England
- 21.24
7.66 lower than England.
Show the figures as a table
| Year | Sandwell | England |
|---|---|---|
| 2017/18 | 7.68 | 10.13 |
| 2018/19 | 6.44 | 10.75 |
| 2019/20 | 2.68 | 7.43 |
| 2020/21 | 6.09 | 8.48 |
| 2021/22 | 10.03 | 13.96 |
| 2022/23 | 13.07 | 18.90 |
| 2023/24 | 17.01 | 22.61 |
| 2024/25 | 13.58 | 21.24 |
Suspensions in the school year for every 100 pupils on roll. One pupil can be suspended more than once. Source: Department for Education, Explore Education Statistics, Suspensions and permanent exclusions in England, 2024/25.
Permanent exclusions per 100 pupils
2024/250.20
- England
- 0.23
0.03 lower than England.
Show the figures as a table
| Year | Sandwell | England |
|---|---|---|
| 2017/18 | 0.31 | 0.20 |
| 2018/19 | 0.14 | 0.20 |
| 2019/20 | 0.15 | 0.13 |
| 2020/21 | 0.16 | 0.10 |
| 2021/22 | 0.19 | 0.16 |
| 2022/23 | 0.17 | 0.22 |
| 2023/24 | 0.22 | 0.25 |
| 2024/25 | 0.20 | 0.23 |
Permanent exclusions in the school year for every 100 pupils on roll. Source: Department for Education, Explore Education Statistics, Suspensions and permanent exclusions in England, 2024/25.
Attainment 8
2025/26 (provisional)42.9
- England
- 47.4
4.5 lower than England.
Show the figures as a table
| Year | Sandwell | England |
|---|---|---|
| 2021/22 | 46.3 | 49.8 |
| 2022/23 | 43.1 | 47.2 |
| 2023/24 | 42.5 | 46.9 |
| 2024/25 | 42.4 | 47.1 |
| 2025/26 (provisional) | 42.9 | 47.4 |
The average of pupils' points across eight GCSE-level qualifications, with English and maths counted twice. Source: Department for Education, Explore Education Statistics, Key stage 4 performance, 2025/26.
English and maths: grade 4 or above
2025/26 (provisional)57%
- England
- 66%
9 percentage points lower than England.
Show the figures as a table
| Year | Sandwell | England |
|---|---|---|
| 2021/22 | 62% | 70% |
| 2022/23 | 56% | 67% |
| 2023/24 | 57% | 67% |
| 2024/25 | 57% | 66% |
| 2025/26 (provisional) | 57% | 66% |
Pupils at the end of key stage 4 with grade 4 or above in both English and maths. Source: Department for Education, Explore Education Statistics, Key stage 4 performance, 2025/26.
English and maths: grade 5 or above
2025/26 (provisional)36%
- England
- 48%
12 percentage points lower than England.
Show the figures as a table
| Year | Sandwell | England |
|---|---|---|
| 2021/22 | 42% | 51% |
| 2022/23 | 36% | 46% |
| 2023/24 | 36% | 47% |
| 2024/25 | 34% | 47% |
| 2025/26 (provisional) | 36% | 48% |
Pupils at the end of key stage 4 with grade 5 or above in both English and maths. Source: Department for Education, Explore Education Statistics, Key stage 4 performance, 2025/26.
Eligible for free school meals
2024/2538.2%
- England
- 25.8%
12.4 percentage points higher than England.
Show the figures as a table
| Year | Sandwell | England |
|---|---|---|
| 2021/22 | 30.0% | 20.9% |
| 2022/23 | 32.2% | 22.7% |
| 2023/24 | 35.2% | 24.1% |
| 2024/25 | 38.2% | 25.8% |
Pupils known to be eligible for free school meals on census day in January. Source: Department for Education, Explore Education Statistics, Schools, pupils and their characteristics, 2024/25.
SEN support
2024/2512.6%
- England
- 13.4%
0.8 percentage points lower than England.
Show the figures as a table
| Year | Sandwell | England |
|---|---|---|
| 2021/22 | 12.4% | 11.9% |
| 2022/23 | 12.4% | 12.4% |
| 2023/24 | 12.5% | 12.9% |
| 2024/25 | 12.6% | 13.4% |
Pupils receiving special educational needs support without an education, health and care plan. Source: Department for Education, Explore Education Statistics, Schools, pupils and their characteristics, 2024/25.
Education, health and care plan
2024/252.7%
- England
- 3.1%
0.4 percentage points lower than England.
Show the figures as a table
| Year | Sandwell | England |
|---|---|---|
| 2021/22 | 2.1% | 2.2% |
| 2022/23 | 2.3% | 2.4% |
| 2023/24 | 2.6% | 2.7% |
| 2024/25 | 2.7% | 3.1% |
Pupils with an education, health and care plan. Source: Department for Education, Explore Education Statistics, Schools, pupils and their characteristics, 2024/25.
First language other than English
2024/2531.8%
- England
- 19.2%
12.6 percentage points higher than England.
Show the figures as a table
| Year | Sandwell | England |
|---|---|---|
| 2021/22 | 30.0% | 17.5% |
| 2022/23 | 31.0% | 18.1% |
| 2023/24 | 31.6% | 18.6% |
| 2024/25 | 31.8% | 19.2% |
Pupils whose first language is known or believed to be other than English. Source: Department for Education, Explore Education Statistics, Schools, pupils and their characteristics, 2024/25.
Pupils per qualified teacher
2025/2616.9
- England
- 17.3
0.4 lower than England.
Show the figures as a table
| Year | Sandwell | England |
|---|---|---|
| 2017/18 | 15.2 | 16.5 |
| 2018/19 | 15.5 | 16.8 |
| 2019/20 | 15.9 | 17.2 |
| 2020/21 | 16.1 | 17.1 |
| 2021/22 | 16.4 | 17.1 |
| 2022/23 | 16.5 | 17.2 |
| 2023/24 | 16.8 | 17.4 |
| 2024/25 | 17.3 | 17.3 |
| 2025/26 | 16.9 | 17.3 |
Full-time equivalent pupils for each full-time equivalent qualified teacher. Source: Department for Education, Explore Education Statistics, School workforce in England, 2025/26.
Special schools
Overall absence
2024/2513.0%
- England
- 12.8%
0.2 percentage points higher than England.
Show the figures as a table
| Year | Sandwell | England |
|---|---|---|
| 2017/18 | 10.9% | 10.2% |
| 2018/19 | 10.3% | 10.1% |
| 2020/21 | 7.9% | 15.2% |
| 2021/22 | 11.6% | 13.2% |
| 2022/23 | 12.0% | 13.0% |
| 2023/24 | 11.9% | 13.0% |
| 2024/25 | 13.0% | 12.8% |
Sessions missed for any reason, as a share of all possible sessions in the school year. Source: Department for Education, Explore Education Statistics, Pupil absence in schools in England, 2024/25.
Persistent absence
2024/2536.3%
- England
- 35.3%
1.0 percentage point higher than England.
Show the figures as a table
| Year | Sandwell | England |
|---|---|---|
| 2017/18 | 31.1% | 29.6% |
| 2018/19 | 26.4% | 28.8% |
| 2020/21 | 20.2% | 48.9% |
| 2021/22 | 36.3% | 40.4% |
| 2022/23 | 36.4% | 38.3% |
| 2023/24 | 34.8% | 37.2% |
| 2024/25 | 36.3% | 35.3% |
Pupils who missed 10% or more of their possible sessions, as a share of pupils. Source: Department for Education, Explore Education Statistics, Pupil absence in schools in England, 2024/25.
Severe absence
2024/256.2%
- England
- 6.9%
0.7 percentage points lower than England.
Show the figures as a table
| Year | Sandwell | England |
|---|---|---|
| 2017/18 | 4.3% | 4.4% |
| 2018/19 | 4.6% | 4.6% |
| 2020/21 | 2.3% | 5.6% |
| 2021/22 | 5.2% | 5.8% |
| 2022/23 | 4.6% | 6.2% |
| 2023/24 | 4.3% | 6.7% |
| 2024/25 | 6.2% | 6.9% |
Pupils who missed 50% or more of their possible sessions, as a share of pupils. Source: Department for Education, Explore Education Statistics, Pupil absence in schools in England, 2024/25.
Suspensions per 100 pupils
2024/257.34
- England
- 12.32
4.98 lower than England.
Show the figures as a table
| Year | Sandwell | England |
|---|---|---|
| 2017/18 | 6.87 | 12.34 |
| 2018/19 | 6.95 | 11.32 |
| 2019/20 | 9.13 | 7.76 |
| 2020/21 | 14.33 | 7.29 |
| 2021/22 | 10.46 | 9.60 |
| 2022/23 | 7.12 | 10.99 |
| 2023/24 | 4.81 | 12.62 |
| 2024/25 | 7.34 | 12.32 |
Suspensions in the school year for every 100 pupils on roll. One pupil can be suspended more than once. Source: Department for Education, Explore Education Statistics, Suspensions and permanent exclusions in England, 2024/25.
Permanent exclusions per 100 pupils
2024/250.10
- England
- 0.08
0.02 higher than England.
Show the figures as a table
| Year | Sandwell | England |
|---|---|---|
| 2017/18 | 0.00 | 0.07 |
| 2018/19 | 0.00 | 0.06 |
| 2019/20 | 0.00 | 0.04 |
| 2020/21 | 0.00 | 0.03 |
| 2021/22 | 0.00 | 0.05 |
| 2022/23 | 0.00 | 0.08 |
| 2023/24 | 0.11 | 0.08 |
| 2024/25 | 0.10 | 0.08 |
Permanent exclusions in the school year for every 100 pupils on roll. Source: Department for Education, Explore Education Statistics, Suspensions and permanent exclusions in England, 2024/25.
Eligible for free school meals
2024/2555.3%
- England
- 48.8%
6.5 percentage points higher than England.
Show the figures as a table
| Year | Sandwell | England |
|---|---|---|
| 2021/22 | 51.0% | 44.4% |
| 2022/23 | 52.1% | 45.6% |
| 2023/24 | 52.0% | 47.1% |
| 2024/25 | 55.3% | 48.8% |
Pupils known to be eligible for free school meals on census day in January. Source: Department for Education, Explore Education Statistics, Schools, pupils and their characteristics, 2024/25.
SEN support
2024/250.4%
- England
- 0.5%
0.1 percentage points lower than England.
Show the figures as a table
| Year | Sandwell | England |
|---|---|---|
| 2021/22 | 0.1% | 0.9% |
| 2022/23 | 0.0% | 0.8% |
| 2023/24 | 0.1% | 0.7% |
| 2024/25 | 0.4% | 0.5% |
Pupils receiving special educational needs support without an education, health and care plan. Source: Department for Education, Explore Education Statistics, Schools, pupils and their characteristics, 2024/25.
Education, health and care plan
2024/2599.6%
- England
- 99.5%
0.1 percentage points higher than England.
Show the figures as a table
| Year | Sandwell | England |
|---|---|---|
| 2021/22 | 99.9% | 99.1% |
| 2022/23 | 100.0% | 99.2% |
| 2023/24 | 99.9% | 99.3% |
| 2024/25 | 99.6% | 99.5% |
Pupils with an education, health and care plan. Source: Department for Education, Explore Education Statistics, Schools, pupils and their characteristics, 2024/25.
First language other than English
2024/2517.3%
- England
- 14.4%
2.9 percentage points higher than England.
Show the figures as a table
| Year | Sandwell | England |
|---|---|---|
| 2021/22 | 21.5% | 14.5% |
| 2022/23 | 19.8% | 14.4% |
| 2023/24 | 18.0% | 14.4% |
| 2024/25 | 17.3% | 14.4% |
Pupils whose first language is known or believed to be other than English. Source: Department for Education, Explore Education Statistics, Schools, pupils and their characteristics, 2024/25.
Pupils per qualified teacher
2025/267.6
- England
- 7.3
0.3 higher than England.
Show the figures as a table
| Year | Sandwell | England |
|---|---|---|
| 2017/18 | 6.5 | 6.7 |
| 2018/19 | 6.7 | 6.8 |
| 2019/20 | 7.8 | 7.0 |
| 2020/21 | 7.1 | 6.8 |
| 2021/22 | 7.0 | 6.9 |
| 2022/23 | 7.2 | 7.0 |
| 2023/24 | 7.1 | 7.1 |
| 2024/25 | 7.3 | 7.3 |
| 2025/26 | 7.6 | 7.3 |
Full-time equivalent pupils for each full-time equivalent qualified teacher. Source: Department for Education, Explore Education Statistics, School workforce in England, 2025/26.
Schools in Sandwell
Listed by name. Filter by phase or type; sort by name or size. Nothing here is sorted by results.
Showing 124 of 124 schools in Sandwell.
| School | Phase | Type | Town | Pupils |
|---|---|---|---|---|
| Abbey Infant School | Primary | Maintained | Smethwick | 280 |
| Abbey Junior School | Primary | Maintained | Smethwick | 357 |
| Albert Pritchard Infant School | Primary | Maintained | Wednesbury | 244 |
| Albright Education Centre | Alternative provision | Maintained | Tipton | 20 |
| All Saints CofE Primary School | Primary | Maintained | West Bromwich | 454 |
| Annie Lennard Primary School | Primary | Maintained | Smethwick | 229 |
| Bearwood Primary School | Primary | Maintained | Smethwick | 465 |
| Blackheath Primary School | Primary | Maintained | Rowley Regis | 456 |
| Bleakhouse Primary School | Primary | Maintained | Oldbury | 432 |
| Brandhall Primary School | Primary | Maintained | Oldbury | 431 |
| Brickhouse Primary School | Primary | Maintained | Rowley Regis | 205 |
| Bristnall Hall Academy | Secondary | Academy | Oldbury | 1,088 |
| Burnt Tree Primary School | Primary | Maintained | Oldbury | 444 |
| Cape Primary School | Primary | Maintained | Smethwick | 488 |
| Causeway Green Primary School | Primary | Maintained | Oldbury | 427 |
| Christ Church Church of England Primary School | Primary | Academy | Oldbury | Not published |
| Corngreaves Academy | Primary | Academy | Cradley Heath | 209 |
| Crocketts Community Primary School | Primary | Maintained | Smethwick | 472 |
| Devonshire Infant Academy | Primary | Academy | Smethwick | 346 |
| Devonshire Junior Academy | Primary | Academy | Smethwick | 349 |
| Eaton Valley Primary School | Primary | Maintained | West Bromwich | 446 |
| Elm Tree Primary Academy | Special | Free school | Wednesbury | 125 |
| Ferndale Primary School | Primary | Maintained | Birmingham | 551 |
| Galton Valley Primary School | Primary | Maintained | Smethwick | 456 |
| George Betts Primary Academy | Primary | Academy | Smethwick | 383 |
| George Salter Academy | Secondary | Academy | West Bromwich | 1,377 |
| Glebefields Primary School | Primary | Maintained | Tipton | 366 |
| Gospel Oak School | Secondary | Academy | Tipton | 1,140 |
| Grace Mary Primary School | Primary | Maintained | Oldbury | 241 |
| Great Bridge Primary School | Primary | Maintained | Tipton | 457 |
| Grove Vale Primary School | Primary | Maintained | Birmingham | 421 |
| Hall Green Primary School | Primary | Maintained | West Bromwich | 466 |
| Hamstead Primary School | Primary | Maintained | Birmingham | 423 |
| Hanbury Primary School | Primary | Maintained | West Bromwich | 452 |
| Hargate Primary School | Primary | Maintained | West Bromwich | 493 |
| Harvills Hawthorn Primary School | Primary | Maintained | West Bromwich | 452 |
| Hateley Heath Academy | Primary | Academy | West Bromwich | 418 |
| High Point Academy | Special | Free school | Wednesbury | 115 |
| Highfields Primary School | Primary | Maintained | Rowley Regis | 403 |
| Holly Lodge High School College of Science | Secondary | Maintained | Smethwick | 1,636 |
| Holy Name Catholic Primary School | Primary | Academy | Birmingham | 191 |
| Holy Trinity CofE Primary School | Primary | Maintained | West Bromwich | 454 |
| Holyhead Primary Academy | Primary | Academy | Wednesbury | 261 |
| Joseph Turner Primary School | Primary | Maintained | Tipton | 408 |
| Jubilee Park Academy | Primary | Academy | Tipton | 200 |
| King George V Primary School | Primary | Maintained | West Bromwich | 230 |
| Langley Primary School | Primary | Maintained | Oldbury | 440 |
| Lightwoods Primary Academy | Primary | Academy | Oldbury, Sandwell | 413 |
| Lodge Primary School | Primary | Maintained | West Bromwich | 418 |
| Lyng Primary School | Primary | Maintained | West Bromwich | 453 |
| Mesty Croft Primary | Primary | Academy | Wednesbury | 410 |
| Moat Farm Infant School | Primary | Academy | Oldbury | 407 |
| Moat Farm Junior School | Primary | Academy | Oldbury | 477 |
| Moorlands Primary School | Primary | Maintained | West Bromwich | 206 |
| Newtown Primary School | Primary | Academy | West Bromwich | 203 |
| Oakham Primary School | Primary | Maintained | Oldbury | 466 |
| Ocker Hill Academy | Primary | Academy | Tipton | 248 |
| Ocker Hill Infant School | Primary | Maintained | Tipton | 221 |
| Old Hill Primary School | Primary | Maintained | Cradley Heath | 237 |
| Old Park Primary School | Primary | Maintained | Wednesbury | 471 |
| Oldbury Academy | Secondary | Academy | Oldbury | 1,193 |
| Ormiston Forge Academy | Secondary | Academy | Cradley Heath | 1,643 |
| Ormiston Sandwell Community Academy | Secondary | Academy | Oldbury | 1,139 |
| Our Lady and St Hubert's Catholic Primary School | Primary | Academy | Oldbury | 415 |
| Park Hill Primary School | Primary | Maintained | Wednesbury | 231 |
| Pennyhill Primary School | Primary | Maintained | West Bromwich | 647 |
| Perryfields Academy | Secondary | Academy | Oldbury | 682 |
| Perryfields Primary School | Primary | Maintained | Oldbury | 316 |
| Q3 Academy Great Barr | Secondary | Academy | Birmingham | 1,153 |
| Q3 Academy Langley | Secondary | Academy | Oldbury | 1,490 |
| Q3 Academy Tipton | Secondary | Academy | Tipton | 1,563 |
| Reddal Hill Primary School | Primary | Maintained | Cradley Heath | 420 |
| Rood End Primary School | Primary | Maintained | Oldbury | 428 |
| Rounds Green Primary School | Primary | Academy | Oldbury | 367 |
| Rowley Hall Primary School | Primary | Academy | Rowley Regis | 585 |
| Ryders Green Primary School | Primary | Maintained | West Bromwich | 452 |
| Sacred Heart Primary School | Primary | Maintained | Tipton | 418 |
| Sandwell Academy | Secondary | Academy | West Bromwich | 1,463 |
| Sandwell Community School | Alternative provision | Maintained | West Bromwich | 107 |
| Shenstone Lodge School | Special | Academy | Lichfield | 144 |
| Shireland Biomedical Utc | Secondary | Free school | West Bromwich | 520 |
| Shireland CBSO Academy | Secondary | Free school | West Bromwich | 457 |
| Shireland Collegiate Academy | Secondary | Academy | Smethwick | 1,585 |
| Shireland Hall Primary Academy | Primary | Academy | Smethwick | 661 |
| Shireland Technology Primary | Primary | Free school | Smethwick | 440 |
| Silvertrees Academy | Primary | Academy | Tipton | 314 |
| Springfield Primary School | Primary | Maintained | Rowley Regis | 439 |
| St Francis Xavier Catholic Primary School | Primary | Academy | Oldbury | 188 |
| St Gregory's Catholic Primary School | Primary | Academy | Smethwick | 230 |
| St James CofE Primary School | Primary | Maintained | Oldbury | 449 |
| St John Bosco Catholic Primary School | Primary | Academy | West Bromwich | 244 |
| St John's Church of England Primary Academy | Primary | Academy | Wednesbury | 193 |
| St Margaret's CofE Primary School | Primary | Maintained | Birmingham | 221 |
| St Martin's CofE Primary School | Primary | Maintained | Tipton | 233 |
| St Mary Magdalene CofE Voluntary Controlled Primary School | Primary | Maintained | West Bromwich | 229 |
| St Mary's Catholic Primary School | Primary | Academy | Wednesbury | 232 |
| St Matthew's CofE Primary School | Primary | Maintained | Smethwick | 470 |
| St Michael's Church of England High School | Secondary | Maintained | Rowley Regis | 1,213 |
| St Pauls Church of England Academy | Primary | Academy | Tipton | 195 |
| St Philip's Catholic Primary School | Primary | Academy | Smethwick | 209 |
| Stuart Bathurst Catholic High School | Secondary | Academy | Wednesbury | 807 |
| Summerhill Primary Academy | Primary | Academy | Tipton | 778 |
| Tameside Primary Academy | Primary | Academy | Wednesbury | 388 |
| Temple Meadow Primary School | Primary | Maintained | Cradley Heath | 418 |
| The Meadows School | Special | Maintained special | Oldbury | 262 |
| The Orchard School | Special | Maintained special | Oldbury | 173 |
| The Phoenix Collegiate | Secondary | Maintained | West Bromwich | 1,770 |
| The Primrose Centre | Alternative provision | Maintained | Rowley Regis | 12 |
| The Priory Primary School | Primary | Maintained | Wednesbury | 458 |
| The Westminster School | Special | Maintained special | Rowley Regis | 306 |
| Timbertree Academy | Primary | Academy | Cradley Heath | 221 |
| Tipton Green Junior School | Primary | Academy | Tipton | 342 |
| Tividale Community Primary School | Primary | Maintained | Oldbury | 445 |
| Tividale Hall Primary School | Primary | Maintained | Oldbury | 430 |
| Uplands Manor Primary School and Nursery | Primary | Maintained | Smethwick | 734 |
| Victoria Park Primary | Primary | Academy | Smethwick | 604 |
| Wednesbury Oak Academy | Primary | Academy | Tipton | 439 |
| West Bromwich Collegiate Academy | Secondary | Free school | West Bromwich | 774 |
| Whitecrest Primary School | Primary | Maintained | Birmingham | 197 |
| Windsor Olympus Academy | Secondary | Free school | Birmingham | 533 |
| Wodensborough Ormiston Academy | Secondary | Academy | Wednesbury | 1,119 |
| Wood Green Academy | Secondary | Academy | Wednesbury | 1,518 |
| Wood Green Junior School | Primary | Maintained | Wednesbury | 340 |
| Yew Tree Primary School | Primary | Maintained | Walsall | 615 |