Wolverhampton
111 state-funded schools with 50,107 pupils on roll, in the West Midlands region. Every school’s page has its published figures against Wolverhampton and England.
- Primary
- 72
- Secondary
- 19
- All-through
- 1
- Special
- 8
- Alternative provision
- 4
- Nursery
- 7
- Academies
- 72
- Maintained
- 31
- Free schools
- 6
- Maintained special
- 2
Map
Zoom in to see each school. Open the full map
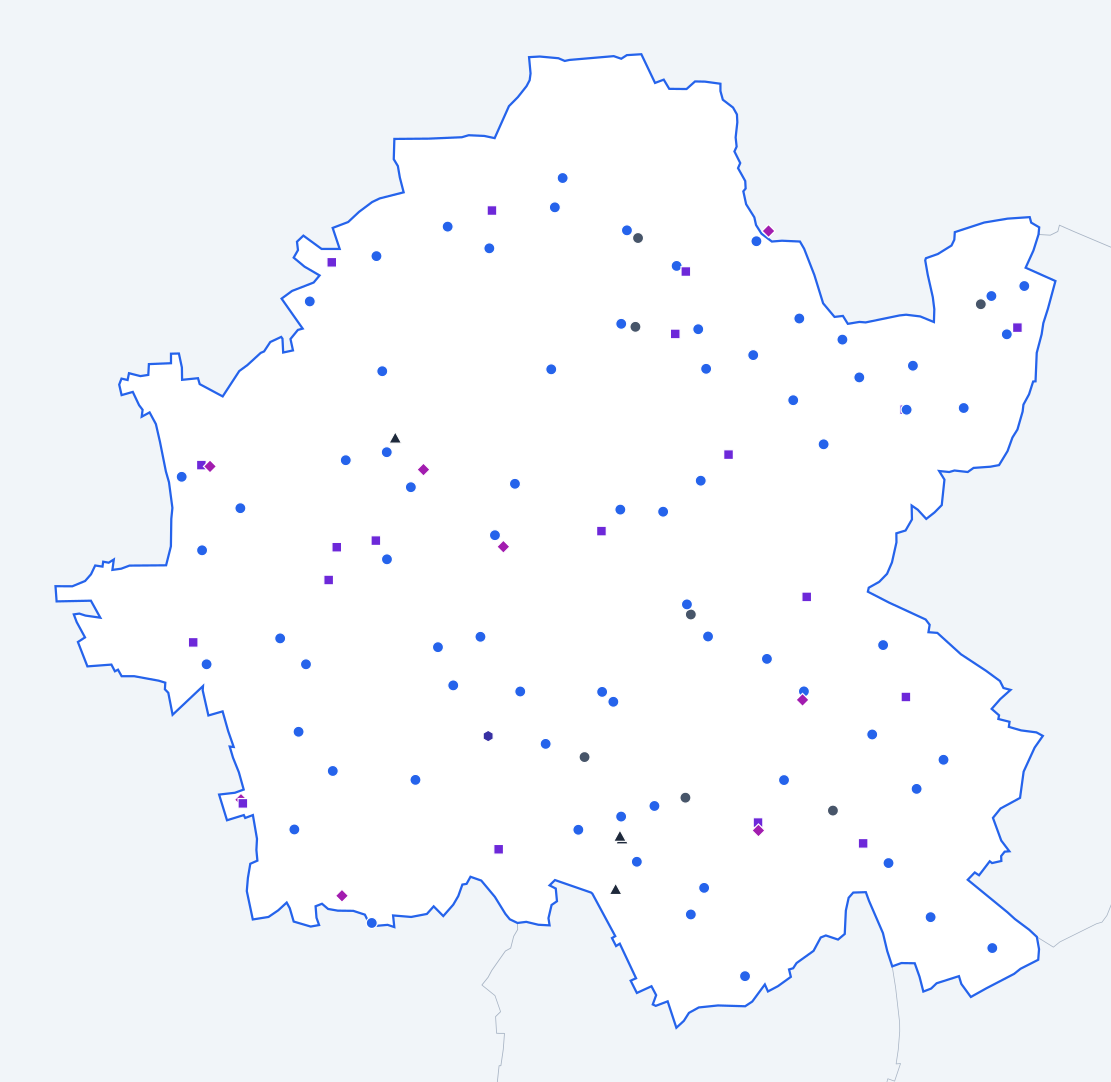
ONS, OS © Crown copyright 2025 · GIAS · © OpenStreetMap
Wolverhampton against England
Published figures for the authority’s schools, set against the same kind of school across England.
All state-funded schools
Overall absence
2024/256.4%
- England
- 6.8%
0.4 percentage points lower than England.
Show the figures as a table
| Year | Wolverhampton | England |
|---|---|---|
| 2017/18 | 4.6% | 4.8% |
| 2018/19 | 4.4% | 4.7% |
| 2020/21 | 4.5% | 4.6% |
| 2021/22 | 7.0% | 7.6% |
| 2022/23 | 7.2% | 7.4% |
| 2023/24 | 6.8% | 7.1% |
| 2024/25 | 6.4% | 6.8% |
Sessions missed for any reason, as a share of all possible sessions in the school year. Source: Department for Education, Explore Education Statistics, Pupil absence in schools in England, 2024/25.
Persistent absence
2024/2517.7%
- England
- 18.1%
0.4 percentage points lower than England.
Show the figures as a table
| Year | Wolverhampton | England |
|---|---|---|
| 2017/18 | 11.3% | 11.2% |
| 2018/19 | 10.3% | 10.9% |
| 2020/21 | 12.3% | 12.1% |
| 2021/22 | 21.3% | 22.5% |
| 2022/23 | 21.8% | 21.2% |
| 2023/24 | 19.5% | 20.0% |
| 2024/25 | 17.7% | 18.1% |
Pupils who missed 10% or more of their possible sessions, as a share of pupils. Source: Department for Education, Explore Education Statistics, Pupil absence in schools in England, 2024/25.
Severe absence
2024/251.8%
- England
- 2.4%
0.6 percentage points lower than England.
Show the figures as a table
| Year | Wolverhampton | England |
|---|---|---|
| 2017/18 | 1.0% | 0.8% |
| 2018/19 | 0.9% | 0.8% |
| 2020/21 | 1.2% | 1.1% |
| 2021/22 | 1.4% | 1.7% |
| 2022/23 | 1.9% | 2.0% |
| 2023/24 | 1.9% | 2.3% |
| 2024/25 | 1.8% | 2.4% |
Pupils who missed 50% or more of their possible sessions, as a share of pupils. Source: Department for Education, Explore Education Statistics, Pupil absence in schools in England, 2024/25.
Suspensions per 100 pupils
2024/256.46
- England
- 10.88
4.42 lower than England.
Show the figures as a table
| Year | Wolverhampton | England |
|---|---|---|
| 2017/18 | 4.64 | 5.08 |
| 2018/19 | 5.75 | 5.36 |
| 2019/20 | 3.26 | 3.76 |
| 2020/21 | 3.71 | 4.25 |
| 2021/22 | 5.61 | 6.91 |
| 2022/23 | 6.28 | 9.33 |
| 2023/24 | 6.42 | 11.31 |
| 2024/25 | 6.46 | 10.88 |
Suspensions in the school year for every 100 pupils on roll. One pupil can be suspended more than once. Source: Department for Education, Explore Education Statistics, Suspensions and permanent exclusions in England, 2024/25.
Permanent exclusions per 100 pupils
2024/250.16
- England
- 0.12
0.04 higher than England.
Show the figures as a table
| Year | Wolverhampton | England |
|---|---|---|
| 2017/18 | 0.23 | 0.10 |
| 2018/19 | 0.22 | 0.10 |
| 2019/20 | 0.16 | 0.06 |
| 2020/21 | 0.12 | 0.05 |
| 2021/22 | 0.16 | 0.08 |
| 2022/23 | 0.14 | 0.11 |
| 2023/24 | 0.20 | 0.13 |
| 2024/25 | 0.16 | 0.12 |
Permanent exclusions in the school year for every 100 pupils on roll. Source: Department for Education, Explore Education Statistics, Suspensions and permanent exclusions in England, 2024/25.
Eligible for free school meals
2024/2542.0%
- England
- 25.7%
16.3 percentage points higher than England.
Show the figures as a table
| Year | Wolverhampton | England |
|---|---|---|
| 2021/22 | 36.4% | 22.5% |
| 2022/23 | 38.3% | 23.8% |
| 2023/24 | 39.7% | 24.6% |
| 2024/25 | 42.0% | 25.7% |
Pupils known to be eligible for free school meals on census day in January. Source: Department for Education, Explore Education Statistics, Schools, pupils and their characteristics, 2024/25.
SEN support
2024/2514.8%
- England
- 14.0%
0.8 percentage points higher than England.
Show the figures as a table
| Year | Wolverhampton | England |
|---|---|---|
| 2021/22 | 13.6% | 12.4% |
| 2022/23 | 13.8% | 12.9% |
| 2023/24 | 14.0% | 13.4% |
| 2024/25 | 14.8% | 14.0% |
Pupils receiving special educational needs support without an education, health and care plan. Source: Department for Education, Explore Education Statistics, Schools, pupils and their characteristics, 2024/25.
Education, health and care plan
2024/254.6%
- England
- 5.2%
0.6 percentage points lower than England.
Show the figures as a table
| Year | Wolverhampton | England |
|---|---|---|
| 2021/22 | 3.7% | 3.8% |
| 2022/23 | 4.1% | 4.2% |
| 2023/24 | 4.4% | 4.7% |
| 2024/25 | 4.6% | 5.2% |
Pupils with an education, health and care plan. Source: Department for Education, Explore Education Statistics, Schools, pupils and their characteristics, 2024/25.
First language other than English
2024/2530.7%
- England
- 21.4%
9.3 percentage points higher than England.
Show the figures as a table
| Year | Wolverhampton | England |
|---|---|---|
| 2021/22 | 28.9% | 19.6% |
| 2022/23 | 29.6% | 20.2% |
| 2023/24 | 30.2% | 20.8% |
| 2024/25 | 30.7% | 21.4% |
Pupils whose first language is known or believed to be other than English. Source: Department for Education, Explore Education Statistics, Schools, pupils and their characteristics, 2024/25.
Pupils per qualified teacher
2025/2617.6
- England
- 18.5
0.9 lower than England.
Show the figures as a table
| Year | Wolverhampton | England |
|---|---|---|
| 2017/18 | 18.2 | 18.4 |
| 2018/19 | 18.5 | 18.6 |
| 2019/20 | 18.7 | 18.8 |
| 2020/21 | 18.2 | 18.5 |
| 2021/22 | 18.0 | 18.5 |
| 2022/23 | 17.9 | 18.5 |
| 2023/24 | 17.9 | 18.6 |
| 2024/25 | 18.0 | 18.6 |
| 2025/26 | 17.6 | 18.5 |
Full-time equivalent pupils for each full-time equivalent qualified teacher. Source: Department for Education, Explore Education Statistics, School workforce in England, 2025/26.
Teacher sickness absence
2024/255.3 days
- England
- 5.0 days
0.3 days higher than England.
Show the figures as a table
| Year | Wolverhampton | England |
|---|---|---|
| 2017/18 | 4.8 days | 4.0 days |
| 2018/19 | 4.8 days | 4.0 days |
| 2019/20 | Not published | Not published |
| 2020/21 | 3.9 days | 3.9 days |
| 2021/22 | 5.8 days | 6.3 days |
| 2022/23 | 5.3 days | 5.2 days |
| 2023/24 | 5.3 days | 5.3 days |
| 2024/25 | 5.3 days | 5.0 days |
Days lost to sickness absence in the school year, averaged across all teachers. Source: Department for Education, Explore Education Statistics, School workforce in England, 2024/25.
Primary schools
Overall absence
2024/255.4%
- England
- 5.2%
0.2 percentage points higher than England.
Show the figures as a table
| Year | Wolverhampton | England |
|---|---|---|
| 2017/18 | 4.2% | 4.2% |
| 2018/19 | 4.0% | 4.0% |
| 2020/21 | 3.6% | 3.6% |
| 2021/22 | 6.0% | 6.3% |
| 2022/23 | 6.3% | 5.9% |
| 2023/24 | 5.7% | 5.5% |
| 2024/25 | 5.4% | 5.2% |
Sessions missed for any reason, as a share of all possible sessions in the school year. Source: Department for Education, Explore Education Statistics, Pupil absence in schools in England, 2024/25.
Persistent absence
2024/2514.2%
- England
- 13.0%
1.2 percentage points higher than England.
Show the figures as a table
| Year | Wolverhampton | England |
|---|---|---|
| 2017/18 | 9.6% | 8.7% |
| 2018/19 | 8.3% | 8.2% |
| 2020/21 | 8.7% | 8.8% |
| 2021/22 | 17.2% | 17.7% |
| 2022/23 | 18.4% | 16.2% |
| 2023/24 | 15.6% | 14.6% |
| 2024/25 | 14.2% | 13.0% |
Pupils who missed 10% or more of their possible sessions, as a share of pupils. Source: Department for Education, Explore Education Statistics, Pupil absence in schools in England, 2024/25.
Severe absence
2024/250.9%
- England
- 0.9%
The same as England.
Show the figures as a table
| Year | Wolverhampton | England |
|---|---|---|
| 2017/18 | 0.8% | 0.4% |
| 2018/19 | 0.7% | 0.4% |
| 2020/21 | 1.0% | 0.7% |
| 2021/22 | 0.7% | 0.6% |
| 2022/23 | 1.0% | 0.7% |
| 2023/24 | 1.0% | 0.9% |
| 2024/25 | 0.9% | 0.9% |
Pupils who missed 50% or more of their possible sessions, as a share of pupils. Source: Department for Education, Explore Education Statistics, Pupil absence in schools in England, 2024/25.
Suspensions per 100 pupils
2024/251.82
- England
- 2.47
0.65 lower than England.
Show the figures as a table
| Year | Wolverhampton | England |
|---|---|---|
| 2017/18 | 0.91 | 1.40 |
| 2018/19 | 0.85 | 1.41 |
| 2019/20 | 0.61 | 1.00 |
| 2020/21 | 0.70 | 0.99 |
| 2021/22 | 1.00 | 1.42 |
| 2022/23 | 1.25 | 1.81 |
| 2023/24 | 1.79 | 2.27 |
| 2024/25 | 1.82 | 2.47 |
Suspensions in the school year for every 100 pupils on roll. One pupil can be suspended more than once. Source: Department for Education, Explore Education Statistics, Suspensions and permanent exclusions in England, 2024/25.
Permanent exclusions per 100 pupils
2024/250.07
- England
- 0.03
0.04 higher than England.
Show the figures as a table
| Year | Wolverhampton | England |
|---|---|---|
| 2017/18 | 0.05 | 0.03 |
| 2018/19 | 0.06 | 0.02 |
| 2019/20 | 0.05 | 0.02 |
| 2020/21 | 0.04 | 0.01 |
| 2021/22 | 0.04 | 0.02 |
| 2022/23 | 0.03 | 0.03 |
| 2023/24 | 0.07 | 0.03 |
| 2024/25 | 0.07 | 0.03 |
Permanent exclusions in the school year for every 100 pupils on roll. Source: Department for Education, Explore Education Statistics, Suspensions and permanent exclusions in England, 2024/25.
Reading, writing and maths: expected standard
2025/26 (provisional)65%
- England
- 63%
2 percentage points higher than England.
Show the figures as a table
| Year | Wolverhampton | England |
|---|---|---|
| 2021/22 | 61% | 59% |
| 2022/23 | 63% | 60% |
| 2023/24 | 62% | 61% |
| 2024/25 | 65% | 63% |
| 2025/26 (provisional) | 65% | 63% |
Pupils at the end of key stage 2 who met the expected standard in reading, writing and maths combined. Source: Department for Education, Explore Education Statistics, Key stage 2 attainment, 2025/26.
Reading, writing and maths: higher standard
2025/26 (provisional)9%
- England
- 9%
The same as England.
Show the figures as a table
| Year | Wolverhampton | England |
|---|---|---|
| 2021/22 | 8% | 7% |
| 2022/23 | 9% | 8% |
| 2023/24 | 7% | 8% |
| 2024/25 | 10% | 8% |
| 2025/26 (provisional) | 9% | 9% |
Pupils at the end of key stage 2 who met the higher standard in reading, writing and maths combined. Source: Department for Education, Explore Education Statistics, Key stage 2 attainment, 2025/26.
Eligible for free school meals
2024/2540.9%
- England
- 24.7%
16.2 percentage points higher than England.
Show the figures as a table
| Year | Wolverhampton | England |
|---|---|---|
| 2021/22 | 38.1% | 23.1% |
| 2022/23 | 39.0% | 24.0% |
| 2023/24 | 39.8% | 24.3% |
| 2024/25 | 40.9% | 24.7% |
Pupils known to be eligible for free school meals on census day in January. Source: Department for Education, Explore Education Statistics, Schools, pupils and their characteristics, 2024/25.
SEN support
2024/2514.4%
- England
- 15.0%
0.6 percentage points lower than England.
Show the figures as a table
| Year | Wolverhampton | England |
|---|---|---|
| 2021/22 | 12.9% | 13.0% |
| 2022/23 | 13.0% | 13.5% |
| 2023/24 | 13.1% | 14.1% |
| 2024/25 | 14.4% | 15.0% |
Pupils receiving special educational needs support without an education, health and care plan. Source: Department for Education, Explore Education Statistics, Schools, pupils and their characteristics, 2024/25.
Education, health and care plan
2024/252.7%
- England
- 3.5%
0.8 percentage points lower than England.
Show the figures as a table
| Year | Wolverhampton | England |
|---|---|---|
| 2021/22 | 1.6% | 2.3% |
| 2022/23 | 2.1% | 2.5% |
| 2023/24 | 2.3% | 3.0% |
| 2024/25 | 2.7% | 3.5% |
Pupils with an education, health and care plan. Source: Department for Education, Explore Education Statistics, Schools, pupils and their characteristics, 2024/25.
First language other than English
2024/2530.7%
- England
- 23.4%
7.3 percentage points higher than England.
Show the figures as a table
| Year | Wolverhampton | England |
|---|---|---|
| 2021/22 | 29.4% | 21.2% |
| 2022/23 | 29.3% | 22.0% |
| 2023/24 | 29.8% | 22.8% |
| 2024/25 | 30.7% | 23.4% |
Pupils whose first language is known or believed to be other than English. Source: Department for Education, Explore Education Statistics, Schools, pupils and their characteristics, 2024/25.
Pupils per qualified teacher
2025/2621.1
- England
- 21.2
0.1 lower than England.
Show the figures as a table
| Year | Wolverhampton | England |
|---|---|---|
| 2017/18 | 22.9 | 21.3 |
| 2018/19 | 22.5 | 21.4 |
| 2019/20 | 22.7 | 21.4 |
| 2020/21 | 21.7 | 21.1 |
| 2021/22 | 21.6 | 21.0 |
| 2022/23 | 21.2 | 21.1 |
| 2023/24 | 21.6 | 21.2 |
| 2024/25 | 21.9 | 21.3 |
| 2025/26 | 21.1 | 21.2 |
Full-time equivalent pupils for each full-time equivalent qualified teacher. Source: Department for Education, Explore Education Statistics, School workforce in England, 2025/26.
Secondary schools
Overall absence
2024/257.4%
- England
- 8.4%
1.0 percentage point lower than England.
Show the figures as a table
| Year | Wolverhampton | England |
|---|---|---|
| 2017/18 | 5.0% | 5.5% |
| 2018/19 | 4.9% | 5.5% |
| 2020/21 | 5.1% | 5.5% |
| 2021/22 | 8.0% | 9.0% |
| 2022/23 | 8.1% | 9.0% |
| 2023/24 | 7.9% | 8.9% |
| 2024/25 | 7.4% | 8.4% |
Sessions missed for any reason, as a share of all possible sessions in the school year. Source: Department for Education, Explore Education Statistics, Pupil absence in schools in England, 2024/25.
Persistent absence
2024/2520.9%
- England
- 23.4%
2.5 percentage points lower than England.
Show the figures as a table
| Year | Wolverhampton | England |
|---|---|---|
| 2017/18 | 12.9% | 13.9% |
| 2018/19 | 12.1% | 13.7% |
| 2020/21 | 14.6% | 14.8% |
| 2021/22 | 25.7% | 27.7% |
| 2022/23 | 25.1% | 26.5% |
| 2023/24 | 23.1% | 25.6% |
| 2024/25 | 20.9% | 23.4% |
Pupils who missed 10% or more of their possible sessions, as a share of pupils. Source: Department for Education, Explore Education Statistics, Pupil absence in schools in England, 2024/25.
Severe absence
2024/252.7%
- England
- 3.9%
1.2 percentage points lower than England.
Show the figures as a table
| Year | Wolverhampton | England |
|---|---|---|
| 2017/18 | 1.2% | 1.2% |
| 2018/19 | 1.2% | 1.3% |
| 2020/21 | 1.4% | 1.5% |
| 2021/22 | 2.0% | 2.7% |
| 2022/23 | 2.7% | 3.4% |
| 2023/24 | 2.7% | 3.8% |
| 2024/25 | 2.7% | 3.9% |
Pupils who missed 50% or more of their possible sessions, as a share of pupils. Source: Department for Education, Explore Education Statistics, Pupil absence in schools in England, 2024/25.
Suspensions per 100 pupils
2024/2511.62
- England
- 21.24
9.62 lower than England.
Show the figures as a table
| Year | Wolverhampton | England |
|---|---|---|
| 2017/18 | 9.28 | 10.13 |
| 2018/19 | 12.24 | 10.75 |
| 2019/20 | 6.46 | 7.43 |
| 2020/21 | 7.42 | 8.48 |
| 2021/22 | 11.29 | 13.96 |
| 2022/23 | 12.41 | 18.90 |
| 2023/24 | 11.78 | 22.61 |
| 2024/25 | 11.62 | 21.24 |
Suspensions in the school year for every 100 pupils on roll. One pupil can be suspended more than once. Source: Department for Education, Explore Education Statistics, Suspensions and permanent exclusions in England, 2024/25.
Permanent exclusions per 100 pupils
2024/250.27
- England
- 0.23
0.04 higher than England.
Show the figures as a table
| Year | Wolverhampton | England |
|---|---|---|
| 2017/18 | 0.50 | 0.20 |
| 2018/19 | 0.45 | 0.20 |
| 2019/20 | 0.30 | 0.13 |
| 2020/21 | 0.23 | 0.10 |
| 2021/22 | 0.33 | 0.16 |
| 2022/23 | 0.29 | 0.22 |
| 2023/24 | 0.36 | 0.25 |
| 2024/25 | 0.27 | 0.23 |
Permanent exclusions in the school year for every 100 pupils on roll. Source: Department for Education, Explore Education Statistics, Suspensions and permanent exclusions in England, 2024/25.
Attainment 8
2025/26 (provisional)46.4
- England
- 47.4
1.0 lower than England.
Show the figures as a table
| Year | Wolverhampton | England |
|---|---|---|
| 2021/22 | 49.1 | 49.8 |
| 2022/23 | 46.6 | 47.2 |
| 2023/24 | 45.2 | 46.9 |
| 2024/25 | 45.9 | 47.1 |
| 2025/26 (provisional) | 46.4 | 47.4 |
The average of pupils' points across eight GCSE-level qualifications, with English and maths counted twice. Source: Department for Education, Explore Education Statistics, Key stage 4 performance, 2025/26.
English and maths: grade 4 or above
2025/26 (provisional)63%
- England
- 66%
3 percentage points lower than England.
Show the figures as a table
| Year | Wolverhampton | England |
|---|---|---|
| 2021/22 | 66% | 70% |
| 2022/23 | 61% | 67% |
| 2023/24 | 61% | 67% |
| 2024/25 | 63% | 66% |
| 2025/26 (provisional) | 63% | 66% |
Pupils at the end of key stage 4 with grade 4 or above in both English and maths. Source: Department for Education, Explore Education Statistics, Key stage 4 performance, 2025/26.
English and maths: grade 5 or above
2025/26 (provisional)44%
- England
- 48%
4 percentage points lower than England.
Show the figures as a table
| Year | Wolverhampton | England |
|---|---|---|
| 2021/22 | 46% | 51% |
| 2022/23 | 40% | 46% |
| 2023/24 | 41% | 47% |
| 2024/25 | 41% | 47% |
| 2025/26 (provisional) | 44% | 48% |
Pupils at the end of key stage 4 with grade 5 or above in both English and maths. Source: Department for Education, Explore Education Statistics, Key stage 4 performance, 2025/26.
Eligible for free school meals
2024/2543.4%
- England
- 25.8%
17.6 percentage points higher than England.
Show the figures as a table
| Year | Wolverhampton | England |
|---|---|---|
| 2021/22 | 34.5% | 20.9% |
| 2022/23 | 37.7% | 22.7% |
| 2023/24 | 39.9% | 24.1% |
| 2024/25 | 43.4% | 25.8% |
Pupils known to be eligible for free school meals on census day in January. Source: Department for Education, Explore Education Statistics, Schools, pupils and their characteristics, 2024/25.
SEN support
2024/2515.6%
- England
- 13.4%
2.2 percentage points higher than England.
Show the figures as a table
| Year | Wolverhampton | England |
|---|---|---|
| 2021/22 | 15.2% | 11.9% |
| 2022/23 | 15.0% | 12.4% |
| 2023/24 | 15.3% | 12.9% |
| 2024/25 | 15.6% | 13.4% |
Pupils receiving special educational needs support without an education, health and care plan. Source: Department for Education, Explore Education Statistics, Schools, pupils and their characteristics, 2024/25.
Education, health and care plan
2024/252.2%
- England
- 3.1%
0.9 percentage points lower than England.
Show the figures as a table
| Year | Wolverhampton | England |
|---|---|---|
| 2021/22 | 1.8% | 2.2% |
| 2022/23 | 2.0% | 2.4% |
| 2023/24 | 2.1% | 2.7% |
| 2024/25 | 2.2% | 3.1% |
Pupils with an education, health and care plan. Source: Department for Education, Explore Education Statistics, Schools, pupils and their characteristics, 2024/25.
First language other than English
2024/2531.8%
- England
- 19.2%
12.6 percentage points higher than England.
Show the figures as a table
| Year | Wolverhampton | England |
|---|---|---|
| 2021/22 | 29.1% | 17.5% |
| 2022/23 | 31.0% | 18.1% |
| 2023/24 | 31.7% | 18.6% |
| 2024/25 | 31.8% | 19.2% |
Pupils whose first language is known or believed to be other than English. Source: Department for Education, Explore Education Statistics, Schools, pupils and their characteristics, 2024/25.
Pupils per qualified teacher
2025/2615.9
- England
- 17.3
1.4 lower than England.
Show the figures as a table
| Year | Wolverhampton | England |
|---|---|---|
| 2017/18 | 15.6 | 16.5 |
| 2018/19 | 16.3 | 16.8 |
| 2019/20 | 16.5 | 17.2 |
| 2020/21 | 16.6 | 17.1 |
| 2021/22 | 16.1 | 17.1 |
| 2022/23 | 16.4 | 17.2 |
| 2023/24 | 16.1 | 17.4 |
| 2024/25 | 16.1 | 17.3 |
| 2025/26 | 15.9 | 17.3 |
Full-time equivalent pupils for each full-time equivalent qualified teacher. Source: Department for Education, Explore Education Statistics, School workforce in England, 2025/26.
Special schools
Overall absence
2024/2510.9%
- England
- 12.8%
1.9 percentage points lower than England.
Show the figures as a table
| Year | Wolverhampton | England |
|---|---|---|
| 2017/18 | 9.1% | 10.2% |
| 2018/19 | 9.0% | 10.1% |
| 2020/21 | 16.1% | 15.2% |
| 2021/22 | 11.4% | 13.2% |
| 2022/23 | 11.6% | 13.0% |
| 2023/24 | 11.9% | 13.0% |
| 2024/25 | 10.9% | 12.8% |
Sessions missed for any reason, as a share of all possible sessions in the school year. Source: Department for Education, Explore Education Statistics, Pupil absence in schools in England, 2024/25.
Persistent absence
2024/2532.8%
- England
- 35.3%
2.5 percentage points lower than England.
Show the figures as a table
| Year | Wolverhampton | England |
|---|---|---|
| 2017/18 | 27.7% | 29.6% |
| 2018/19 | 26.4% | 28.8% |
| 2020/21 | 60.6% | 48.9% |
| 2021/22 | 35.0% | 40.4% |
| 2022/23 | 36.4% | 38.3% |
| 2023/24 | 37.5% | 37.2% |
| 2024/25 | 32.8% | 35.3% |
Pupils who missed 10% or more of their possible sessions, as a share of pupils. Source: Department for Education, Explore Education Statistics, Pupil absence in schools in England, 2024/25.
Severe absence
2024/253.9%
- England
- 6.9%
3.0 percentage points lower than England.
Show the figures as a table
| Year | Wolverhampton | England |
|---|---|---|
| 2017/18 | 2.2% | 4.4% |
| 2018/19 | 2.7% | 4.6% |
| 2020/21 | 4.6% | 5.6% |
| 2021/22 | 4.9% | 5.8% |
| 2022/23 | 4.6% | 6.2% |
| 2023/24 | 5.2% | 6.7% |
| 2024/25 | 3.9% | 6.9% |
Pupils who missed 50% or more of their possible sessions, as a share of pupils. Source: Department for Education, Explore Education Statistics, Pupil absence in schools in England, 2024/25.
Suspensions per 100 pupils
2024/2516.19
- England
- 12.32
3.87 higher than England.
Show the figures as a table
| Year | Wolverhampton | England |
|---|---|---|
| 2017/18 | 24.25 | 12.34 |
| 2018/19 | 17.85 | 11.32 |
| 2019/20 | 13.00 | 7.76 |
| 2020/21 | 9.65 | 7.29 |
| 2021/22 | 11.85 | 9.60 |
| 2022/23 | 10.30 | 10.99 |
| 2023/24 | 13.40 | 12.62 |
| 2024/25 | 16.19 | 12.32 |
Suspensions in the school year for every 100 pupils on roll. One pupil can be suspended more than once. Source: Department for Education, Explore Education Statistics, Suspensions and permanent exclusions in England, 2024/25.
Permanent exclusions per 100 pupils
2024/250.27
- England
- 0.08
0.19 higher than England.
Show the figures as a table
| Year | Wolverhampton | England |
|---|---|---|
| 2017/18 | 0.00 | 0.07 |
| 2018/19 | 0.34 | 0.06 |
| 2019/20 | 0.32 | 0.04 |
| 2020/21 | 0.10 | 0.03 |
| 2021/22 | 0.10 | 0.05 |
| 2022/23 | 0.10 | 0.08 |
| 2023/24 | 0.28 | 0.08 |
| 2024/25 | 0.27 | 0.08 |
Permanent exclusions in the school year for every 100 pupils on roll. Source: Department for Education, Explore Education Statistics, Suspensions and permanent exclusions in England, 2024/25.
Eligible for free school meals
2024/2563.2%
- England
- 48.8%
14.4 percentage points higher than England.
Show the figures as a table
| Year | Wolverhampton | England |
|---|---|---|
| 2021/22 | 55.1% | 44.4% |
| 2022/23 | 56.4% | 45.6% |
| 2023/24 | 59.2% | 47.1% |
| 2024/25 | 63.2% | 48.8% |
Pupils known to be eligible for free school meals on census day in January. Source: Department for Education, Explore Education Statistics, Schools, pupils and their characteristics, 2024/25.
SEN support
2024/250.4%
- England
- 0.5%
0.1 percentage points lower than England.
Show the figures as a table
| Year | Wolverhampton | England |
|---|---|---|
| 2021/22 | 0.2% | 0.9% |
| 2022/23 | 0.3% | 0.8% |
| 2023/24 | 0.6% | 0.7% |
| 2024/25 | 0.4% | 0.5% |
Pupils receiving special educational needs support without an education, health and care plan. Source: Department for Education, Explore Education Statistics, Schools, pupils and their characteristics, 2024/25.
Education, health and care plan
2024/2599.6%
- England
- 99.5%
0.1 percentage points higher than England.
Show the figures as a table
| Year | Wolverhampton | England |
|---|---|---|
| 2021/22 | 99.8% | 99.1% |
| 2022/23 | 99.7% | 99.2% |
| 2023/24 | 99.4% | 99.3% |
| 2024/25 | 99.6% | 99.5% |
Pupils with an education, health and care plan. Source: Department for Education, Explore Education Statistics, Schools, pupils and their characteristics, 2024/25.
First language other than English
2024/2514.2%
- England
- 14.4%
0.2 percentage points lower than England.
Show the figures as a table
| Year | Wolverhampton | England |
|---|---|---|
| 2021/22 | 16.9% | 14.5% |
| 2022/23 | 15.8% | 14.4% |
| 2023/24 | 14.4% | 14.4% |
| 2024/25 | 14.2% | 14.4% |
Pupils whose first language is known or believed to be other than English. Source: Department for Education, Explore Education Statistics, Schools, pupils and their characteristics, 2024/25.
Pupils per qualified teacher
2025/267.2
- England
- 7.3
0.1 lower than England.
Show the figures as a table
| Year | Wolverhampton | England |
|---|---|---|
| 2017/18 | 5.8 | 6.7 |
| 2018/19 | 6.4 | 6.8 |
| 2019/20 | 6.9 | 7.0 |
| 2020/21 | 6.6 | 6.8 |
| 2021/22 | 6.6 | 6.9 |
| 2022/23 | 6.5 | 7.0 |
| 2023/24 | 6.8 | 7.1 |
| 2024/25 | 7.0 | 7.3 |
| 2025/26 | 7.2 | 7.3 |
Full-time equivalent pupils for each full-time equivalent qualified teacher. Source: Department for Education, Explore Education Statistics, School workforce in England, 2025/26.
Schools in Wolverhampton
Listed by name. Filter by phase or type; sort by name or size. Nothing here is sorted by results.
Showing 111 of 111 schools in Wolverhampton.
| School | Phase | Type | Town | Pupils |
|---|---|---|---|---|
| Aldersley High School | Secondary | Academy | Wolverhampton | 1,262 |
| Ashmore Park Nursery School | Nursery | Maintained | Wolverhampton | 65 |
| Bantock Primary School | Primary | Academy | Wolverhampton | 434 |
| Berrybrook Primary School | Primary | Academy | Wolverhampton | 214 |
| Bilston Church of England Primary School | Primary | Maintained | Bilston | 456 |
| Bilston Nursery School | Nursery | Maintained | Bilston | 162 |
| Broadmeadow Special School | Special | Academy | Wolverhampton | 73 |
| Bushbury Hill Primary School | Primary | Maintained | Wolverhampton | 243 |
| Bushbury Lane Academy | Primary | Academy | Wolverhampton | 228 |
| Bushbury Nursery School | Nursery | Maintained | Wolverhampton | 103 |
| Castlecroft Primary School | Primary | Maintained | Wolverhampton | 228 |
| Christ Church (Church of England) Infant and Nursery School | Primary | Maintained | Wolverhampton | 203 |
| Christ Church (Church of England) Junior School | Primary | Maintained | Wolverhampton | 244 |
| Claregate Primary School | Primary | Maintained | Wolverhampton | 390 |
| Colton Hills Community School | Secondary | Maintained | Wolverhampton | 1,163 |
| Coppice Performing Arts School | Secondary | Academy | Wolverhampton | 989 |
| Corpus Christi Catholic Primary Academy | Primary | Academy | Wolverhampton | 195 |
| D'Eyncourt Primary School | Primary | Academy | Wolverhampton | 302 |
| Dovecotes Primary School | Primary | Academy | Wolverhampton | 277 |
| Dunstall Hill Primary School | Primary | Academy | Wolverhampton | 458 |
| East Park Academy | Primary | Academy | Wolverhampton | 671 |
| Eastfield Nursery School | Nursery | Maintained | Wolverhampton | 116 |
| Eastfield Primary School | Primary | Maintained | Wolverhampton | 400 |
| Edward the Elder Primary School | Primary | Academy | Wolverhampton | 228 |
| Elston Hall Primary School | Primary | Academy | Wolverhampton | 683 |
| Evergreen Academy | Alternative provision | Academy | Wolverhampton | 23 |
| Fallings Park Primary School | Primary | Academy | Wolverhampton | 685 |
| Field View Primary School | Primary | Academy | Bilston | 427 |
| Goldthorn Park Primary School | Primary | Academy | Wolverhampton | 436 |
| Graiseley Primary School | Primary | Maintained | Wolverhampton | 230 |
| Green Park School | Special | Maintained special | Bilston | 147 |
| Grove Primary Academy | Primary | Academy | Wolverhampton | 441 |
| Heath Park | Secondary | Academy | Wolverhampton | 1,153 |
| Highfields School | Secondary | Academy | Wolverhampton | 1,765 |
| Hill Avenue Academy | Primary | Academy | Wolverhampton | 346 |
| Holy Rosary Catholic Primary Academy | Primary | Academy | Wolverhampton | 225 |
| Holy Trinity Catholic Primary School | Primary | Maintained | Bilston | 242 |
| Lanesfield Primary School | Primary | Maintained | Wolverhampton | 283 |
| Long Knowle Primary School | Primary | Maintained | Wolverhampton | 212 |
| Low Hill Nursery School | Nursery | Maintained | Wolverhampton | 136 |
| Loxdale Primary School | Primary | Maintained | Bilston | 450 |
| Manor Primary School | Primary | Academy | Bilston | 658 |
| Merridale Primary School | Primary | Academy | Wolverhampton | 240 |
| Moreton School | Secondary | Academy | Wolverhampton | 1,130 |
| Moseley Park | Secondary | Academy | Bilston | 1,069 |
| Nishkam Primary School Wolverhampton | Primary | Free school | Wolverhampton | 418 |
| Northwood Park Primary School | Primary | Academy | Wolverhampton | 609 |
| Oak Meadow Primary School | Primary | Academy | Wolverhampton | 412 |
| Ormiston NEW Academy | Secondary | Academy | Wolverhampton | 1,094 |
| Ormiston SWB Academy | Secondary | Academy | Bilston | 1,209 |
| Our Lady and St Chad Catholic Academy | Secondary | Academy | Wolverhampton | 1,222 |
| Palmers Cross Primary School | Primary | Academy | Wolverhampton | 223 |
| Parkfield Primary School | Primary | Academy | Wolverhampton | 191 |
| Penn Fields School | Special | Maintained special | Wolverhampton | 185 |
| Penn Hall School | Special | Academy | Wolverhampton | 150 |
| Perry Hall Primary School | Primary | Academy | Wolverhampton | 502 |
| Phoenix Nursery School | Nursery | Maintained | Wolverhampton | 41 |
| Pine Green Academy | Special | Academy | Wolverhampton | 119 |
| Rakegate Primary School | Primary | Maintained | Wolverhampton | 472 |
| Smestow Academy | Secondary | Academy | Wolverhampton | 589 |
| Spring Vale Primary School | Primary | Academy | Wolverhampton | 464 |
| Springdale Primary School | Primary | Academy | Wolverhampton | 406 |
| SS Mary and John's Catholic Primary Academy | Primary | Academy | Wolverhampton | 229 |
| SS Peter and Paul Catholic Primary Academy & Nursery | Primary | Academy | Wolverhampton | 225 |
| St Alban's Church of England Primary Academy | Primary | Academy | Wolverhampton | 191 |
| St Andrew's Church of England Primary School | Primary | Academy | Wolverhampton | 469 |
| St Anthony's Catholic Primary Academy | Primary | Academy | Wolverhampton | 333 |
| St Bartholomew's Church of England Primary School | Primary | Academy | Wolverhampton | 423 |
| St Edmund's Catholic Academy | Secondary | Academy | Wolverhampton | 1,171 |
| St Jude's Church of England Primary Academy | Primary | Academy | Wolverhampton | 490 |
| St Luke's Church of England Aided Primary School | Primary | Maintained | Wolverhampton | 477 |
| St Martin's Church of England Primary School | Primary | Academy | Bilston | 221 |
| St Mary's Catholic Primary Academy | Primary | Academy | Wolverhampton | 472 |
| St Matthias School | Secondary | Maintained | Wolverhampton | 805 |
| St Michael's Catholic Primary Academy and Nursery | Primary | Academy | Wolverhampton | 219 |
| St Michael's CofE Primary Academy | Primary | Academy | Wolverhampton | 224 |
| St Patrick's Catholic Primary Academy | Primary | Academy | Wolverhampton | 248 |
| St Paul's Church of England Aided Primary School | Primary | Maintained | Wolverhampton | 222 |
| St Peter's Collegiate Academy | Secondary | Academy | Wolverhampton | 1,329 |
| St Regis Church of England Academy | Secondary | Academy | Wolverhampton | 798 |
| St Stephen's Church of England Primary School | Primary | Academy | Wolverhampton | 246 |
| St Teresa's Catholic Primary Academy | Primary | Academy | Wolverhampton | 152 |
| St Thomas' Church of England Primary Academy | Primary | Academy | Wolverhampton | 205 |
| Stow Heath Primary School | Primary | Maintained | Willenhall | 475 |
| Stowlawn Primary School | Primary | Maintained | Bilston | 428 |
| Tettenhall Wood School | Special | Academy | Wolverhampton | 172 |
| The Kairos Academy (KS3) | Alternative provision | Academy | Wolverhampton | 19 |
| The Kairos Academy (KS4) | Alternative provision | Academy | Wolverhampton | 48 |
| The Khalsa Academy Wolverhampton | Secondary | Free school | Wolverhampton | 763 |
| The Royal School, Wolverhampton | All-through | Free school | Wolverhampton | 1,488 |
| The Vireo Academy | Alternative provision | Academy | Wolverhampton | 31 |
| Thomas Telford University Technical College | Secondary | Free school | Wolverhampton | 993 |
| Trinity CofE Primary Academy | Primary | Academy | Wolverhampton | 700 |
| Uplands Junior School | Primary | Academy | Wolverhampton | Not published |
| Villiers Primary School | Primary | Academy | Bilston | 662 |
| Warstones Primary School | Primary | Academy | Wolverhampton | 465 |
| Wednesfield Academy | Secondary | Academy | Wolverhampton | 1,025 |
| Wednesfield Technology Primary | Primary | Free school | Wolverhampton | 100 |
| West Park Primary School | Primary | Maintained | Wolverhampton | 278 |
| Westacre Infant School | Primary | Academy | Wolverhampton | 257 |
| Westcroft School | Special | Academy | Wolverhampton | 207 |
| Whitgreave Primary School | Primary | Maintained | Wolverhampton | 442 |
| Wilkinson Primary School | Primary | Maintained | Bilston | 480 |
| Windsor Nursery School | Nursery | Maintained | Wolverhampton | 93 |
| Woden Primary School | Primary | Academy | Wolverhampton | 448 |
| Wodensfield Primary School | Primary | Maintained | Wolverhampton | 457 |
| Wolverhampton Girls' High School | Secondary | Academy | Wolverhampton | 1,211 |
| Wolverhampton Vocational Training Centre | Special | Free school | Wolverhampton | 71 |
| Wood End Primary School | Primary | Maintained | Wolverhampton | 221 |
| Woodfield Primary School | Primary | Academy | Wolverhampton | 637 |
| Woodthorne Primary School | Primary | Academy | Wolverhampton | 396 |