Plymouth
98 state-funded schools with 37,039 pupils on roll, in the South West region. Every school’s page has its published figures against Plymouth and England.
- Primary
- 69
- Secondary
- 19
- Special
- 7
- Alternative provision
- 1
- Nursery
- 2
- Academies
- 79
- Maintained
- 10
- Maintained special
- 5
- Free schools
- 4
Map
Zoom in to see each school. Open the full map
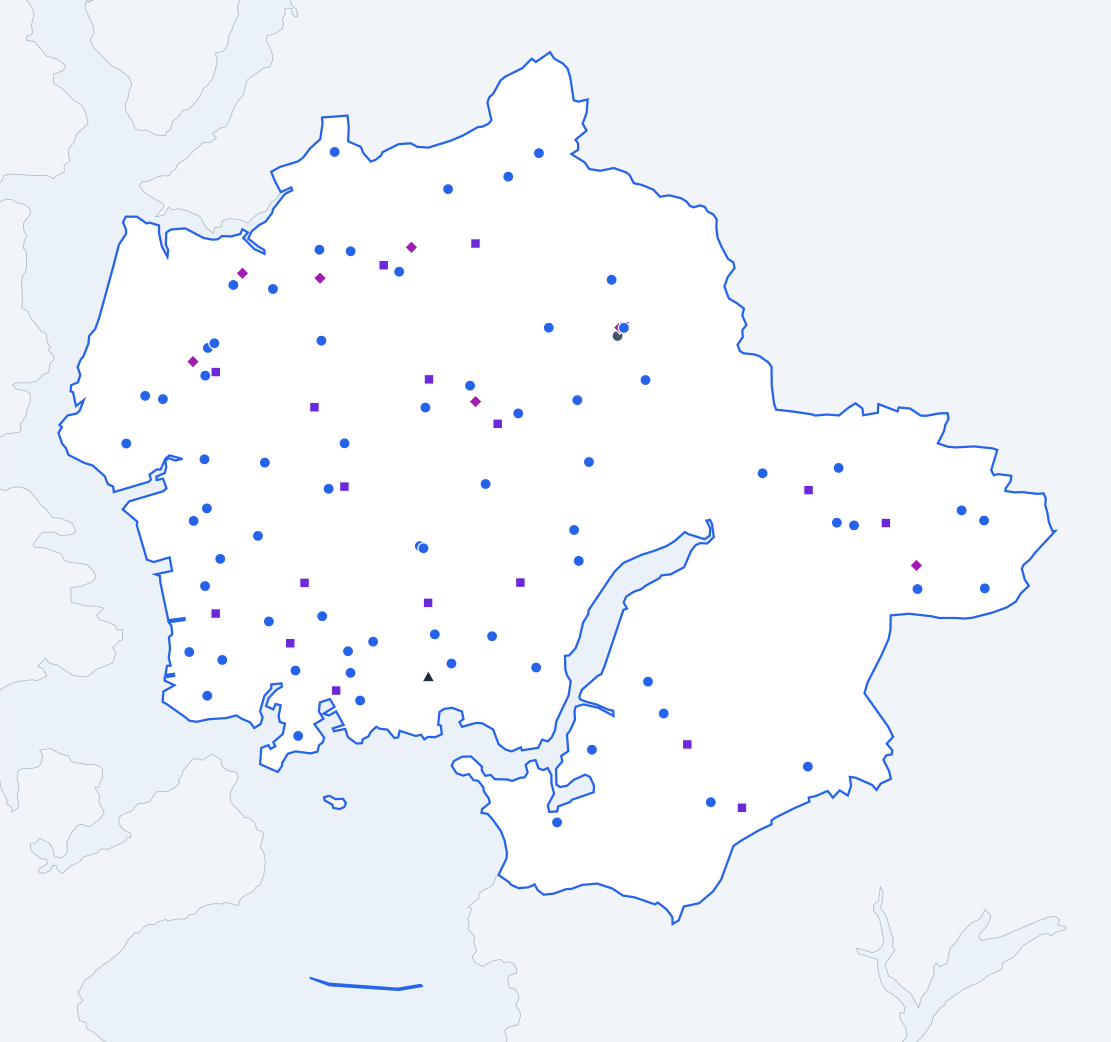
ONS, OS © Crown copyright 2025 · GIAS · © OpenStreetMap
Plymouth against England
Published figures for the authority’s schools, set against the same kind of school across England.
All state-funded schools
Overall absence
2024/257.6%
- England
- 6.8%
0.8 percentage points higher than England.
Show the figures as a table
| Year | Plymouth | England |
|---|---|---|
| 2017/18 | 5.1% | 4.8% |
| 2018/19 | 5.1% | 4.7% |
| 2020/21 | 4.9% | 4.6% |
| 2021/22 | 8.8% | 7.6% |
| 2022/23 | 8.2% | 7.4% |
| 2023/24 | 8.3% | 7.1% |
| 2024/25 | 7.6% | 6.8% |
Sessions missed for any reason, as a share of all possible sessions in the school year. Source: Department for Education, Explore Education Statistics, Pupil absence in schools in England, 2024/25.
Persistent absence
2024/2520.8%
- England
- 18.1%
2.7 percentage points higher than England.
Show the figures as a table
| Year | Plymouth | England |
|---|---|---|
| 2017/18 | 12.2% | 11.2% |
| 2018/19 | 12.2% | 10.9% |
| 2020/21 | 12.9% | 12.1% |
| 2021/22 | 28.1% | 22.5% |
| 2022/23 | 24.1% | 21.2% |
| 2023/24 | 23.6% | 20.0% |
| 2024/25 | 20.8% | 18.1% |
Pupils who missed 10% or more of their possible sessions, as a share of pupils. Source: Department for Education, Explore Education Statistics, Pupil absence in schools in England, 2024/25.
Severe absence
2024/253.3%
- England
- 2.4%
0.9 percentage points higher than England.
Show the figures as a table
| Year | Plymouth | England |
|---|---|---|
| 2017/18 | 0.5% | 0.8% |
| 2018/19 | 0.6% | 0.8% |
| 2020/21 | 1.0% | 1.1% |
| 2021/22 | 2.1% | 1.7% |
| 2022/23 | 2.6% | 2.0% |
| 2023/24 | 3.2% | 2.3% |
| 2024/25 | 3.3% | 2.4% |
Pupils who missed 50% or more of their possible sessions, as a share of pupils. Source: Department for Education, Explore Education Statistics, Pupil absence in schools in England, 2024/25.
Suspensions per 100 pupils
2024/2515.63
- England
- 10.88
4.75 higher than England.
Show the figures as a table
| Year | Plymouth | England |
|---|---|---|
| 2017/18 | 7.04 | 5.08 |
| 2018/19 | 7.95 | 5.36 |
| 2019/20 | 4.23 | 3.76 |
| 2020/21 | 6.71 | 4.25 |
| 2021/22 | 10.05 | 6.91 |
| 2022/23 | 13.23 | 9.33 |
| 2023/24 | 17.11 | 11.31 |
| 2024/25 | 15.63 | 10.88 |
Suspensions in the school year for every 100 pupils on roll. One pupil can be suspended more than once. Source: Department for Education, Explore Education Statistics, Suspensions and permanent exclusions in England, 2024/25.
Permanent exclusions per 100 pupils
2024/250.13
- England
- 0.12
0.01 higher than England.
Show the figures as a table
| Year | Plymouth | England |
|---|---|---|
| 2017/18 | 0.10 | 0.10 |
| 2018/19 | 0.13 | 0.10 |
| 2019/20 | 0.11 | 0.06 |
| 2020/21 | 0.09 | 0.05 |
| 2021/22 | 0.11 | 0.08 |
| 2022/23 | 0.13 | 0.11 |
| 2023/24 | 0.21 | 0.13 |
| 2024/25 | 0.13 | 0.12 |
Permanent exclusions in the school year for every 100 pupils on roll. Source: Department for Education, Explore Education Statistics, Suspensions and permanent exclusions in England, 2024/25.
Eligible for free school meals
2024/2526.5%
- England
- 25.7%
0.8 percentage points higher than England.
Show the figures as a table
| Year | Plymouth | England |
|---|---|---|
| 2021/22 | 24.7% | 22.5% |
| 2022/23 | 26.0% | 23.8% |
| 2023/24 | 26.4% | 24.6% |
| 2024/25 | 26.5% | 25.7% |
Pupils known to be eligible for free school meals on census day in January. Source: Department for Education, Explore Education Statistics, Schools, pupils and their characteristics, 2024/25.
SEN support
2024/2515.5%
- England
- 14.0%
1.5 percentage points higher than England.
Show the figures as a table
| Year | Plymouth | England |
|---|---|---|
| 2021/22 | 13.8% | 12.4% |
| 2022/23 | 14.0% | 12.9% |
| 2023/24 | 14.5% | 13.4% |
| 2024/25 | 15.5% | 14.0% |
Pupils receiving special educational needs support without an education, health and care plan. Source: Department for Education, Explore Education Statistics, Schools, pupils and their characteristics, 2024/25.
Education, health and care plan
2024/254.9%
- England
- 5.2%
0.3 percentage points lower than England.
Show the figures as a table
| Year | Plymouth | England |
|---|---|---|
| 2021/22 | 3.8% | 3.8% |
| 2022/23 | 4.4% | 4.2% |
| 2023/24 | 4.6% | 4.7% |
| 2024/25 | 4.9% | 5.2% |
Pupils with an education, health and care plan. Source: Department for Education, Explore Education Statistics, Schools, pupils and their characteristics, 2024/25.
First language other than English
2024/2510.6%
- England
- 21.4%
10.8 percentage points lower than England.
Show the figures as a table
| Year | Plymouth | England |
|---|---|---|
| 2021/22 | 8.0% | 19.6% |
| 2022/23 | 8.7% | 20.2% |
| 2023/24 | 9.5% | 20.8% |
| 2024/25 | 10.6% | 21.4% |
Pupils whose first language is known or believed to be other than English. Source: Department for Education, Explore Education Statistics, Schools, pupils and their characteristics, 2024/25.
Pupils per qualified teacher
2025/2618.1
- England
- 18.5
0.4 lower than England.
Show the figures as a table
| Year | Plymouth | England |
|---|---|---|
| 2017/18 | 18.0 | 18.4 |
| 2018/19 | 18.3 | 18.6 |
| 2019/20 | 18.3 | 18.8 |
| 2020/21 | 17.9 | 18.5 |
| 2021/22 | 17.9 | 18.5 |
| 2022/23 | 17.6 | 18.5 |
| 2023/24 | 18.3 | 18.6 |
| 2024/25 | 18.1 | 18.6 |
| 2025/26 | 18.1 | 18.5 |
Full-time equivalent pupils for each full-time equivalent qualified teacher. Source: Department for Education, Explore Education Statistics, School workforce in England, 2025/26.
Teacher sickness absence
2024/255.2 days
- England
- 5.0 days
0.2 days higher than England.
Show the figures as a table
| Year | Plymouth | England |
|---|---|---|
| 2017/18 | 5.4 days | 4.0 days |
| 2018/19 | 5.8 days | 4.0 days |
| 2019/20 | Not published | Not published |
| 2020/21 | 4.1 days | 3.9 days |
| 2021/22 | 7.8 days | 6.3 days |
| 2022/23 | 5.9 days | 5.2 days |
| 2023/24 | 5.8 days | 5.3 days |
| 2024/25 | 5.2 days | 5.0 days |
Days lost to sickness absence in the school year, averaged across all teachers. Source: Department for Education, Explore Education Statistics, School workforce in England, 2024/25.
Primary schools
Overall absence
2024/255.2%
- England
- 5.2%
The same as England.
Show the figures as a table
| Year | Plymouth | England |
|---|---|---|
| 2017/18 | 4.5% | 4.2% |
| 2018/19 | 4.3% | 4.0% |
| 2020/21 | 3.5% | 3.6% |
| 2021/22 | 7.0% | 6.3% |
| 2022/23 | 6.1% | 5.9% |
| 2023/24 | 5.8% | 5.5% |
| 2024/25 | 5.2% | 5.2% |
Sessions missed for any reason, as a share of all possible sessions in the school year. Source: Department for Education, Explore Education Statistics, Pupil absence in schools in England, 2024/25.
Persistent absence
2024/2512.7%
- England
- 13.0%
0.3 percentage points lower than England.
Show the figures as a table
| Year | Plymouth | England |
|---|---|---|
| 2017/18 | 9.1% | 8.7% |
| 2018/19 | 9.0% | 8.2% |
| 2020/21 | 8.1% | 8.8% |
| 2021/22 | 21.0% | 17.7% |
| 2022/23 | 16.6% | 16.2% |
| 2023/24 | 14.8% | 14.6% |
| 2024/25 | 12.7% | 13.0% |
Pupils who missed 10% or more of their possible sessions, as a share of pupils. Source: Department for Education, Explore Education Statistics, Pupil absence in schools in England, 2024/25.
Severe absence
2024/250.8%
- England
- 0.9%
0.1 percentage points lower than England.
Show the figures as a table
| Year | Plymouth | England |
|---|---|---|
| 2017/18 | 0.2% | 0.4% |
| 2018/19 | 0.2% | 0.4% |
| 2020/21 | 0.5% | 0.7% |
| 2021/22 | 0.5% | 0.6% |
| 2022/23 | 0.7% | 0.7% |
| 2023/24 | 0.9% | 0.9% |
| 2024/25 | 0.8% | 0.9% |
Pupils who missed 50% or more of their possible sessions, as a share of pupils. Source: Department for Education, Explore Education Statistics, Pupil absence in schools in England, 2024/25.
Suspensions per 100 pupils
2024/253.19
- England
- 2.47
0.72 higher than England.
Show the figures as a table
| Year | Plymouth | England |
|---|---|---|
| 2017/18 | 1.05 | 1.40 |
| 2018/19 | 1.45 | 1.41 |
| 2019/20 | 1.46 | 1.00 |
| 2020/21 | 1.28 | 0.99 |
| 2021/22 | 1.43 | 1.42 |
| 2022/23 | 2.00 | 1.81 |
| 2023/24 | 2.83 | 2.27 |
| 2024/25 | 3.19 | 2.47 |
Suspensions in the school year for every 100 pupils on roll. One pupil can be suspended more than once. Source: Department for Education, Explore Education Statistics, Suspensions and permanent exclusions in England, 2024/25.
Permanent exclusions per 100 pupils
2024/250.02
- England
- 0.03
0.01 lower than England.
Show the figures as a table
| Year | Plymouth | England |
|---|---|---|
| 2017/18 | 0.06 | 0.03 |
| 2018/19 | 0.05 | 0.02 |
| 2019/20 | 0.06 | 0.02 |
| 2020/21 | 0.01 | 0.01 |
| 2021/22 | 0.02 | 0.02 |
| 2022/23 | 0.03 | 0.03 |
| 2023/24 | 0.06 | 0.03 |
| 2024/25 | 0.02 | 0.03 |
Permanent exclusions in the school year for every 100 pupils on roll. Source: Department for Education, Explore Education Statistics, Suspensions and permanent exclusions in England, 2024/25.
Reading, writing and maths: expected standard
2025/26 (provisional)64%
- England
- 63%
1 percentage point higher than England.
Show the figures as a table
| Year | Plymouth | England |
|---|---|---|
| 2021/22 | 59% | 59% |
| 2022/23 | 60% | 60% |
| 2023/24 | 63% | 61% |
| 2024/25 | 65% | 63% |
| 2025/26 (provisional) | 64% | 63% |
Pupils at the end of key stage 2 who met the expected standard in reading, writing and maths combined. Source: Department for Education, Explore Education Statistics, Key stage 2 attainment, 2025/26.
Reading, writing and maths: higher standard
2025/26 (provisional)7%
- England
- 9%
2 percentage points lower than England.
Show the figures as a table
| Year | Plymouth | England |
|---|---|---|
| 2021/22 | 6% | 7% |
| 2022/23 | 7% | 8% |
| 2023/24 | 7% | 8% |
| 2024/25 | 8% | 8% |
| 2025/26 (provisional) | 7% | 9% |
Pupils at the end of key stage 2 who met the higher standard in reading, writing and maths combined. Source: Department for Education, Explore Education Statistics, Key stage 2 attainment, 2025/26.
Eligible for free school meals
2024/2525.8%
- England
- 24.7%
1.1 percentage points higher than England.
Show the figures as a table
| Year | Plymouth | England |
|---|---|---|
| 2021/22 | 26.4% | 23.1% |
| 2022/23 | 26.9% | 24.0% |
| 2023/24 | 26.5% | 24.3% |
| 2024/25 | 25.8% | 24.7% |
Pupils known to be eligible for free school meals on census day in January. Source: Department for Education, Explore Education Statistics, Schools, pupils and their characteristics, 2024/25.
SEN support
2024/2516.5%
- England
- 15.0%
1.5 percentage points higher than England.
Show the figures as a table
| Year | Plymouth | England |
|---|---|---|
| 2021/22 | 14.7% | 13.0% |
| 2022/23 | 14.6% | 13.5% |
| 2023/24 | 14.9% | 14.1% |
| 2024/25 | 16.5% | 15.0% |
Pupils receiving special educational needs support without an education, health and care plan. Source: Department for Education, Explore Education Statistics, Schools, pupils and their characteristics, 2024/25.
Education, health and care plan
2024/252.6%
- England
- 3.5%
0.9 percentage points lower than England.
Show the figures as a table
| Year | Plymouth | England |
|---|---|---|
| 2021/22 | 1.6% | 2.3% |
| 2022/23 | 2.1% | 2.5% |
| 2023/24 | 2.5% | 3.0% |
| 2024/25 | 2.6% | 3.5% |
Pupils with an education, health and care plan. Source: Department for Education, Explore Education Statistics, Schools, pupils and their characteristics, 2024/25.
First language other than English
2024/2512.2%
- England
- 23.4%
11.2 percentage points lower than England.
Show the figures as a table
| Year | Plymouth | England |
|---|---|---|
| 2021/22 | 8.5% | 21.2% |
| 2022/23 | 9.5% | 22.0% |
| 2023/24 | 10.6% | 22.8% |
| 2024/25 | 12.2% | 23.4% |
Pupils whose first language is known or believed to be other than English. Source: Department for Education, Explore Education Statistics, Schools, pupils and their characteristics, 2024/25.
Pupils per qualified teacher
2025/2621.0
- England
- 21.2
0.2 lower than England.
Show the figures as a table
| Year | Plymouth | England |
|---|---|---|
| 2017/18 | 21.2 | 21.3 |
| 2018/19 | 21.2 | 21.4 |
| 2019/20 | 21.6 | 21.4 |
| 2020/21 | 21.1 | 21.1 |
| 2021/22 | 21.1 | 21.0 |
| 2022/23 | 20.7 | 21.1 |
| 2023/24 | 21.3 | 21.2 |
| 2024/25 | 21.5 | 21.3 |
| 2025/26 | 21.0 | 21.2 |
Full-time equivalent pupils for each full-time equivalent qualified teacher. Source: Department for Education, Explore Education Statistics, School workforce in England, 2025/26.
Secondary schools
Overall absence
2024/2510.2%
- England
- 8.4%
1.8 percentage points higher than England.
Show the figures as a table
| Year | Plymouth | England |
|---|---|---|
| 2017/18 | 5.9% | 5.5% |
| 2018/19 | 6.0% | 5.5% |
| 2020/21 | 6.3% | 5.5% |
| 2021/22 | 10.8% | 9.0% |
| 2022/23 | 10.6% | 9.0% |
| 2023/24 | 11.1% | 8.9% |
| 2024/25 | 10.2% | 8.4% |
Sessions missed for any reason, as a share of all possible sessions in the school year. Source: Department for Education, Explore Education Statistics, Pupil absence in schools in England, 2024/25.
Persistent absence
2024/2529.1%
- England
- 23.4%
5.7 percentage points higher than England.
Show the figures as a table
| Year | Plymouth | England |
|---|---|---|
| 2017/18 | 15.6% | 13.9% |
| 2018/19 | 15.8% | 13.7% |
| 2020/21 | 17.7% | 14.8% |
| 2021/22 | 35.6% | 27.7% |
| 2022/23 | 32.1% | 26.5% |
| 2023/24 | 32.7% | 25.6% |
| 2024/25 | 29.1% | 23.4% |
Pupils who missed 10% or more of their possible sessions, as a share of pupils. Source: Department for Education, Explore Education Statistics, Pupil absence in schools in England, 2024/25.
Severe absence
2024/255.9%
- England
- 3.9%
2.0 percentage points higher than England.
Show the figures as a table
| Year | Plymouth | England |
|---|---|---|
| 2017/18 | 0.9% | 1.2% |
| 2018/19 | 1.1% | 1.3% |
| 2020/21 | 1.6% | 1.5% |
| 2021/22 | 3.8% | 2.7% |
| 2022/23 | 4.5% | 3.4% |
| 2023/24 | 5.7% | 3.8% |
| 2024/25 | 5.9% | 3.9% |
Pupils who missed 50% or more of their possible sessions, as a share of pupils. Source: Department for Education, Explore Education Statistics, Pupil absence in schools in England, 2024/25.
Suspensions per 100 pupils
2024/2528.83
- England
- 21.24
7.59 higher than England.
Show the figures as a table
| Year | Plymouth | England |
|---|---|---|
| 2017/18 | 14.24 | 10.13 |
| 2018/19 | 16.14 | 10.75 |
| 2019/20 | 7.49 | 7.43 |
| 2020/21 | 13.10 | 8.48 |
| 2021/22 | 19.95 | 13.96 |
| 2022/23 | 26.45 | 18.90 |
| 2023/24 | 32.98 | 22.61 |
| 2024/25 | 28.83 | 21.24 |
Suspensions in the school year for every 100 pupils on roll. One pupil can be suspended more than once. Source: Department for Education, Explore Education Statistics, Suspensions and permanent exclusions in England, 2024/25.
Permanent exclusions per 100 pupils
2024/250.27
- England
- 0.23
0.04 higher than England.
Show the figures as a table
| Year | Plymouth | England |
|---|---|---|
| 2017/18 | 0.16 | 0.20 |
| 2018/19 | 0.25 | 0.20 |
| 2019/20 | 0.18 | 0.13 |
| 2020/21 | 0.20 | 0.10 |
| 2021/22 | 0.23 | 0.16 |
| 2022/23 | 0.26 | 0.22 |
| 2023/24 | 0.39 | 0.25 |
| 2024/25 | 0.27 | 0.23 |
Permanent exclusions in the school year for every 100 pupils on roll. Source: Department for Education, Explore Education Statistics, Suspensions and permanent exclusions in England, 2024/25.
Attainment 8
2025/26 (provisional)47.9
- England
- 47.4
0.5 higher than England.
Show the figures as a table
| Year | Plymouth | England |
|---|---|---|
| 2021/22 | 48.6 | 49.8 |
| 2022/23 | 46.1 | 47.2 |
| 2023/24 | 47.3 | 46.9 |
| 2024/25 | 47.0 | 47.1 |
| 2025/26 (provisional) | 47.9 | 47.4 |
The average of pupils' points across eight GCSE-level qualifications, with English and maths counted twice. Source: Department for Education, Explore Education Statistics, Key stage 4 performance, 2025/26.
English and maths: grade 4 or above
2025/26 (provisional)69%
- England
- 66%
3 percentage points higher than England.
Show the figures as a table
| Year | Plymouth | England |
|---|---|---|
| 2021/22 | 68% | 70% |
| 2022/23 | 63% | 67% |
| 2023/24 | 67% | 67% |
| 2024/25 | 68% | 66% |
| 2025/26 (provisional) | 69% | 66% |
Pupils at the end of key stage 4 with grade 4 or above in both English and maths. Source: Department for Education, Explore Education Statistics, Key stage 4 performance, 2025/26.
English and maths: grade 5 or above
2025/26 (provisional)51%
- England
- 48%
3 percentage points higher than England.
Show the figures as a table
| Year | Plymouth | England |
|---|---|---|
| 2021/22 | 47% | 51% |
| 2022/23 | 43% | 46% |
| 2023/24 | 48% | 47% |
| 2024/25 | 48% | 47% |
| 2025/26 (provisional) | 51% | 48% |
Pupils at the end of key stage 4 with grade 5 or above in both English and maths. Source: Department for Education, Explore Education Statistics, Key stage 4 performance, 2025/26.
Eligible for free school meals
2024/2526.1%
- England
- 25.8%
0.3 percentage points higher than England.
Show the figures as a table
| Year | Plymouth | England |
|---|---|---|
| 2021/22 | 21.9% | 20.9% |
| 2022/23 | 23.7% | 22.7% |
| 2023/24 | 25.0% | 24.1% |
| 2024/25 | 26.1% | 25.8% |
Pupils known to be eligible for free school meals on census day in January. Source: Department for Education, Explore Education Statistics, Schools, pupils and their characteristics, 2024/25.
SEN support
2024/2514.6%
- England
- 13.4%
1.2 percentage points higher than England.
Show the figures as a table
| Year | Plymouth | England |
|---|---|---|
| 2021/22 | 13.2% | 11.9% |
| 2022/23 | 14.0% | 12.4% |
| 2023/24 | 14.7% | 12.9% |
| 2024/25 | 14.6% | 13.4% |
Pupils receiving special educational needs support without an education, health and care plan. Source: Department for Education, Explore Education Statistics, Schools, pupils and their characteristics, 2024/25.
Education, health and care plan
2024/252.9%
- England
- 3.1%
0.2 percentage points lower than England.
Show the figures as a table
| Year | Plymouth | England |
|---|---|---|
| 2021/22 | 2.4% | 2.2% |
| 2022/23 | 2.4% | 2.4% |
| 2023/24 | 2.8% | 2.7% |
| 2024/25 | 2.9% | 3.1% |
Pupils with an education, health and care plan. Source: Department for Education, Explore Education Statistics, Schools, pupils and their characteristics, 2024/25.
First language other than English
2024/259.2%
- England
- 19.2%
10.0 percentage points lower than England.
Show the figures as a table
| Year | Plymouth | England |
|---|---|---|
| 2021/22 | 7.5% | 17.5% |
| 2022/23 | 8.1% | 18.1% |
| 2023/24 | 8.3% | 18.6% |
| 2024/25 | 9.2% | 19.2% |
Pupils whose first language is known or believed to be other than English. Source: Department for Education, Explore Education Statistics, Schools, pupils and their characteristics, 2024/25.
Pupils per qualified teacher
2025/2617.3
- England
- 17.3
The same as England.
Show the figures as a table
| Year | Plymouth | England |
|---|---|---|
| 2017/18 | 16.5 | 16.5 |
| 2018/19 | 17.0 | 16.8 |
| 2019/20 | 16.6 | 17.2 |
| 2020/21 | 16.6 | 17.1 |
| 2021/22 | 16.6 | 17.1 |
| 2022/23 | 16.4 | 17.2 |
| 2023/24 | 17.4 | 17.4 |
| 2024/25 | 16.9 | 17.3 |
| 2025/26 | 17.3 | 17.3 |
Full-time equivalent pupils for each full-time equivalent qualified teacher. Source: Department for Education, Explore Education Statistics, School workforce in England, 2025/26.
Special schools
Overall absence
2024/2512.1%
- England
- 12.8%
0.7 percentage points lower than England.
Show the figures as a table
| Year | Plymouth | England |
|---|---|---|
| 2017/18 | 8.5% | 10.2% |
| 2018/19 | 8.9% | 10.1% |
| 2020/21 | 11.9% | 15.2% |
| 2021/22 | 13.5% | 13.2% |
| 2022/23 | 12.3% | 13.0% |
| 2023/24 | 12.1% | 13.0% |
| 2024/25 | 12.1% | 12.8% |
Sessions missed for any reason, as a share of all possible sessions in the school year. Source: Department for Education, Explore Education Statistics, Pupil absence in schools in England, 2024/25.
Persistent absence
2024/2532.3%
- England
- 35.3%
3.0 percentage points lower than England.
Show the figures as a table
| Year | Plymouth | England |
|---|---|---|
| 2017/18 | 25.9% | 29.6% |
| 2018/19 | 23.9% | 28.8% |
| 2020/21 | 36.2% | 48.9% |
| 2021/22 | 46.3% | 40.4% |
| 2022/23 | 39.7% | 38.3% |
| 2023/24 | 38.8% | 37.2% |
| 2024/25 | 32.3% | 35.3% |
Pupils who missed 10% or more of their possible sessions, as a share of pupils. Source: Department for Education, Explore Education Statistics, Pupil absence in schools in England, 2024/25.
Severe absence
2024/255.9%
- England
- 6.9%
1.0 percentage point lower than England.
Show the figures as a table
| Year | Plymouth | England |
|---|---|---|
| 2017/18 | 1.0% | 4.4% |
| 2018/19 | 2.4% | 4.6% |
| 2020/21 | 4.7% | 5.6% |
| 2021/22 | 3.5% | 5.8% |
| 2022/23 | 6.6% | 6.2% |
| 2023/24 | 4.7% | 6.7% |
| 2024/25 | 5.9% | 6.9% |
Pupils who missed 50% or more of their possible sessions, as a share of pupils. Source: Department for Education, Explore Education Statistics, Pupil absence in schools in England, 2024/25.
Suspensions per 100 pupils
2024/2540.94
- England
- 12.32
28.62 higher than England.
Show the figures as a table
| Year | Plymouth | England |
|---|---|---|
| 2017/18 | 20.65 | 12.34 |
| 2018/19 | 11.81 | 11.32 |
| 2019/20 | 10.79 | 7.76 |
| 2020/21 | 14.45 | 7.29 |
| 2021/22 | 22.51 | 9.60 |
| 2022/23 | 14.79 | 10.99 |
| 2023/24 | 38.87 | 12.62 |
| 2024/25 | 40.94 | 12.32 |
Suspensions in the school year for every 100 pupils on roll. One pupil can be suspended more than once. Source: Department for Education, Explore Education Statistics, Suspensions and permanent exclusions in England, 2024/25.
Permanent exclusions per 100 pupils
2024/250.00
- England
- 0.08
0.08 lower than England.
Show the figures as a table
| Year | Plymouth | England |
|---|---|---|
| 2017/18 | 0.16 | 0.07 |
| 2018/19 | 0.00 | 0.06 |
| 2019/20 | 0.15 | 0.04 |
| 2020/21 | 0.00 | 0.03 |
| 2021/22 | 0.14 | 0.05 |
| 2022/23 | 0.14 | 0.08 |
| 2023/24 | 0.14 | 0.08 |
| 2024/25 | 0.00 | 0.08 |
Permanent exclusions in the school year for every 100 pupils on roll. Source: Department for Education, Explore Education Statistics, Suspensions and permanent exclusions in England, 2024/25.
Eligible for free school meals
2024/2551.8%
- England
- 48.8%
3.0 percentage points higher than England.
Show the figures as a table
| Year | Plymouth | England |
|---|---|---|
| 2021/22 | 45.9% | 44.4% |
| 2022/23 | 48.8% | 45.6% |
| 2023/24 | 52.1% | 47.1% |
| 2024/25 | 51.8% | 48.8% |
Pupils known to be eligible for free school meals on census day in January. Source: Department for Education, Explore Education Statistics, Schools, pupils and their characteristics, 2024/25.
SEN support
2024/250.0%
- England
- 0.5%
0.5 percentage points lower than England.
Show the figures as a table
| Year | Plymouth | England |
|---|---|---|
| 2021/22 | 0.0% | 0.9% |
| 2022/23 | 0.0% | 0.8% |
| 2023/24 | 0.0% | 0.7% |
| 2024/25 | 0.0% | 0.5% |
Pupils receiving special educational needs support without an education, health and care plan. Source: Department for Education, Explore Education Statistics, Schools, pupils and their characteristics, 2024/25.
Education, health and care plan
2024/25100.0%
- England
- 99.5%
0.5 percentage points higher than England.
Show the figures as a table
| Year | Plymouth | England |
|---|---|---|
| 2021/22 | 100.0% | 99.1% |
| 2022/23 | 100.0% | 99.2% |
| 2023/24 | 100.0% | 99.3% |
| 2024/25 | 100.0% | 99.5% |
Pupils with an education, health and care plan. Source: Department for Education, Explore Education Statistics, Schools, pupils and their characteristics, 2024/25.
First language other than English
2024/256.3%
- England
- 14.4%
8.1 percentage points lower than England.
Show the figures as a table
| Year | Plymouth | England |
|---|---|---|
| 2021/22 | 5.4% | 14.5% |
| 2022/23 | 6.0% | 14.4% |
| 2023/24 | 5.8% | 14.4% |
| 2024/25 | 6.3% | 14.4% |
Pupils whose first language is known or believed to be other than English. Source: Department for Education, Explore Education Statistics, Schools, pupils and their characteristics, 2024/25.
Pupils per qualified teacher
2025/266.6
- England
- 7.3
0.7 lower than England.
Show the figures as a table
| Year | Plymouth | England |
|---|---|---|
| 2017/18 | 6.5 | 6.7 |
| 2018/19 | 6.6 | 6.8 |
| 2019/20 | 6.9 | 7.0 |
| 2020/21 | 6.1 | 6.8 |
| 2021/22 | 6.3 | 6.9 |
| 2022/23 | 6.1 | 7.0 |
| 2023/24 | 6.3 | 7.1 |
| 2024/25 | 6.6 | 7.3 |
| 2025/26 | 6.6 | 7.3 |
Full-time equivalent pupils for each full-time equivalent qualified teacher. Source: Department for Education, Explore Education Statistics, School workforce in England, 2025/26.
Schools in Plymouth
Listed by name. Filter by phase or type; sort by name or size. Nothing here is sorted by results.
Showing 98 of 98 schools in Plymouth.
| School | Phase | Type | Town | Pupils |
|---|---|---|---|---|
| ACE Schools Plymouth | Alternative provision | Academy | Plymouth | 236 |
| All Saints Church of England Academy | Secondary | Academy | Plymouth | 668 |
| Austin Farm Academy | Primary | Academy | Plymouth | 108 |
| Beechwood Primary Academy | Primary | Academy | Plymouth | 249 |
| Boringdon Primary School | Primary | Academy | Plymouth | 386 |
| Brook Green Centre for Learning | Special | Maintained special | Plymouth | 111 |
| Cann Bridge School | Special | Maintained special | Plymouth | 111 |
| Chaddlewood Primary School | Primary | Academy | Plymouth | 383 |
| College Road Primary School | Primary | Maintained | Plymouth | 204 |
| Compton CofE Primary School | Primary | Maintained | Plymouth | 429 |
| Coombe Dean School | Secondary | Academy | Plymouth | 1,000 |
| Courtlands School | Special | Academy | Plymouth | 101 |
| Devonport High School for Boys | Secondary | Academy | Plymouth | 1,300 |
| Devonport High School for Girls | Secondary | Academy | Plymouth | 971 |
| Drake Primary Academy | Primary | Academy | Plymouth | 136 |
| Eggbuckland Community College | Secondary | Academy | Plymouth | 1,007 |
| Eggbuckland Vale Primary School | Primary | Academy | Plymouth | 404 |
| Elburton Primary School | Primary | Academy | Plymouth | 470 |
| Ernesettle Community School | Primary | Academy | Plymouth | 587 |
| Ford Primary School | Primary | Academy | Plymouth | 171 |
| Glen Park Primary School | Primary | Academy | Plymouth | 461 |
| Goosewell Primary Academy | Primary | Academy | Plymouth | 394 |
| Ham Drive Nursery School and Day Care | Nursery | Maintained | Plymouth | 89 |
| Hele's School | Secondary | Academy | Plymouth | 1,378 |
| High Street Primary Academy | Primary | Academy | Plymouth | 214 |
| High View School | Primary | Academy | Plymouth | 338 |
| Holy Cross Catholic Primary School | Primary | Academy | Plymouth | 276 |
| Hooe Primary Academy | Primary | Academy | Plymouth | 212 |
| Hyde Park Infants' School | Primary | Academy | Plymouth | 194 |
| Hyde Park Junior School | Primary | Academy | Plymouth | 336 |
| Keyham Barton Catholic Primary School | Primary | Academy | Plymouth | 145 |
| Knowle Primary School | Primary | Academy | Plymouth | 275 |
| Laira Green Primary School | Primary | Maintained | Plymouth | 220 |
| Leigham Primary School | Primary | Academy | Plymouth | 374 |
| Lipson Co-operative Academy | Secondary | Academy | Plymouth | 1,131 |
| Lipson Vale Primary School | Primary | Maintained | Plymouth | 393 |
| Longcause Community Special School | Special | Maintained special | Plymouth | 118 |
| Manadon Vale Primary School | Primary | Academy | Plymouth | 412 |
| Marine Academy Plymouth | Secondary | Academy | Plymouth | 989 |
| Marine Academy Primary | Primary | Free school | Plymouth | 506 |
| Marlborough Primary Academy | Primary | Academy | Plymouth | 103 |
| Mary Dean's CofE Primary School and Nursery | Primary | Academy | Plymouth | 281 |
| Mayflower Academy | Primary | Academy | Plymouth | 441 |
| Mill Ford School | Special | Maintained special | Plymouth | 149 |
| Millbay Academy | Secondary | Free school | Plymouth | 526 |
| Montpelier Primary School | Primary | Academy | Plymouth | 624 |
| Morice Town Primary Academy | Primary | Academy | Plymouth | 177 |
| Morley Meadow Primary School | Primary | Academy | Plymouth | 216 |
| Mount Street Primary School | Primary | Academy | Plymouth | 253 |
| Mount Tamar School | Special | Academy | Plymouth | Not published |
| Mount Wise Community Primary School | Primary | Academy | Plymouth | 248 |
| Notre Dame RC School | Secondary | Academy | Plymouth | 764 |
| Oakwood Primary Academy | Primary | Academy | Plymouth | 235 |
| Oreston Community Academy | Primary | Academy | Plymouth | 331 |
| Pennycross Primary School | Primary | Maintained | Plymouth | 402 |
| Pilgrim Primary Academy | Primary | Academy | Plymouth | 361 |
| Plaistow Hill Primary and Nursery School | Primary | Academy | Plymouth | 165 |
| Plym Bridge Nursery School and Day Care | Nursery | Maintained | Plymouth | 53 |
| Plymouth High School for Girls | Secondary | Academy | Plymouth | 782 |
| Plympton Academy | Secondary | Academy | Plymouth | 984 |
| Plympton St Maurice Primary School | Primary | Academy | Plymouth | 179 |
| Plymstock School | Secondary | Academy | Plymouth | 1,515 |
| Pomphlett Primary School | Primary | Academy | Plymouth | 404 |
| Prince Rock Primary School | Primary | Academy | Plymouth | 405 |
| Riverside Community Primary School | Primary | Maintained | Plymouth | 370 |
| Salisbury Road Primary School | Primary | Academy | Plymouth | 395 |
| Scott Medical and Healthcare College | Secondary | Free school | Plymouth | 231 |
| Shakespeare Primary School | Primary | Academy | Plymouth | 381 |
| Sir John Hunt Community Sports College | Secondary | Academy | Plymouth | Not published |
| St Andrew's Cof E VA Primary School | Primary | Maintained | Plymouth | 190 |
| St Boniface's RC College | Secondary | Academy | Plymouth | 389 |
| St Budeaux CofE Primary Academy | Primary | Academy | Plymouth | 55 |
| St Edward's CofE Primary School | Primary | Academy | Plymouth | 210 |
| St George's CofE Primary Academy | Primary | Academy | Plymouth | 94 |
| St Joseph's Catholic Primary School | Primary | Academy | Plymouth | 201 |
| St Mary's Priory CofE Infant & Nursery School | Primary | Academy | Plymouth | 85 |
| St Mary's Priory Junior School | Primary | Academy | Plymouth | 149 |
| St Matthew's Church of England Primary and Nursery Academy | Primary | Academy | Plymouth | 487 |
| St Paul's Roman Catholic Primary School | Primary | Academy | Plymouth | 136 |
| St Peter's CofE Primary School | Primary | Academy | Plymouth | 192 |
| St Peter's RC Primary School | Primary | Academy | Plymouth | 75 |
| Stoke Damerel Community College | Secondary | Academy | Plymouth | 1,292 |
| Stoke Damerel Primary Academy | Primary | Academy | Plymouth | 387 |
| Stuart Road Primary Academy | Primary | Academy | Plymouth | 185 |
| The Cathedral School of St Mary | Primary | Academy | Plymouth | 102 |
| Thornbury Primary School | Primary | Academy | Plymouth | 279 |
| Tor Bridge High | Secondary | Academy | Plymouth | 1,121 |
| Tor Bridge Primary School | Primary | Academy | Plymouth | 211 |
| UTC Plymouth | Secondary | Free school | Plymouth | 594 |
| Victoria Road Primary | Primary | Academy | Plymouth | 172 |
| Weston Mill Community Primary Academy | Primary | Academy | Plymouth | 184 |
| Whitleigh Community Primary School | Primary | Academy | Plymouth | Not published |
| Widewell Primary Academy | Primary | Academy | Plymouth | 228 |
| Widey Court Primary School | Primary | Academy | Plymouth | 615 |
| Woodfield Primary School | Primary | Academy | Plymouth | 222 |
| Woodford Primary School | Primary | Academy | Plymouth | 398 |
| Woodlands School | Special | Maintained special | Plymouth | 97 |
| Yealmpstone Farm Primary School | Primary | Maintained | Plymouth | 227 |