Nottingham
105 state-funded schools with 48,492 pupils on roll, in the East Midlands region. Every school’s page has its published figures against Nottingham and England.
- Primary
- 74
- Secondary
- 18
- All-through
- 1
- Special
- 5
- Alternative provision
- 5
- Nursery
- 1
- 16 to 19
- 1
- Academies
- 71
- Maintained
- 27
- Free schools
- 5
- Maintained special
- 2
Map
Zoom in to see each school. Open the full map
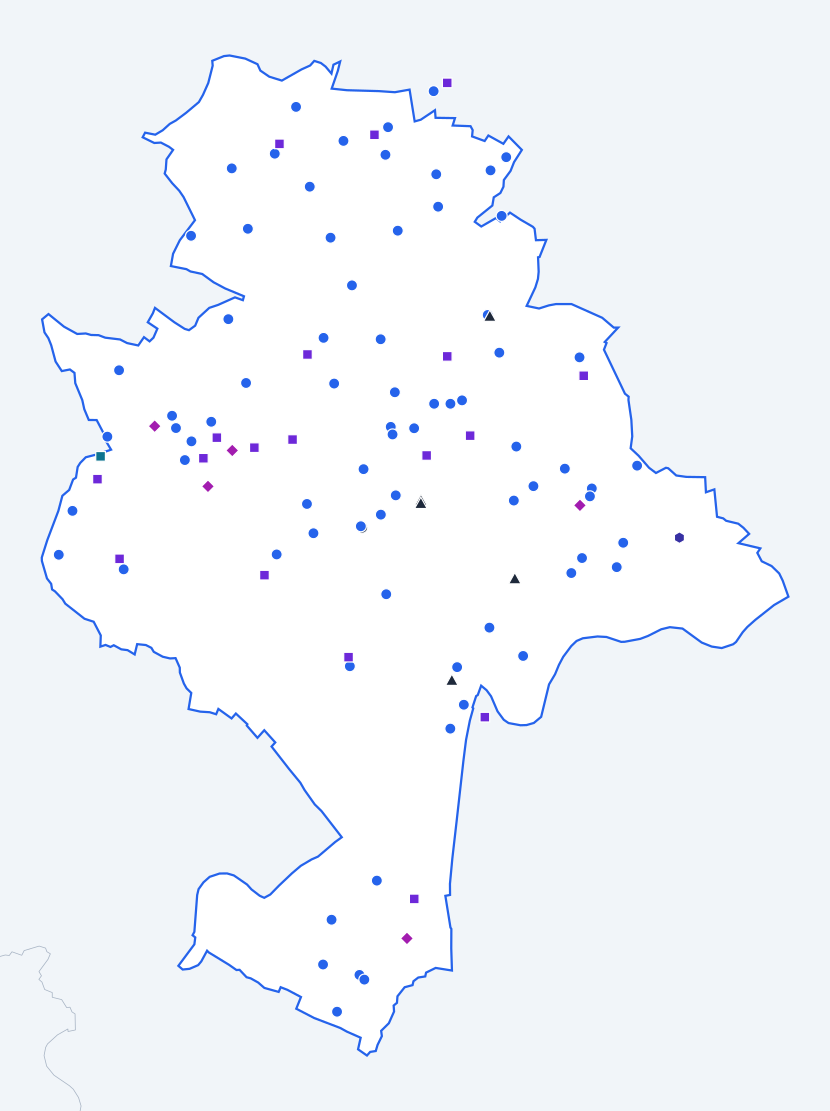
ONS, OS © Crown copyright 2025 · GIAS · © OpenStreetMap
Nottingham against England
Published figures for the authority’s schools, set against the same kind of school across England.
All state-funded schools
Overall absence
2024/257.3%
- England
- 6.8%
0.5 percentage points higher than England.
Show the figures as a table
| Year | Nottingham | England |
|---|---|---|
| 2017/18 | 4.9% | 4.8% |
| 2018/19 | 4.8% | 4.7% |
| 2020/21 | 5.4% | 4.6% |
| 2021/22 | 7.6% | 7.6% |
| 2022/23 | 8.0% | 7.4% |
| 2023/24 | 7.6% | 7.1% |
| 2024/25 | 7.3% | 6.8% |
Sessions missed for any reason, as a share of all possible sessions in the school year. Source: Department for Education, Explore Education Statistics, Pupil absence in schools in England, 2024/25.
Persistent absence
2024/2520.6%
- England
- 18.1%
2.5 percentage points higher than England.
Show the figures as a table
| Year | Nottingham | England |
|---|---|---|
| 2017/18 | 12.5% | 11.2% |
| 2018/19 | 12.0% | 10.9% |
| 2020/21 | 15.0% | 12.1% |
| 2021/22 | 23.7% | 22.5% |
| 2022/23 | 24.3% | 21.2% |
| 2023/24 | 22.2% | 20.0% |
| 2024/25 | 20.6% | 18.1% |
Pupils who missed 10% or more of their possible sessions, as a share of pupils. Source: Department for Education, Explore Education Statistics, Pupil absence in schools in England, 2024/25.
Severe absence
2024/252.8%
- England
- 2.4%
0.4 percentage points higher than England.
Show the figures as a table
| Year | Nottingham | England |
|---|---|---|
| 2017/18 | 0.7% | 0.8% |
| 2018/19 | 0.6% | 0.8% |
| 2020/21 | 1.4% | 1.1% |
| 2021/22 | 1.7% | 1.7% |
| 2022/23 | 2.0% | 2.0% |
| 2023/24 | 2.5% | 2.3% |
| 2024/25 | 2.8% | 2.4% |
Pupils who missed 50% or more of their possible sessions, as a share of pupils. Source: Department for Education, Explore Education Statistics, Pupil absence in schools in England, 2024/25.
Suspensions per 100 pupils
2024/2514.13
- England
- 10.88
3.25 higher than England.
Show the figures as a table
| Year | Nottingham | England |
|---|---|---|
| 2017/18 | 6.20 | 5.08 |
| 2018/19 | 8.07 | 5.36 |
| 2019/20 | 6.39 | 3.76 |
| 2020/21 | 11.33 | 4.25 |
| 2021/22 | 16.08 | 6.91 |
| 2022/23 | 17.20 | 9.33 |
| 2023/24 | 19.57 | 11.31 |
| 2024/25 | 14.13 | 10.88 |
Suspensions in the school year for every 100 pupils on roll. One pupil can be suspended more than once. Source: Department for Education, Explore Education Statistics, Suspensions and permanent exclusions in England, 2024/25.
Permanent exclusions per 100 pupils
2024/250.28
- England
- 0.12
0.16 higher than England.
Show the figures as a table
| Year | Nottingham | England |
|---|---|---|
| 2017/18 | 0.13 | 0.10 |
| 2018/19 | 0.15 | 0.10 |
| 2019/20 | 0.13 | 0.06 |
| 2020/21 | 0.15 | 0.05 |
| 2021/22 | 0.18 | 0.08 |
| 2022/23 | 0.20 | 0.11 |
| 2023/24 | 0.31 | 0.13 |
| 2024/25 | 0.28 | 0.12 |
Permanent exclusions in the school year for every 100 pupils on roll. Source: Department for Education, Explore Education Statistics, Suspensions and permanent exclusions in England, 2024/25.
Eligible for free school meals
2024/2538.0%
- England
- 25.7%
12.3 percentage points higher than England.
Show the figures as a table
| Year | Nottingham | England |
|---|---|---|
| 2021/22 | 35.1% | 22.5% |
| 2022/23 | 36.7% | 23.8% |
| 2023/24 | 36.9% | 24.6% |
| 2024/25 | 38.0% | 25.7% |
Pupils known to be eligible for free school meals on census day in January. Source: Department for Education, Explore Education Statistics, Schools, pupils and their characteristics, 2024/25.
SEN support
2024/2514.7%
- England
- 14.0%
0.7 percentage points higher than England.
Show the figures as a table
| Year | Nottingham | England |
|---|---|---|
| 2021/22 | 13.3% | 12.4% |
| 2022/23 | 13.8% | 12.9% |
| 2023/24 | 14.1% | 13.4% |
| 2024/25 | 14.7% | 14.0% |
Pupils receiving special educational needs support without an education, health and care plan. Source: Department for Education, Explore Education Statistics, Schools, pupils and their characteristics, 2024/25.
Education, health and care plan
2024/252.8%
- England
- 5.2%
2.4 percentage points lower than England.
Show the figures as a table
| Year | Nottingham | England |
|---|---|---|
| 2021/22 | 2.1% | 3.8% |
| 2022/23 | 2.2% | 4.2% |
| 2023/24 | 2.5% | 4.7% |
| 2024/25 | 2.8% | 5.2% |
Pupils with an education, health and care plan. Source: Department for Education, Explore Education Statistics, Schools, pupils and their characteristics, 2024/25.
First language other than English
2024/2537.3%
- England
- 21.4%
15.9 percentage points higher than England.
Show the figures as a table
| Year | Nottingham | England |
|---|---|---|
| 2021/22 | 31.7% | 19.6% |
| 2022/23 | 32.9% | 20.2% |
| 2023/24 | 35.0% | 20.8% |
| 2024/25 | 37.3% | 21.4% |
Pupils whose first language is known or believed to be other than English. Source: Department for Education, Explore Education Statistics, Schools, pupils and their characteristics, 2024/25.
Pupils per qualified teacher
2025/2618.3
- England
- 18.5
0.2 lower than England.
Show the figures as a table
| Year | Nottingham | England |
|---|---|---|
| 2017/18 | 16.8 | 18.4 |
| 2018/19 | 17.8 | 18.6 |
| 2019/20 | 17.9 | 18.8 |
| 2020/21 | 18.4 | 18.5 |
| 2021/22 | 18.3 | 18.5 |
| 2022/23 | 18.4 | 18.5 |
| 2023/24 | 19.2 | 18.6 |
| 2024/25 | 18.7 | 18.6 |
| 2025/26 | 18.3 | 18.5 |
Full-time equivalent pupils for each full-time equivalent qualified teacher. Source: Department for Education, Explore Education Statistics, School workforce in England, 2025/26.
Teacher sickness absence
2024/255.4 days
- England
- 5.0 days
0.4 days higher than England.
Show the figures as a table
| Year | Nottingham | England |
|---|---|---|
| 2017/18 | 5.0 days | 4.0 days |
| 2018/19 | 3.7 days | 4.0 days |
| 2019/20 | Not published | Not published |
| 2020/21 | 4.2 days | 3.9 days |
| 2021/22 | 6.3 days | 6.3 days |
| 2022/23 | 5.0 days | 5.2 days |
| 2023/24 | 5.3 days | 5.3 days |
| 2024/25 | 5.4 days | 5.0 days |
Days lost to sickness absence in the school year, averaged across all teachers. Source: Department for Education, Explore Education Statistics, School workforce in England, 2024/25.
Primary schools
Overall absence
2024/255.8%
- England
- 5.2%
0.6 percentage points higher than England.
Show the figures as a table
| Year | Nottingham | England |
|---|---|---|
| 2017/18 | 4.4% | 4.2% |
| 2018/19 | 4.3% | 4.0% |
| 2020/21 | 4.5% | 3.6% |
| 2021/22 | 6.5% | 6.3% |
| 2022/23 | 6.5% | 5.9% |
| 2023/24 | 5.9% | 5.5% |
| 2024/25 | 5.8% | 5.2% |
Sessions missed for any reason, as a share of all possible sessions in the school year. Source: Department for Education, Explore Education Statistics, Pupil absence in schools in England, 2024/25.
Persistent absence
2024/2516.3%
- England
- 13.0%
3.3 percentage points higher than England.
Show the figures as a table
| Year | Nottingham | England |
|---|---|---|
| 2017/18 | 10.5% | 8.7% |
| 2018/19 | 10.2% | 8.2% |
| 2020/21 | 12.0% | 8.8% |
| 2021/22 | 20.4% | 17.7% |
| 2022/23 | 19.9% | 16.2% |
| 2023/24 | 17.6% | 14.6% |
| 2024/25 | 16.3% | 13.0% |
Pupils who missed 10% or more of their possible sessions, as a share of pupils. Source: Department for Education, Explore Education Statistics, Pupil absence in schools in England, 2024/25.
Severe absence
2024/251.2%
- England
- 0.9%
0.3 percentage points higher than England.
Show the figures as a table
| Year | Nottingham | England |
|---|---|---|
| 2017/18 | 0.5% | 0.4% |
| 2018/19 | 0.3% | 0.4% |
| 2020/21 | 0.7% | 0.7% |
| 2021/22 | 0.7% | 0.6% |
| 2022/23 | 0.7% | 0.7% |
| 2023/24 | 0.9% | 0.9% |
| 2024/25 | 1.2% | 0.9% |
Pupils who missed 50% or more of their possible sessions, as a share of pupils. Source: Department for Education, Explore Education Statistics, Pupil absence in schools in England, 2024/25.
Suspensions per 100 pupils
2024/252.95
- England
- 2.47
0.48 higher than England.
Show the figures as a table
| Year | Nottingham | England |
|---|---|---|
| 2017/18 | 1.47 | 1.40 |
| 2018/19 | 1.47 | 1.41 |
| 2019/20 | 1.23 | 1.00 |
| 2020/21 | 1.21 | 0.99 |
| 2021/22 | 1.65 | 1.42 |
| 2022/23 | 1.78 | 1.81 |
| 2023/24 | 2.36 | 2.27 |
| 2024/25 | 2.95 | 2.47 |
Suspensions in the school year for every 100 pupils on roll. One pupil can be suspended more than once. Source: Department for Education, Explore Education Statistics, Suspensions and permanent exclusions in England, 2024/25.
Permanent exclusions per 100 pupils
2024/250.05
- England
- 0.03
0.02 higher than England.
Show the figures as a table
| Year | Nottingham | England |
|---|---|---|
| 2017/18 | 0.05 | 0.03 |
| 2018/19 | 0.04 | 0.02 |
| 2019/20 | 0.01 | 0.02 |
| 2020/21 | 0.02 | 0.01 |
| 2021/22 | 0.04 | 0.02 |
| 2022/23 | 0.05 | 0.03 |
| 2023/24 | 0.06 | 0.03 |
| 2024/25 | 0.05 | 0.03 |
Permanent exclusions in the school year for every 100 pupils on roll. Source: Department for Education, Explore Education Statistics, Suspensions and permanent exclusions in England, 2024/25.
Reading, writing and maths: expected standard
2025/26 (provisional)61%
- England
- 63%
2 percentage points lower than England.
Show the figures as a table
| Year | Nottingham | England |
|---|---|---|
| 2021/22 | 56% | 59% |
| 2022/23 | 58% | 60% |
| 2023/24 | 59% | 61% |
| 2024/25 | 61% | 63% |
| 2025/26 (provisional) | 61% | 63% |
Pupils at the end of key stage 2 who met the expected standard in reading, writing and maths combined. Source: Department for Education, Explore Education Statistics, Key stage 2 attainment, 2025/26.
Reading, writing and maths: higher standard
2025/26 (provisional)7%
- England
- 9%
2 percentage points lower than England.
Show the figures as a table
| Year | Nottingham | England |
|---|---|---|
| 2021/22 | 7% | 7% |
| 2022/23 | 7% | 8% |
| 2023/24 | 7% | 8% |
| 2024/25 | 6% | 8% |
| 2025/26 (provisional) | 7% | 9% |
Pupils at the end of key stage 2 who met the higher standard in reading, writing and maths combined. Source: Department for Education, Explore Education Statistics, Key stage 2 attainment, 2025/26.
Eligible for free school meals
2024/2535.4%
- England
- 24.7%
10.7 percentage points higher than England.
Show the figures as a table
| Year | Nottingham | England |
|---|---|---|
| 2021/22 | 34.7% | 23.1% |
| 2022/23 | 35.9% | 24.0% |
| 2023/24 | 35.4% | 24.3% |
| 2024/25 | 35.4% | 24.7% |
Pupils known to be eligible for free school meals on census day in January. Source: Department for Education, Explore Education Statistics, Schools, pupils and their characteristics, 2024/25.
SEN support
2024/2515.0%
- England
- 15.0%
The same as England.
Show the figures as a table
| Year | Nottingham | England |
|---|---|---|
| 2021/22 | 13.7% | 13.0% |
| 2022/23 | 14.1% | 13.5% |
| 2023/24 | 14.2% | 14.1% |
| 2024/25 | 15.0% | 15.0% |
Pupils receiving special educational needs support without an education, health and care plan. Source: Department for Education, Explore Education Statistics, Schools, pupils and their characteristics, 2024/25.
Education, health and care plan
2024/251.6%
- England
- 3.5%
1.9 percentage points lower than England.
Show the figures as a table
| Year | Nottingham | England |
|---|---|---|
| 2021/22 | 0.7% | 2.3% |
| 2022/23 | 0.9% | 2.5% |
| 2023/24 | 1.2% | 3.0% |
| 2024/25 | 1.6% | 3.5% |
Pupils with an education, health and care plan. Source: Department for Education, Explore Education Statistics, Schools, pupils and their characteristics, 2024/25.
First language other than English
2024/2539.8%
- England
- 23.4%
16.4 percentage points higher than England.
Show the figures as a table
| Year | Nottingham | England |
|---|---|---|
| 2021/22 | 32.9% | 21.2% |
| 2022/23 | 34.0% | 22.0% |
| 2023/24 | 36.5% | 22.8% |
| 2024/25 | 39.8% | 23.4% |
Pupils whose first language is known or believed to be other than English. Source: Department for Education, Explore Education Statistics, Schools, pupils and their characteristics, 2024/25.
Pupils per qualified teacher
2025/2620.4
- England
- 21.2
0.8 lower than England.
Show the figures as a table
| Year | Nottingham | England |
|---|---|---|
| 2017/18 | 20.3 | 21.3 |
| 2018/19 | 20.2 | 21.4 |
| 2019/20 | 20.1 | 21.4 |
| 2020/21 | 20.1 | 21.1 |
| 2021/22 | 20.2 | 21.0 |
| 2022/23 | 20.9 | 21.1 |
| 2023/24 | 20.9 | 21.2 |
| 2024/25 | 20.6 | 21.3 |
| 2025/26 | 20.4 | 21.2 |
Full-time equivalent pupils for each full-time equivalent qualified teacher. Source: Department for Education, Explore Education Statistics, School workforce in England, 2025/26.
Secondary schools
Overall absence
2024/258.9%
- England
- 8.4%
0.5 percentage points higher than England.
Show the figures as a table
| Year | Nottingham | England |
|---|---|---|
| 2017/18 | 5.4% | 5.5% |
| 2018/19 | 5.4% | 5.5% |
| 2020/21 | 6.3% | 5.5% |
| 2021/22 | 8.9% | 9.0% |
| 2022/23 | 9.7% | 9.0% |
| 2023/24 | 9.4% | 8.9% |
| 2024/25 | 8.9% | 8.4% |
Sessions missed for any reason, as a share of all possible sessions in the school year. Source: Department for Education, Explore Education Statistics, Pupil absence in schools in England, 2024/25.
Persistent absence
2024/2525.4%
- England
- 23.4%
2.0 percentage points higher than England.
Show the figures as a table
| Year | Nottingham | England |
|---|---|---|
| 2017/18 | 14.8% | 13.9% |
| 2018/19 | 14.0% | 13.7% |
| 2020/21 | 17.6% | 14.8% |
| 2021/22 | 27.5% | 27.7% |
| 2022/23 | 29.3% | 26.5% |
| 2023/24 | 27.2% | 25.6% |
| 2024/25 | 25.4% | 23.4% |
Pupils who missed 10% or more of their possible sessions, as a share of pupils. Source: Department for Education, Explore Education Statistics, Pupil absence in schools in England, 2024/25.
Severe absence
2024/254.5%
- England
- 3.9%
0.6 percentage points higher than England.
Show the figures as a table
| Year | Nottingham | England |
|---|---|---|
| 2017/18 | 1.0% | 1.2% |
| 2018/19 | 1.0% | 1.3% |
| 2020/21 | 1.8% | 1.5% |
| 2021/22 | 2.7% | 2.7% |
| 2022/23 | 3.6% | 3.4% |
| 2023/24 | 4.2% | 3.8% |
| 2024/25 | 4.5% | 3.9% |
Pupils who missed 50% or more of their possible sessions, as a share of pupils. Source: Department for Education, Explore Education Statistics, Pupil absence in schools in England, 2024/25.
Suspensions per 100 pupils
2024/2529.70
- England
- 21.24
8.46 higher than England.
Show the figures as a table
| Year | Nottingham | England |
|---|---|---|
| 2017/18 | 14.42 | 10.13 |
| 2018/19 | 19.20 | 10.75 |
| 2019/20 | 14.48 | 7.43 |
| 2020/21 | 26.95 | 8.48 |
| 2021/22 | 37.94 | 13.96 |
| 2022/23 | 40.10 | 18.90 |
| 2023/24 | 44.61 | 22.61 |
| 2024/25 | 29.70 | 21.24 |
Suspensions in the school year for every 100 pupils on roll. One pupil can be suspended more than once. Source: Department for Education, Explore Education Statistics, Suspensions and permanent exclusions in England, 2024/25.
Permanent exclusions per 100 pupils
2024/250.61
- England
- 0.23
0.38 higher than England.
Show the figures as a table
| Year | Nottingham | England |
|---|---|---|
| 2017/18 | 0.29 | 0.20 |
| 2018/19 | 0.35 | 0.20 |
| 2019/20 | 0.33 | 0.13 |
| 2020/21 | 0.35 | 0.10 |
| 2021/22 | 0.40 | 0.16 |
| 2022/23 | 0.41 | 0.22 |
| 2023/24 | 0.68 | 0.25 |
| 2024/25 | 0.61 | 0.23 |
Permanent exclusions in the school year for every 100 pupils on roll. Source: Department for Education, Explore Education Statistics, Suspensions and permanent exclusions in England, 2024/25.
Attainment 8
2025/26 (provisional)44.3
- England
- 47.4
3.1 lower than England.
Show the figures as a table
| Year | Nottingham | England |
|---|---|---|
| 2021/22 | 45.5 | 49.8 |
| 2022/23 | 43.3 | 47.2 |
| 2023/24 | 43.0 | 46.9 |
| 2024/25 | 44.0 | 47.1 |
| 2025/26 (provisional) | 44.3 | 47.4 |
The average of pupils' points across eight GCSE-level qualifications, with English and maths counted twice. Source: Department for Education, Explore Education Statistics, Key stage 4 performance, 2025/26.
English and maths: grade 4 or above
2025/26 (provisional)61%
- England
- 66%
5 percentage points lower than England.
Show the figures as a table
| Year | Nottingham | England |
|---|---|---|
| 2021/22 | 63% | 70% |
| 2022/23 | 58% | 67% |
| 2023/24 | 60% | 67% |
| 2024/25 | 61% | 66% |
| 2025/26 (provisional) | 61% | 66% |
Pupils at the end of key stage 4 with grade 4 or above in both English and maths. Source: Department for Education, Explore Education Statistics, Key stage 4 performance, 2025/26.
English and maths: grade 5 or above
2025/26 (provisional)43%
- England
- 48%
5 percentage points lower than England.
Show the figures as a table
| Year | Nottingham | England |
|---|---|---|
| 2021/22 | 42% | 51% |
| 2022/23 | 36% | 46% |
| 2023/24 | 39% | 47% |
| 2024/25 | 41% | 47% |
| 2025/26 (provisional) | 43% | 48% |
Pupils at the end of key stage 4 with grade 5 or above in both English and maths. Source: Department for Education, Explore Education Statistics, Key stage 4 performance, 2025/26.
Eligible for free school meals
2024/2540.1%
- England
- 25.8%
14.3 percentage points higher than England.
Show the figures as a table
| Year | Nottingham | England |
|---|---|---|
| 2021/22 | 35.2% | 20.9% |
| 2022/23 | 37.1% | 22.7% |
| 2023/24 | 37.9% | 24.1% |
| 2024/25 | 40.1% | 25.8% |
Pupils known to be eligible for free school meals on census day in January. Source: Department for Education, Explore Education Statistics, Schools, pupils and their characteristics, 2024/25.
SEN support
2024/2513.5%
- England
- 13.4%
0.1 percentage points higher than England.
Show the figures as a table
| Year | Nottingham | England |
|---|---|---|
| 2021/22 | 13.1% | 11.9% |
| 2022/23 | 12.8% | 12.4% |
| 2023/24 | 13.5% | 12.9% |
| 2024/25 | 13.5% | 13.4% |
Pupils receiving special educational needs support without an education, health and care plan. Source: Department for Education, Explore Education Statistics, Schools, pupils and their characteristics, 2024/25.
Education, health and care plan
2024/251.2%
- England
- 3.1%
1.9 percentage points lower than England.
Show the figures as a table
| Year | Nottingham | England |
|---|---|---|
| 2021/22 | 0.9% | 2.2% |
| 2022/23 | 0.9% | 2.4% |
| 2023/24 | 1.2% | 2.7% |
| 2024/25 | 1.2% | 3.1% |
Pupils with an education, health and care plan. Source: Department for Education, Explore Education Statistics, Schools, pupils and their characteristics, 2024/25.
First language other than English
2024/2534.6%
- England
- 19.2%
15.4 percentage points higher than England.
Show the figures as a table
| Year | Nottingham | England |
|---|---|---|
| 2021/22 | 29.9% | 17.5% |
| 2022/23 | 31.7% | 18.1% |
| 2023/24 | 33.4% | 18.6% |
| 2024/25 | 34.6% | 19.2% |
Pupils whose first language is known or believed to be other than English. Source: Department for Education, Explore Education Statistics, Schools, pupils and their characteristics, 2024/25.
Pupils per qualified teacher
2025/2617.4
- England
- 17.3
0.1 higher than England.
Show the figures as a table
| Year | Nottingham | England |
|---|---|---|
| 2017/18 | 13.6 | 16.5 |
| 2018/19 | 15.7 | 16.8 |
| 2019/20 | 16.3 | 17.2 |
| 2020/21 | 17.5 | 17.1 |
| 2021/22 | 17.3 | 17.1 |
| 2022/23 | 17.0 | 17.2 |
| 2023/24 | 18.5 | 17.4 |
| 2024/25 | 17.9 | 17.3 |
| 2025/26 | 17.4 | 17.3 |
Full-time equivalent pupils for each full-time equivalent qualified teacher. Source: Department for Education, Explore Education Statistics, School workforce in England, 2025/26.
Special schools
Overall absence
2024/2514.1%
- England
- 12.8%
1.3 percentage points higher than England.
Show the figures as a table
| Year | Nottingham | England |
|---|---|---|
| 2017/18 | 11.1% | 10.2% |
| 2018/19 | 12.1% | 10.1% |
| 2020/21 | 20.2% | 15.2% |
| 2021/22 | 16.3% | 13.2% |
| 2022/23 | 16.1% | 13.0% |
| 2023/24 | 16.1% | 13.0% |
| 2024/25 | 14.1% | 12.8% |
Sessions missed for any reason, as a share of all possible sessions in the school year. Source: Department for Education, Explore Education Statistics, Pupil absence in schools in England, 2024/25.
Persistent absence
2024/2536.7%
- England
- 35.3%
1.4 percentage points higher than England.
Show the figures as a table
| Year | Nottingham | England |
|---|---|---|
| 2017/18 | 32.5% | 29.6% |
| 2018/19 | 33.1% | 28.8% |
| 2020/21 | 56.9% | 48.9% |
| 2021/22 | 44.2% | 40.4% |
| 2022/23 | 42.5% | 38.3% |
| 2023/24 | 45.1% | 37.2% |
| 2024/25 | 36.7% | 35.3% |
Pupils who missed 10% or more of their possible sessions, as a share of pupils. Source: Department for Education, Explore Education Statistics, Pupil absence in schools in England, 2024/25.
Severe absence
2024/258.7%
- England
- 6.9%
1.8 percentage points higher than England.
Show the figures as a table
| Year | Nottingham | England |
|---|---|---|
| 2017/18 | 5.6% | 4.4% |
| 2018/19 | 6.2% | 4.6% |
| 2020/21 | 11.5% | 5.6% |
| 2021/22 | 10.1% | 5.8% |
| 2022/23 | 9.9% | 6.2% |
| 2023/24 | 10.5% | 6.7% |
| 2024/25 | 8.7% | 6.9% |
Pupils who missed 50% or more of their possible sessions, as a share of pupils. Source: Department for Education, Explore Education Statistics, Pupil absence in schools in England, 2024/25.
Suspensions per 100 pupils
2024/2510.84
- England
- 12.32
1.48 lower than England.
Show the figures as a table
| Year | Nottingham | England |
|---|---|---|
| 2017/18 | 10.07 | 12.34 |
| 2018/19 | 12.42 | 11.32 |
| 2019/20 | 16.92 | 7.76 |
| 2020/21 | 18.06 | 7.29 |
| 2021/22 | 19.71 | 9.60 |
| 2022/23 | 14.76 | 10.99 |
| 2023/24 | 12.08 | 12.62 |
| 2024/25 | 10.84 | 12.32 |
Suspensions in the school year for every 100 pupils on roll. One pupil can be suspended more than once. Source: Department for Education, Explore Education Statistics, Suspensions and permanent exclusions in England, 2024/25.
Permanent exclusions per 100 pupils
2024/250.00
- England
- 0.08
0.08 lower than England.
Show the figures as a table
| Year | Nottingham | England |
|---|---|---|
| 2017/18 | 0.00 | 0.07 |
| 2018/19 | 0.00 | 0.06 |
| 2019/20 | 0.00 | 0.04 |
| 2020/21 | 0.00 | 0.03 |
| 2021/22 | 0.00 | 0.05 |
| 2022/23 | 0.14 | 0.08 |
| 2023/24 | 0.14 | 0.08 |
| 2024/25 | 0.00 | 0.08 |
Permanent exclusions in the school year for every 100 pupils on roll. Source: Department for Education, Explore Education Statistics, Suspensions and permanent exclusions in England, 2024/25.
Eligible for free school meals
2024/2563.7%
- England
- 48.8%
14.9 percentage points higher than England.
Show the figures as a table
| Year | Nottingham | England |
|---|---|---|
| 2021/22 | 55.3% | 44.4% |
| 2022/23 | 59.2% | 45.6% |
| 2023/24 | 60.4% | 47.1% |
| 2024/25 | 63.7% | 48.8% |
Pupils known to be eligible for free school meals on census day in January. Source: Department for Education, Explore Education Statistics, Schools, pupils and their characteristics, 2024/25.
SEN support
2024/250.3%
- England
- 0.5%
0.2 percentage points lower than England.
Show the figures as a table
| Year | Nottingham | England |
|---|---|---|
| 2021/22 | 1.1% | 0.9% |
| 2022/23 | 1.4% | 0.8% |
| 2023/24 | 0.5% | 0.7% |
| 2024/25 | 0.3% | 0.5% |
Pupils receiving special educational needs support without an education, health and care plan. Source: Department for Education, Explore Education Statistics, Schools, pupils and their characteristics, 2024/25.
Education, health and care plan
2024/2599.7%
- England
- 99.5%
0.2 percentage points higher than England.
Show the figures as a table
| Year | Nottingham | England |
|---|---|---|
| 2021/22 | 98.9% | 99.1% |
| 2022/23 | 98.6% | 99.2% |
| 2023/24 | 99.5% | 99.3% |
| 2024/25 | 99.7% | 99.5% |
Pupils with an education, health and care plan. Source: Department for Education, Explore Education Statistics, Schools, pupils and their characteristics, 2024/25.
First language other than English
2024/2526.4%
- England
- 14.4%
12.0 percentage points higher than England.
Show the figures as a table
| Year | Nottingham | England |
|---|---|---|
| 2021/22 | 24.8% | 14.5% |
| 2022/23 | 24.2% | 14.4% |
| 2023/24 | 25.7% | 14.4% |
| 2024/25 | 26.4% | 14.4% |
Pupils whose first language is known or believed to be other than English. Source: Department for Education, Explore Education Statistics, Schools, pupils and their characteristics, 2024/25.
Pupils per qualified teacher
2025/268.3
- England
- 7.3
1.0 higher than England.
Show the figures as a table
| Year | Nottingham | England |
|---|---|---|
| 2017/18 | 7.9 | 6.7 |
| 2018/19 | 8.3 | 6.8 |
| 2019/20 | 7.6 | 7.0 |
| 2020/21 | 7.5 | 6.8 |
| 2021/22 | 7.8 | 6.9 |
| 2022/23 | 6.8 | 7.0 |
| 2023/24 | 7.3 | 7.1 |
| 2024/25 | 7.3 | 7.3 |
| 2025/26 | 8.3 | 7.3 |
Full-time equivalent pupils for each full-time equivalent qualified teacher. Source: Department for Education, Explore Education Statistics, School workforce in England, 2025/26.
Schools in Nottingham
Listed by name. Filter by phase or type; sort by name or size. Nothing here is sorted by results.
Showing 105 of 105 schools in Nottingham.
| School | Phase | Type | Town | Pupils |
|---|---|---|---|---|
| Ambleside Primary School | Primary | Academy | Nottingham | 629 |
| Berridge Primary and Nursery School | Primary | Maintained | Nottingham | 624 |
| Bilborough College | 16 to 19 | Academy | Nottingham | 0 |
| Blessed Robert Widmerpool Catholic Primary and Nursery School | Primary | Academy | Nottingham | 253 |
| Blue Bell Hill Primary and Nursery School | Primary | Academy | Nottingham | 452 |
| Bluecoat Aspley Academy | Secondary | Academy | Nottingham | 1,344 |
| Bluecoat Beechdale Academy | Secondary | Academy | Nottingham | 887 |
| Bluecoat Bentinck Primary Academy | Primary | Academy | Nottingham | 220 |
| Bluecoat Primary Academy | Primary | Academy | Nottingham | 452 |
| Bluecoat Trent Academy | Secondary | Free school | Nottingham | 1,132 |
| Bluecoat Wollaton Academy | Secondary | Academy | Nottingham | 879 |
| Brocklewood Primary and Nursery School | Primary | Academy | Nottingham | 401 |
| Brookvale Academy | Alternative provision | Academy | Nottingham | 45 |
| Bulwell St Mary's Primary and Nursery School | Primary | Academy | Nottingham | 221 |
| Burford Primary and Nursery School | Primary | Academy | Nottingham | 226 |
| Cantrell Primary and Nursery School | Primary | Academy | Nottingham | 381 |
| Carrington Primary and Nursery School | Primary | Maintained | Nottingham | 218 |
| Claremont Primary and Nursery School | Primary | Maintained | Nottingham | 382 |
| CP Riverside School | Alternative provision | Free school | Nottingham | 4 |
| Crabtree Farm Primary School | Primary | Maintained | Nottingham | 358 |
| Djanogly City Academy | Secondary | Academy | Nottingham | 1,270 |
| Djanogly Northgate Academy | Primary | Academy | Nottingham | 321 |
| Djanogly Sherwood Academy | Primary | Academy | Nottingham | 328 |
| Djanogly Strelley Academy | Primary | Academy | Nottingham | 386 |
| Dovecote Primary and Nursery School | Primary | Maintained | Nottingham | 288 |
| Dunkirk Primary and Nursery School | Primary | Maintained | Nottingham | 337 |
| Edale Rise Primary & Nursery School | Primary | Academy | Nottingham | 231 |
| Edna G. Olds Academy | Primary | Academy | Nottingham | 241 |
| Ellis Guilford School | Secondary | Academy | Nottingham | 1,171 |
| Fairhaven Academy | Alternative provision | Academy | Nottingham | 265 |
| Farnborough Spencer Academy | Secondary | Academy | Nottingham | 1,005 |
| Fernwood Primary School | Primary | Maintained | Nottingham | 1,122 |
| Fernwood School | Secondary | Academy | Nottingham | 1,543 |
| Firbeck Academy | Primary | Academy | Nottingham | 173 |
| Forest Fields Primary and Nursery School | Primary | Maintained | Nottingham | 603 |
| Glade Hill Primary & Nursery School | Primary | Maintained | Nottingham | 400 |
| Glenbrook Spencer Academy | Primary | Academy | Nottingham | 369 |
| Greenfields Community School | Primary | Maintained | Nottingham | 235 |
| Haydn Primary School | Primary | Maintained | Nottingham | 459 |
| Heathfield Primary and Nursery School | Primary | Maintained | Nottingham | 704 |
| Hempshill Hall Primary School | Primary | Maintained | Nottingham | 400 |
| Henry Whipple Primary School | Primary | Maintained | Nottingham | 194 |
| Highbank Primary and Nursery School | Primary | Academy | Nottingham | 250 |
| Hogarth Academy | Primary | Academy | Nottingham | 212 |
| Huntingdon Academy | Primary | Academy | Nottingham | 434 |
| Jubilee L.E.A.D. Academy | Primary | Academy | Nottingham | 344 |
| Melbury Primary School | Primary | Maintained | Nottingham | 223 |
| Mellers Primary School | Primary | Maintained | Nottingham | 450 |
| Middleton Primary and Nursery School | Primary | Maintained | Nottingham | 668 |
| Nethergate Academy | Special | Academy | Nottingham | 174 |
| Nottingham Academy | All-through | Academy | Nottingham | 1,947 |
| Nottingham Free School | Secondary | Free school | Nottingham | 699 |
| Nottingham Girls' Academy | Secondary | Academy | Nottingham | 931 |
| Nottingham HOPE Academy | Alternative provision | Academy | Nottingham | 95 |
| Nottingham University Academy of Science and Technology | Secondary | Free school | Nottingham | 928 |
| Nottingham University Samworth Academy | Secondary | Academy | Nottingham | 841 |
| Oak Field School | Special | Maintained special | Nottingham | 158 |
| Old Basford School | Primary | Academy | Nottingham | 447 |
| Our Lady & St Edward Primary & Nursery Catholic Voluntary Academy | Primary | Academy | Nottingham | 238 |
| Our Lady of Perpetual Succour Catholic Primary School | Primary | Academy | Nottingham | 243 |
| Park Vale Academy | Secondary | Academy | Nottingham | 880 |
| Portland Spencer Academy | Primary | Academy | Nottingham | 366 |
| Radford Primary School Academy | Primary | Academy | Nottingham | 207 |
| Rise Park Primary and Nursery School | Primary | Maintained | Nottingham | 458 |
| Robert Shaw Primary and Nursery School | Primary | Academy | Nottingham | 422 |
| Robin Hood Primary School | Primary | Maintained | Nottingham | 468 |
| Rosehill School | Special | Maintained special | Nottingham | 121 |
| Rosslyn Park Primary and Nursery School | Primary | Academy | Nottingham | 576 |
| Rufford Primary and Nursery School | Primary | Maintained | Bulwell | 438 |
| Scotholme Primary and Nursery School | Primary | Academy | Nottingham | 461 |
| Seely Primary School | Primary | Maintained | Nottingham | 523 |
| Sneinton St Stephen's CofE Primary School | Primary | Academy | Nottingham | 248 |
| South Wilford Endowed CofE Primary School | Primary | Academy | Nottingham | 365 |
| Southglade Primary and Nursery School | Primary | Maintained | Nottingham | 444 |
| Southwark Primary School | Primary | Academy | Nottingham | 624 |
| Southwold Primary School and Early Years' Centre | Primary | Maintained | Nottingham | 203 |
| Springfield Academy | Primary | Academy | Nottingham | 212 |
| St Ann's Well Academy | Primary | Academy | Nottingham | 220 |
| St Augustine's Catholic Primary and Nursery School, A Voluntary Academy | Primary | Academy | Nottingham | 306 |
| St Margaret Clitherow Catholic Primary School | Primary | Academy | Nottingham | 229 |
| St Mary's Catholic Primary School | Primary | Academy | Nottingham | 234 |
| St Patrick's Catholic Primary and Nursery School | Primary | Academy | Nottingham | 196 |
| St Teresa's Catholic Primary School | Primary | Academy | Nottingham | 417 |
| Stanstead Flying High Academy | Primary | Academy | Nottingham | 203 |
| Stone Soup Academy | Alternative provision | Free school | Nottingham | 10 |
| Sycamore Academy | Primary | Academy | Nottingham | 466 |
| The Bulwell Academy | Secondary | Academy | Nottingham | 1,051 |
| The Glapton Academy | Primary | Academy | Nottingham | 325 |
| The Milford Academy | Primary | Academy | Nottingham | 430 |
| The Nottingham Emmanuel School | Secondary | Academy | West Bridgford | 1,108 |
| The Nottingham Nursery School and Training Centre | Nursery | Maintained | Nottingham | 93 |
| The Oakwood Academy | Secondary | Academy | Nottingham | 737 |
| The Trinity Catholic School A Voluntary Academy | Secondary | Academy | Nottingham | 1,182 |
| The Wells Academy | Secondary | Academy | Nottingham | 634 |
| Victoria Primary School | Primary | Academy | Nottingham | 289 |
| Walter Halls Primary and Early Years School | Primary | Maintained | Nottingham | 414 |
| Warren Primary Academy | Primary | Academy | Nottingham | 204 |
| Welbeck Primary School | Primary | Maintained | Nottingham | 352 |
| Westglade Primary School | Primary | Maintained | Nottingham | 237 |
| Whitegate Primary and Nursery School | Primary | Academy | Nottingham | 424 |
| Whitemoor Academy (Primary and Nursery) | Primary | Academy | Nottingham | 385 |
| William Booth Primary and Nursery School | Primary | Academy | Nottingham | 220 |
| Willowfield Academy | Special | Academy | Nottingham | 119 |
| Windmill L.E.A.D. Academy | Primary | Academy | Nottingham | 460 |
| Woodlands Academy | Special | Academy | Nottingham | 96 |