Central Bedfordshire
129 state-funded schools with 48,869 pupils on roll, in the East of England region. Every school’s page has its published figures against Central Bedfordshire and England.
- Primary
- 95
- Secondary
- 26
- All-through
- 1
- Special
- 4
- Alternative provision
- 1
- Nursery
- 2
- Academies
- 70
- Maintained
- 54
- Free schools
- 3
- Maintained special
- 2
Map
Zoom in to see each school. Open the full map
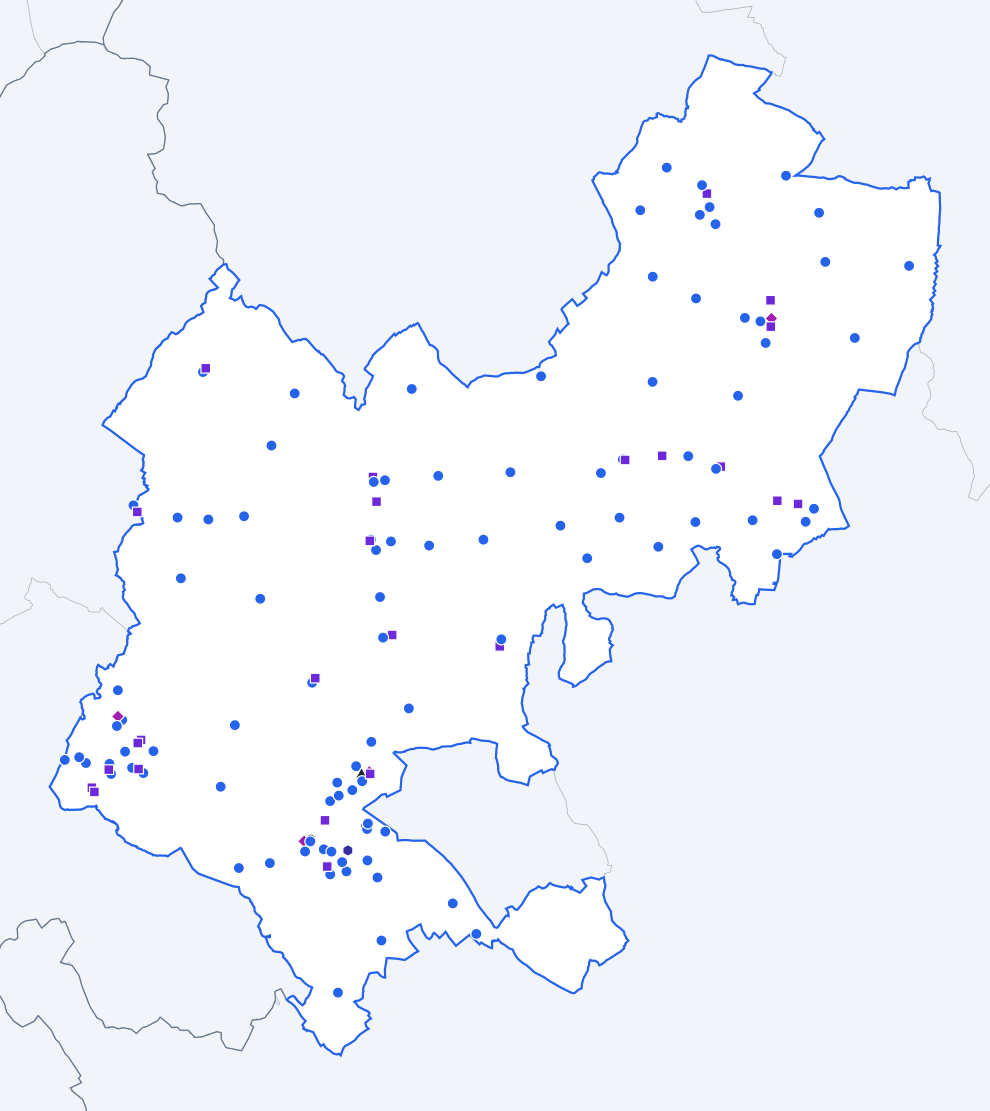
ONS, OS © Crown copyright 2025 · GIAS · © OpenStreetMap
Central Bedfordshire against England
Published figures for the authority’s schools, set against the same kind of school across England.
All state-funded schools
Overall absence
2024/256.4%
- England
- 6.8%
0.4 percentage points lower than England.
Show the figures as a table
| Year | Central Bedfordshire | England |
|---|---|---|
| 2017/18 | 4.8% | 4.8% |
| 2018/19 | 4.6% | 4.7% |
| 2020/21 | 4.2% | 4.6% |
| 2021/22 | 7.6% | 7.6% |
| 2022/23 | 7.1% | 7.4% |
| 2023/24 | 6.8% | 7.1% |
| 2024/25 | 6.4% | 6.8% |
Sessions missed for any reason, as a share of all possible sessions in the school year. Source: Department for Education, Explore Education Statistics, Pupil absence in schools in England, 2024/25.
Persistent absence
2024/2516.3%
- England
- 18.1%
1.8 percentage points lower than England.
Show the figures as a table
| Year | Central Bedfordshire | England |
|---|---|---|
| 2017/18 | 10.6% | 11.2% |
| 2018/19 | 9.9% | 10.9% |
| 2020/21 | 10.0% | 12.1% |
| 2021/22 | 22.0% | 22.5% |
| 2022/23 | 19.3% | 21.2% |
| 2023/24 | 18.7% | 20.0% |
| 2024/25 | 16.3% | 18.1% |
Pupils who missed 10% or more of their possible sessions, as a share of pupils. Source: Department for Education, Explore Education Statistics, Pupil absence in schools in England, 2024/25.
Severe absence
2024/252.2%
- England
- 2.4%
0.2 percentage points lower than England.
Show the figures as a table
| Year | Central Bedfordshire | England |
|---|---|---|
| 2017/18 | 1.0% | 0.8% |
| 2018/19 | 1.0% | 0.8% |
| 2020/21 | 1.2% | 1.1% |
| 2021/22 | 1.7% | 1.7% |
| 2022/23 | 2.0% | 2.0% |
| 2023/24 | 2.1% | 2.3% |
| 2024/25 | 2.2% | 2.4% |
Pupils who missed 50% or more of their possible sessions, as a share of pupils. Source: Department for Education, Explore Education Statistics, Pupil absence in schools in England, 2024/25.
Suspensions per 100 pupils
2024/259.51
- England
- 10.88
1.37 lower than England.
Show the figures as a table
| Year | Central Bedfordshire | England |
|---|---|---|
| 2017/18 | 4.04 | 5.08 |
| 2018/19 | 4.72 | 5.36 |
| 2019/20 | 3.38 | 3.76 |
| 2020/21 | 3.75 | 4.25 |
| 2021/22 | 5.36 | 6.91 |
| 2022/23 | 8.00 | 9.33 |
| 2023/24 | 9.13 | 11.31 |
| 2024/25 | 9.51 | 10.88 |
Suspensions in the school year for every 100 pupils on roll. One pupil can be suspended more than once. Source: Department for Education, Explore Education Statistics, Suspensions and permanent exclusions in England, 2024/25.
Permanent exclusions per 100 pupils
2024/250.15
- England
- 0.12
0.03 higher than England.
Show the figures as a table
| Year | Central Bedfordshire | England |
|---|---|---|
| 2017/18 | 0.13 | 0.10 |
| 2018/19 | 0.11 | 0.10 |
| 2019/20 | 0.07 | 0.06 |
| 2020/21 | 0.04 | 0.05 |
| 2021/22 | 0.09 | 0.08 |
| 2022/23 | 0.15 | 0.11 |
| 2023/24 | 0.16 | 0.13 |
| 2024/25 | 0.15 | 0.12 |
Permanent exclusions in the school year for every 100 pupils on roll. Source: Department for Education, Explore Education Statistics, Suspensions and permanent exclusions in England, 2024/25.
Eligible for free school meals
2024/2514.0%
- England
- 25.7%
11.7 percentage points lower than England.
Show the figures as a table
| Year | Central Bedfordshire | England |
|---|---|---|
| 2021/22 | 12.2% | 22.5% |
| 2022/23 | 13.1% | 23.8% |
| 2023/24 | 13.7% | 24.6% |
| 2024/25 | 14.0% | 25.7% |
Pupils known to be eligible for free school meals on census day in January. Source: Department for Education, Explore Education Statistics, Schools, pupils and their characteristics, 2024/25.
SEN support
2024/2511.5%
- England
- 14.0%
2.5 percentage points lower than England.
Show the figures as a table
| Year | Central Bedfordshire | England |
|---|---|---|
| 2021/22 | 11.4% | 12.4% |
| 2022/23 | 11.9% | 12.9% |
| 2023/24 | 11.6% | 13.4% |
| 2024/25 | 11.5% | 14.0% |
Pupils receiving special educational needs support without an education, health and care plan. Source: Department for Education, Explore Education Statistics, Schools, pupils and their characteristics, 2024/25.
Education, health and care plan
2024/256.2%
- England
- 5.2%
1.0 percentage point higher than England.
Show the figures as a table
| Year | Central Bedfordshire | England |
|---|---|---|
| 2021/22 | 4.3% | 3.8% |
| 2022/23 | 4.9% | 4.2% |
| 2023/24 | 5.7% | 4.7% |
| 2024/25 | 6.2% | 5.2% |
Pupils with an education, health and care plan. Source: Department for Education, Explore Education Statistics, Schools, pupils and their characteristics, 2024/25.
First language other than English
2024/2510.2%
- England
- 21.4%
11.2 percentage points lower than England.
Show the figures as a table
| Year | Central Bedfordshire | England |
|---|---|---|
| 2021/22 | 7.2% | 19.6% |
| 2022/23 | 8.3% | 20.2% |
| 2023/24 | 9.2% | 20.8% |
| 2024/25 | 10.2% | 21.4% |
Pupils whose first language is known or believed to be other than English. Source: Department for Education, Explore Education Statistics, Schools, pupils and their characteristics, 2024/25.
Pupils per qualified teacher
2025/2619.5
- England
- 18.5
1.0 higher than England.
Show the figures as a table
| Year | Central Bedfordshire | England |
|---|---|---|
| 2017/18 | 19.6 | 18.4 |
| 2018/19 | 19.7 | 18.6 |
| 2019/20 | 20.2 | 18.8 |
| 2020/21 | 19.6 | 18.5 |
| 2021/22 | 19.7 | 18.5 |
| 2022/23 | 19.7 | 18.5 |
| 2023/24 | 19.6 | 18.6 |
| 2024/25 | 20.3 | 18.6 |
| 2025/26 | 19.5 | 18.5 |
Full-time equivalent pupils for each full-time equivalent qualified teacher. Source: Department for Education, Explore Education Statistics, School workforce in England, 2025/26.
Teacher sickness absence
2024/255.1 days
- England
- 5.0 days
0.1 days higher than England.
Show the figures as a table
| Year | Central Bedfordshire | England |
|---|---|---|
| 2017/18 | 4.3 days | 4.0 days |
| 2018/19 | 4.7 days | 4.0 days |
| 2019/20 | Not published | Not published |
| 2020/21 | 4.1 days | 3.9 days |
| 2021/22 | 7.2 days | 6.3 days |
| 2022/23 | 5.7 days | 5.2 days |
| 2023/24 | 5.8 days | 5.3 days |
| 2024/25 | 5.1 days | 5.0 days |
Days lost to sickness absence in the school year, averaged across all teachers. Source: Department for Education, Explore Education Statistics, School workforce in England, 2024/25.
Primary schools
Overall absence
2024/255.0%
- England
- 5.2%
0.2 percentage points lower than England.
Show the figures as a table
| Year | Central Bedfordshire | England |
|---|---|---|
| 2017/18 | 4.4% | 4.2% |
| 2018/19 | 4.0% | 4.0% |
| 2020/21 | 3.4% | 3.6% |
| 2021/22 | 6.9% | 6.3% |
| 2022/23 | 6.0% | 5.9% |
| 2023/24 | 5.6% | 5.5% |
| 2024/25 | 5.0% | 5.2% |
Sessions missed for any reason, as a share of all possible sessions in the school year. Source: Department for Education, Explore Education Statistics, Pupil absence in schools in England, 2024/25.
Persistent absence
2024/2511.3%
- England
- 13.0%
1.7 percentage points lower than England.
Show the figures as a table
| Year | Central Bedfordshire | England |
|---|---|---|
| 2017/18 | 9.0% | 8.7% |
| 2018/19 | 7.9% | 8.2% |
| 2020/21 | 7.8% | 8.8% |
| 2021/22 | 19.6% | 17.7% |
| 2022/23 | 15.3% | 16.2% |
| 2023/24 | 14.2% | 14.6% |
| 2024/25 | 11.3% | 13.0% |
Pupils who missed 10% or more of their possible sessions, as a share of pupils. Source: Department for Education, Explore Education Statistics, Pupil absence in schools in England, 2024/25.
Severe absence
2024/251.2%
- England
- 0.9%
0.3 percentage points higher than England.
Show the figures as a table
| Year | Central Bedfordshire | England |
|---|---|---|
| 2017/18 | 0.7% | 0.4% |
| 2018/19 | 0.6% | 0.4% |
| 2020/21 | 1.0% | 0.7% |
| 2021/22 | 1.0% | 0.6% |
| 2022/23 | 1.2% | 0.7% |
| 2023/24 | 1.2% | 0.9% |
| 2024/25 | 1.2% | 0.9% |
Pupils who missed 50% or more of their possible sessions, as a share of pupils. Source: Department for Education, Explore Education Statistics, Pupil absence in schools in England, 2024/25.
Suspensions per 100 pupils
2024/253.50
- England
- 2.47
1.03 higher than England.
Show the figures as a table
| Year | Central Bedfordshire | England |
|---|---|---|
| 2017/18 | 1.60 | 1.40 |
| 2018/19 | 2.25 | 1.41 |
| 2019/20 | 1.41 | 1.00 |
| 2020/21 | 1.39 | 0.99 |
| 2021/22 | 2.12 | 1.42 |
| 2022/23 | 2.94 | 1.81 |
| 2023/24 | 2.81 | 2.27 |
| 2024/25 | 3.50 | 2.47 |
Suspensions in the school year for every 100 pupils on roll. One pupil can be suspended more than once. Source: Department for Education, Explore Education Statistics, Suspensions and permanent exclusions in England, 2024/25.
Permanent exclusions per 100 pupils
2024/250.05
- England
- 0.03
0.02 higher than England.
Show the figures as a table
| Year | Central Bedfordshire | England |
|---|---|---|
| 2017/18 | 0.03 | 0.03 |
| 2018/19 | 0.03 | 0.02 |
| 2019/20 | 0.01 | 0.02 |
| 2020/21 | 0.00 | 0.01 |
| 2021/22 | 0.04 | 0.02 |
| 2022/23 | 0.04 | 0.03 |
| 2023/24 | 0.03 | 0.03 |
| 2024/25 | 0.05 | 0.03 |
Permanent exclusions in the school year for every 100 pupils on roll. Source: Department for Education, Explore Education Statistics, Suspensions and permanent exclusions in England, 2024/25.
Reading, writing and maths: expected standard
2025/26 (provisional)55%
- England
- 63%
8 percentage points lower than England.
Show the figures as a table
| Year | Central Bedfordshire | England |
|---|---|---|
| 2021/22 | 53% | 59% |
| 2022/23 | 51% | 60% |
| 2023/24 | 53% | 61% |
| 2024/25 | 50% | 63% |
| 2025/26 (provisional) | 55% | 63% |
Pupils at the end of key stage 2 who met the expected standard in reading, writing and maths combined. Source: Department for Education, Explore Education Statistics, Key stage 2 attainment, 2025/26.
Reading, writing and maths: higher standard
2025/26 (provisional)5%
- England
- 9%
4 percentage points lower than England.
Show the figures as a table
| Year | Central Bedfordshire | England |
|---|---|---|
| 2021/22 | 4% | 7% |
| 2022/23 | 5% | 8% |
| 2023/24 | 4% | 8% |
| 2024/25 | 3% | 8% |
| 2025/26 (provisional) | 5% | 9% |
Pupils at the end of key stage 2 who met the higher standard in reading, writing and maths combined. Source: Department for Education, Explore Education Statistics, Key stage 2 attainment, 2025/26.
Eligible for free school meals
2024/2511.9%
- England
- 24.7%
12.8 percentage points lower than England.
Show the figures as a table
| Year | Central Bedfordshire | England |
|---|---|---|
| 2021/22 | 11.5% | 23.1% |
| 2022/23 | 12.1% | 24.0% |
| 2023/24 | 12.2% | 24.3% |
| 2024/25 | 11.9% | 24.7% |
Pupils known to be eligible for free school meals on census day in January. Source: Department for Education, Explore Education Statistics, Schools, pupils and their characteristics, 2024/25.
SEN support
2024/2511.4%
- England
- 15.0%
3.6 percentage points lower than England.
Show the figures as a table
| Year | Central Bedfordshire | England |
|---|---|---|
| 2021/22 | 11.3% | 13.0% |
| 2022/23 | 11.8% | 13.5% |
| 2023/24 | 11.7% | 14.1% |
| 2024/25 | 11.4% | 15.0% |
Pupils receiving special educational needs support without an education, health and care plan. Source: Department for Education, Explore Education Statistics, Schools, pupils and their characteristics, 2024/25.
Education, health and care plan
2024/254.3%
- England
- 3.5%
0.8 percentage points higher than England.
Show the figures as a table
| Year | Central Bedfordshire | England |
|---|---|---|
| 2021/22 | 2.7% | 2.3% |
| 2022/23 | 3.0% | 2.5% |
| 2023/24 | 4.0% | 3.0% |
| 2024/25 | 4.3% | 3.5% |
Pupils with an education, health and care plan. Source: Department for Education, Explore Education Statistics, Schools, pupils and their characteristics, 2024/25.
First language other than English
2024/2512.2%
- England
- 23.4%
11.2 percentage points lower than England.
Show the figures as a table
| Year | Central Bedfordshire | England |
|---|---|---|
| 2021/22 | 8.9% | 21.2% |
| 2022/23 | 10.2% | 22.0% |
| 2023/24 | 11.2% | 22.8% |
| 2024/25 | 12.2% | 23.4% |
Pupils whose first language is known or believed to be other than English. Source: Department for Education, Explore Education Statistics, Schools, pupils and their characteristics, 2024/25.
Pupils per qualified teacher
2025/2623.0
- England
- 21.2
1.8 higher than England.
Show the figures as a table
| Year | Central Bedfordshire | England |
|---|---|---|
| 2017/18 | 22.2 | 21.3 |
| 2018/19 | 22.3 | 21.4 |
| 2019/20 | 22.9 | 21.4 |
| 2020/21 | 21.7 | 21.1 |
| 2021/22 | 22.5 | 21.0 |
| 2022/23 | 22.9 | 21.1 |
| 2023/24 | 23.1 | 21.2 |
| 2024/25 | 23.1 | 21.3 |
| 2025/26 | 23.0 | 21.2 |
Full-time equivalent pupils for each full-time equivalent qualified teacher. Source: Department for Education, Explore Education Statistics, School workforce in England, 2025/26.
Secondary schools
Overall absence
2024/257.4%
- England
- 8.4%
1.0 percentage point lower than England.
Show the figures as a table
| Year | Central Bedfordshire | England |
|---|---|---|
| 2017/18 | 5.1% | 5.5% |
| 2018/19 | 5.0% | 5.5% |
| 2020/21 | 4.6% | 5.5% |
| 2021/22 | 8.1% | 9.0% |
| 2022/23 | 7.8% | 9.0% |
| 2023/24 | 7.8% | 8.9% |
| 2024/25 | 7.4% | 8.4% |
Sessions missed for any reason, as a share of all possible sessions in the school year. Source: Department for Education, Explore Education Statistics, Pupil absence in schools in England, 2024/25.
Persistent absence
2024/2520.0%
- England
- 23.4%
3.4 percentage points lower than England.
Show the figures as a table
| Year | Central Bedfordshire | England |
|---|---|---|
| 2017/18 | 11.4% | 13.9% |
| 2018/19 | 11.1% | 13.7% |
| 2020/21 | 11.3% | 14.8% |
| 2021/22 | 23.6% | 27.7% |
| 2022/23 | 22.1% | 26.5% |
| 2023/24 | 22.1% | 25.6% |
| 2024/25 | 20.0% | 23.4% |
Pupils who missed 10% or more of their possible sessions, as a share of pupils. Source: Department for Education, Explore Education Statistics, Pupil absence in schools in England, 2024/25.
Severe absence
2024/252.8%
- England
- 3.9%
1.1 percentage points lower than England.
Show the figures as a table
| Year | Central Bedfordshire | England |
|---|---|---|
| 2017/18 | 1.1% | 1.2% |
| 2018/19 | 1.1% | 1.3% |
| 2020/21 | 1.3% | 1.5% |
| 2021/22 | 2.1% | 2.7% |
| 2022/23 | 2.5% | 3.4% |
| 2023/24 | 2.8% | 3.8% |
| 2024/25 | 2.8% | 3.9% |
Pupils who missed 50% or more of their possible sessions, as a share of pupils. Source: Department for Education, Explore Education Statistics, Pupil absence in schools in England, 2024/25.
Suspensions per 100 pupils
2024/2515.62
- England
- 21.24
5.62 lower than England.
Show the figures as a table
| Year | Central Bedfordshire | England |
|---|---|---|
| 2017/18 | 6.43 | 10.13 |
| 2018/19 | 7.12 | 10.75 |
| 2019/20 | 5.50 | 7.43 |
| 2020/21 | 6.14 | 8.48 |
| 2021/22 | 8.67 | 13.96 |
| 2022/23 | 13.24 | 18.90 |
| 2023/24 | 15.79 | 22.61 |
| 2024/25 | 15.62 | 21.24 |
Suspensions in the school year for every 100 pupils on roll. One pupil can be suspended more than once. Source: Department for Education, Explore Education Statistics, Suspensions and permanent exclusions in England, 2024/25.
Permanent exclusions per 100 pupils
2024/250.26
- England
- 0.23
0.03 higher than England.
Show the figures as a table
| Year | Central Bedfordshire | England |
|---|---|---|
| 2017/18 | 0.24 | 0.20 |
| 2018/19 | 0.18 | 0.20 |
| 2019/20 | 0.14 | 0.13 |
| 2020/21 | 0.07 | 0.10 |
| 2021/22 | 0.15 | 0.16 |
| 2022/23 | 0.27 | 0.22 |
| 2023/24 | 0.29 | 0.25 |
| 2024/25 | 0.26 | 0.23 |
Permanent exclusions in the school year for every 100 pupils on roll. Source: Department for Education, Explore Education Statistics, Suspensions and permanent exclusions in England, 2024/25.
Attainment 8
2025/26 (provisional)44.3
- England
- 47.4
3.1 lower than England.
Show the figures as a table
| Year | Central Bedfordshire | England |
|---|---|---|
| 2021/22 | 47.6 | 49.8 |
| 2022/23 | 45.3 | 47.2 |
| 2023/24 | 43.3 | 46.9 |
| 2024/25 | 44.8 | 47.1 |
| 2025/26 (provisional) | 44.3 | 47.4 |
The average of pupils' points across eight GCSE-level qualifications, with English and maths counted twice. Source: Department for Education, Explore Education Statistics, Key stage 4 performance, 2025/26.
English and maths: grade 4 or above
2025/26 (provisional)63%
- England
- 66%
3 percentage points lower than England.
Show the figures as a table
| Year | Central Bedfordshire | England |
|---|---|---|
| 2021/22 | 70% | 70% |
| 2022/23 | 66% | 67% |
| 2023/24 | 64% | 67% |
| 2024/25 | 67% | 66% |
| 2025/26 (provisional) | 63% | 66% |
Pupils at the end of key stage 4 with grade 4 or above in both English and maths. Source: Department for Education, Explore Education Statistics, Key stage 4 performance, 2025/26.
English and maths: grade 5 or above
2025/26 (provisional)42%
- England
- 48%
6 percentage points lower than England.
Show the figures as a table
| Year | Central Bedfordshire | England |
|---|---|---|
| 2021/22 | 46% | 51% |
| 2022/23 | 44% | 46% |
| 2023/24 | 41% | 47% |
| 2024/25 | 43% | 47% |
| 2025/26 (provisional) | 42% | 48% |
Pupils at the end of key stage 4 with grade 5 or above in both English and maths. Source: Department for Education, Explore Education Statistics, Key stage 4 performance, 2025/26.
Eligible for free school meals
2024/2515.2%
- England
- 25.8%
10.6 percentage points lower than England.
Show the figures as a table
| Year | Central Bedfordshire | England |
|---|---|---|
| 2021/22 | 12.3% | 20.9% |
| 2022/23 | 13.4% | 22.7% |
| 2023/24 | 14.3% | 24.1% |
| 2024/25 | 15.2% | 25.8% |
Pupils known to be eligible for free school meals on census day in January. Source: Department for Education, Explore Education Statistics, Schools, pupils and their characteristics, 2024/25.
SEN support
2024/2511.8%
- England
- 13.4%
1.6 percentage points lower than England.
Show the figures as a table
| Year | Central Bedfordshire | England |
|---|---|---|
| 2021/22 | 12.0% | 11.9% |
| 2022/23 | 12.4% | 12.4% |
| 2023/24 | 11.9% | 12.9% |
| 2024/25 | 11.8% | 13.4% |
Pupils receiving special educational needs support without an education, health and care plan. Source: Department for Education, Explore Education Statistics, Schools, pupils and their characteristics, 2024/25.
Education, health and care plan
2024/254.6%
- England
- 3.1%
1.5 percentage points higher than England.
Show the figures as a table
| Year | Central Bedfordshire | England |
|---|---|---|
| 2021/22 | 2.7% | 2.2% |
| 2022/23 | 3.3% | 2.4% |
| 2023/24 | 3.9% | 2.7% |
| 2024/25 | 4.6% | 3.1% |
Pupils with an education, health and care plan. Source: Department for Education, Explore Education Statistics, Schools, pupils and their characteristics, 2024/25.
First language other than English
2024/257.9%
- England
- 19.2%
11.3 percentage points lower than England.
Show the figures as a table
| Year | Central Bedfordshire | England |
|---|---|---|
| 2021/22 | 5.3% | 17.5% |
| 2022/23 | 6.2% | 18.1% |
| 2023/24 | 7.2% | 18.6% |
| 2024/25 | 7.9% | 19.2% |
Pupils whose first language is known or believed to be other than English. Source: Department for Education, Explore Education Statistics, Schools, pupils and their characteristics, 2024/25.
Pupils per qualified teacher
2025/2618.9
- England
- 17.3
1.6 higher than England.
Show the figures as a table
| Year | Central Bedfordshire | England |
|---|---|---|
| 2017/18 | 18.4 | 16.5 |
| 2018/19 | 18.7 | 16.8 |
| 2019/20 | 19.2 | 17.2 |
| 2020/21 | 19.1 | 17.1 |
| 2021/22 | 19.0 | 17.1 |
| 2022/23 | 18.7 | 17.2 |
| 2023/24 | 18.4 | 17.4 |
| 2024/25 | 19.6 | 17.3 |
| 2025/26 | 18.9 | 17.3 |
Full-time equivalent pupils for each full-time equivalent qualified teacher. Source: Department for Education, Explore Education Statistics, School workforce in England, 2025/26.
Special schools
Overall absence
2024/2512.4%
- England
- 12.8%
0.4 percentage points lower than England.
Show the figures as a table
| Year | Central Bedfordshire | England |
|---|---|---|
| 2017/18 | 11.1% | 10.2% |
| 2018/19 | 11.1% | 10.1% |
| 2020/21 | 11.1% | 15.2% |
| 2021/22 | 12.6% | 13.2% |
| 2022/23 | 13.0% | 13.0% |
| 2023/24 | 12.4% | 13.0% |
| 2024/25 | 12.4% | 12.8% |
Sessions missed for any reason, as a share of all possible sessions in the school year. Source: Department for Education, Explore Education Statistics, Pupil absence in schools in England, 2024/25.
Persistent absence
2024/2534.7%
- England
- 35.3%
0.6 percentage points lower than England.
Show the figures as a table
| Year | Central Bedfordshire | England |
|---|---|---|
| 2017/18 | 33.8% | 29.6% |
| 2018/19 | 29.1% | 28.8% |
| 2020/21 | 34.3% | 48.9% |
| 2021/22 | 39.2% | 40.4% |
| 2022/23 | 37.6% | 38.3% |
| 2023/24 | 34.2% | 37.2% |
| 2024/25 | 34.7% | 35.3% |
Pupils who missed 10% or more of their possible sessions, as a share of pupils. Source: Department for Education, Explore Education Statistics, Pupil absence in schools in England, 2024/25.
Severe absence
2024/256.8%
- England
- 6.9%
0.1 percentage points lower than England.
Show the figures as a table
| Year | Central Bedfordshire | England |
|---|---|---|
| 2017/18 | 5.7% | 4.4% |
| 2018/19 | 6.8% | 4.6% |
| 2020/21 | 5.2% | 5.6% |
| 2021/22 | 5.0% | 5.8% |
| 2022/23 | 5.6% | 6.2% |
| 2023/24 | 6.4% | 6.7% |
| 2024/25 | 6.8% | 6.9% |
Pupils who missed 50% or more of their possible sessions, as a share of pupils. Source: Department for Education, Explore Education Statistics, Pupil absence in schools in England, 2024/25.
Suspensions per 100 pupils
2024/2510.36
- England
- 12.32
1.96 lower than England.
Show the figures as a table
| Year | Central Bedfordshire | England |
|---|---|---|
| 2017/18 | 12.03 | 12.34 |
| 2018/19 | 13.64 | 11.32 |
| 2019/20 | 4.12 | 7.76 |
| 2020/21 | 6.01 | 7.29 |
| 2021/22 | 7.07 | 9.60 |
| 2022/23 | 8.49 | 10.99 |
| 2023/24 | 6.93 | 12.62 |
| 2024/25 | 10.36 | 12.32 |
Suspensions in the school year for every 100 pupils on roll. One pupil can be suspended more than once. Source: Department for Education, Explore Education Statistics, Suspensions and permanent exclusions in England, 2024/25.
Permanent exclusions per 100 pupils
2024/250.00
- England
- 0.08
0.08 lower than England.
Show the figures as a table
| Year | Central Bedfordshire | England |
|---|---|---|
| 2017/18 | 0.00 | 0.07 |
| 2018/19 | 0.63 | 0.06 |
| 2019/20 | 0.15 | 0.04 |
| 2020/21 | 0.28 | 0.03 |
| 2021/22 | 0.00 | 0.05 |
| 2022/23 | 0.24 | 0.08 |
| 2023/24 | 0.23 | 0.08 |
| 2024/25 | 0.00 | 0.08 |
Permanent exclusions in the school year for every 100 pupils on roll. Source: Department for Education, Explore Education Statistics, Suspensions and permanent exclusions in England, 2024/25.
Eligible for free school meals
2024/2540.2%
- England
- 48.8%
8.6 percentage points lower than England.
Show the figures as a table
| Year | Central Bedfordshire | England |
|---|---|---|
| 2021/22 | 34.0% | 44.4% |
| 2022/23 | 36.2% | 45.6% |
| 2023/24 | 37.6% | 47.1% |
| 2024/25 | 40.2% | 48.8% |
Pupils known to be eligible for free school meals on census day in January. Source: Department for Education, Explore Education Statistics, Schools, pupils and their characteristics, 2024/25.
SEN support
2024/250.0%
- England
- 0.5%
0.5 percentage points lower than England.
Show the figures as a table
| Year | Central Bedfordshire | England |
|---|---|---|
| 2021/22 | 0.0% | 0.9% |
| 2022/23 | 0.0% | 0.8% |
| 2023/24 | 0.0% | 0.7% |
| 2024/25 | 0.0% | 0.5% |
Pupils receiving special educational needs support without an education, health and care plan. Source: Department for Education, Explore Education Statistics, Schools, pupils and their characteristics, 2024/25.
Education, health and care plan
2024/25100.0%
- England
- 99.5%
0.5 percentage points higher than England.
Show the figures as a table
| Year | Central Bedfordshire | England |
|---|---|---|
| 2021/22 | 100.0% | 99.1% |
| 2022/23 | 100.0% | 99.2% |
| 2023/24 | 100.0% | 99.3% |
| 2024/25 | 100.0% | 99.5% |
Pupils with an education, health and care plan. Source: Department for Education, Explore Education Statistics, Schools, pupils and their characteristics, 2024/25.
First language other than English
2024/257.8%
- England
- 14.4%
6.6 percentage points lower than England.
Show the figures as a table
| Year | Central Bedfordshire | England |
|---|---|---|
| 2021/22 | 5.8% | 14.5% |
| 2022/23 | 5.7% | 14.4% |
| 2023/24 | 6.5% | 14.4% |
| 2024/25 | 7.8% | 14.4% |
Pupils whose first language is known or believed to be other than English. Source: Department for Education, Explore Education Statistics, Schools, pupils and their characteristics, 2024/25.
Pupils per qualified teacher
2025/265.3
- England
- 7.3
2.0 lower than England.
Show the figures as a table
| Year | Central Bedfordshire | England |
|---|---|---|
| 2017/18 | 7.3 | 6.7 |
| 2018/19 | 6.3 | 6.8 |
| 2019/20 | 6.9 | 7.0 |
| 2020/21 | 6.8 | 6.8 |
| 2021/22 | 6.3 | 6.9 |
| 2022/23 | 6.3 | 7.0 |
| 2023/24 | 6.4 | 7.1 |
| 2024/25 | 6.5 | 7.3 |
| 2025/26 | 5.3 | 7.3 |
Full-time equivalent pupils for each full-time equivalent qualified teacher. Source: Department for Education, Explore Education Statistics, School workforce in England, 2025/26.
Schools in Central Bedfordshire
Listed by name. Filter by phase or type; sort by name or size. Nothing here is sorted by results.
Showing 129 of 129 schools in Central Bedfordshire.
| School | Phase | Type | Town | Pupils |
|---|---|---|---|---|
| Alameda Middle School | Secondary | Academy | Bedford | 720 |
| All Saints Academy Dunstable | Secondary | Academy | Dunstable | 520 |
| Ardley Hill Academy | Primary | Academy | Dunstable | 422 |
| Arnold Academy | Secondary | Academy | Bedford | 704 |
| Ashton St Peter's VA C of E School | Primary | Maintained | Dunstable | 205 |
| Aspley Guise Village School | Primary | Academy | Aspley Guise | 136 |
| Beaudesert Lower School | Primary | Maintained | Leighton Buzzard | 278 |
| Beecroft Academy | Primary | Academy | Dunstable | 413 |
| Biggleswade Academy | Primary | Academy | Biggleswade | 839 |
| Brooklands Middle School | Secondary | Academy | Leighton Buzzard | 598 |
| Caddington Village School | Primary | Maintained | Luton | 277 |
| Caldecote Church of England Academy | Primary | Academy | Biggleswade | 85 |
| Campton Academy | Primary | Academy | Shefford | 128 |
| Cedars Upper School | Secondary | Academy | Leighton Buzzard | 1,135 |
| Chalton Lower School | Primary | Maintained | Luton | 65 |
| Clifton All Saints Academy | Primary | Academy | Near Shefford | 229 |
| Clipstone Brook Lower School | Primary | Maintained | Leighton Buzzard | 306 |
| Cranfield Church of England Academy | Primary | Academy | Bedford | 511 |
| Derwent Primary School | Primary | Maintained | Henlow | 419 |
| Dovery Academy | Primary | Academy | Leighton Buzzard | 191 |
| Dunstable Icknield Lower School | Primary | Academy | Dunstable | 295 |
| Dunton CofE Junior School | Primary | Maintained | Biggleswade | 66 |
| Eaton Bray Academy | Primary | Academy | Dunstable | 188 |
| Edward Peake CofE VC School | Secondary | Maintained | Biggleswade | 359 |
| Etonbury Academy | Secondary | Academy | Arlesey | 1,158 |
| Eversholt Lower School | Primary | Academy | Milton Keynes | 68 |
| Everton Heath Primary School | Primary | Academy | Nr Sandy | 82 |
| Fairfield Park Lower School | Primary | Maintained | Fairfield Park | 479 |
| Flitwick Lower School | Primary | Maintained | Bedford | 336 |
| Fulbrook School | Secondary | Academy | Milton Keynes | 551 |
| Gilbert Inglefield Academy | Secondary | Academy | Leighton Buzzard | Not published |
| Gothic Mede Academy | Primary | Academy | Arlesey | 249 |
| Gravenhurst Academy | Primary | Academy | Bedford | 72 |
| Greenfield CofE VC Lower School | Primary | Academy | Greenfield | 145 |
| Greenleas School | Primary | Maintained | Leighton Buzzard | 664 |
| Hadrian Academy | Primary | Academy | Dunstable | 394 |
| Harlington Lower School | Primary | Academy | Dunstable | 130 |
| Harlington Upper School | Secondary | Academy | Dunstable | 1,156 |
| Haynes Lower School | Primary | Maintained | Bedford | 136 |
| Heathwood Lower School | Primary | Maintained | Leighton Buzzard | 195 |
| Henlow Church of England Academy | Secondary | Academy | Henlow | 599 |
| Hockliffe Lower School | Primary | Academy | Leighton Buzzard | 67 |
| Holywell School | Secondary | Academy | Bedford | 668 |
| Houghton Conquest Primary School | Primary | Maintained | Bedford | 139 |
| Houghton Regis Primary School | Primary | Maintained | Dunstable | 386 |
| Houstone School | Secondary | Free school | Dunstable | 765 |
| Husborne Crawley Lower School | Primary | Maintained | Husborne Crawley | 42 |
| Ivel Valley School & College | Special | Maintained special | Biggleswade | 261 |
| John Donne Church of England Primary School | Primary | Maintained | Bedford | 119 |
| Kensworth Church of England Academy | Primary | Academy | Dunstable | 90 |
| Kingsmoor Lower School | Primary | Maintained | Bedford | 167 |
| Laburnum Primary School | Primary | Academy | Sandy | 174 |
| Lancot School | Primary | Academy | Dunstable | 423 |
| Langford Village Academy | Primary | Academy | Biggleswade | 295 |
| Lark Rise Academy | Primary | Academy | Dunstable | 351 |
| Lawnside Academy | Primary | Academy | Biggleswade | 283 |
| Leedon Lower School | Primary | Maintained | Leighton Buzzard | 368 |
| Leighton Middle School | Secondary | Maintained | Leighton Buzzard | 597 |
| Lidlington Primary School | Primary | Maintained | Bedford | 92 |
| Lime Tree Primary Academy | Primary | Academy | Houghton Regis | 360 |
| Linslade Lower School | Primary | Maintained | Leighton Buzzard | 181 |
| Linslade School | Secondary | Academy | Leighton Buzzard | 721 |
| Manshead Church of England Academy | Secondary | Academy | Luton | 1,134 |
| Maple Tree Primary School | Primary | Maintained | Sandy | 241 |
| Marston Moreteyne VC School | Primary | Maintained | Marston Moreteyne | 624 |
| Maulden Lower School | Primary | Maintained | Bedford | 166 |
| Meppershall Church of England Academy | Primary | Academy | Shefford | 238 |
| Moggerhanger Primary School | Primary | Maintained | Bedford | 119 |
| Northill CofE Academy | Primary | Academy | Biggleswade | 66 |
| Oak Bank School | Special | Academy | Leighton Buzzard | 123 |
| Parkfields Middle School | Secondary | Academy | Dunstable | 460 |
| Pix Brook Academy | Secondary | Free school | Stotfold | 1,011 |
| Potton Primary School | Primary | Maintained | Sandy | 387 |
| Priory Academy | All-through | Academy | Dunstable | 830 |
| Pulford CofE VA Lower School | Primary | Maintained | Leighton Buzzard | 259 |
| Queensbury Academy | Secondary | Academy | Dunstable | 1,093 |
| Ramsey Manor Lower School | Primary | Academy | Bedford | 293 |
| Raynsford Church of England Academy | Primary | Academy | Henlow | 246 |
| Redborne Upper School and Community College | Secondary | Academy | Bedford | 1,657 |
| Ridgmont Lower School | Primary | Maintained | Bedford | 11 |
| Robert Bloomfield Academy | Secondary | Academy | Shefford | 962 |
| Robert Peel Primary School | Primary | Maintained | Sandy | 386 |
| Roecroft Lower School | Primary | Maintained | Hitchin | 359 |
| Russell Lower School | Primary | Maintained | Ampthill | 437 |
| Samuel Whitbread Academy | Secondary | Academy | Shefford | 1,657 |
| Sandy Secondary School | Secondary | Maintained | Sandy | 1,259 |
| Shefford Lower School | Primary | Maintained | Shefford | 514 |
| Shillington Lower School | Primary | Maintained | Hitchin | 94 |
| Silsoe CofE VC Lower School | Primary | Maintained | Bedford | 251 |
| Slip End Village School | Primary | Maintained | Luton | 112 |
| Southcott Lower School | Primary | Maintained | Leighton Buzzard | 312 |
| Southill Lower School | Primary | Maintained | Biggleswade | 78 |
| St Andrew's CofE VC Primary School | Primary | Maintained | Biggleswade | 945 |
| St Christophers Academy | Primary | Academy | Dunstable | 388 |
| St Leonards CE Academy | Primary | Academy | Leighton Buzzard | 117 |
| St Mary's Catholic Primary School | Primary | Academy | Luton | 229 |
| St Mary's CofE Academy Stotfold | Primary | Academy | Hitchin | 297 |
| St Mary's VA CofE Lower School | Primary | Maintained | Clophill | 134 |
| St Swithun's Church of England VC Primary School | Primary | Maintained | Sandy | 172 |
| St Vincent's Catholic Primary School | Primary | Academy | Dunstable | 213 |
| St. Augustine's Academy | Primary | Academy | Dunstable | 177 |
| Stanbridge Lower School | Primary | Maintained | Leighton Buzzard | 120 |
| Stondon Lower School | Primary | Maintained | Henlow | 136 |
| Stratton School | Secondary | Academy | Biggleswade | 917 |
| Studham Village CofE Academy | Primary | Academy | Studham | 87 |
| Sundon Lower School | Primary | Academy | Luton | 63 |
| Sutton CofE VA Primary School | Primary | Maintained | Sutton | 98 |
| Swallowfield Primary | Primary | Maintained | Milton Keynes | 458 |
| Templefield Lower School | Primary | Maintained | Bedford | 290 |
| The Academy of Central Bedfordshire | Alternative provision | Free school | Houghton Regis | 59 |
| The Chiltern School | Special | Maintained special | Dunstable | 369 |
| The Firs Lower School | Primary | Academy | Bedford | 350 |
| The Mary Bassett Lower School | Primary | Maintained | Leighton Buzzard | 378 |
| The Rushmere Park Academy | Primary | Academy | Leighton Buzzard | 207 |
| The Vale Academy | Primary | Academy | Dunstable | 601 |
| Thomas Whitehead Church of England Academy | Primary | Academy | Dunstable | 206 |
| Thornhill Primary School | Primary | Maintained | Dunstable | 516 |
| Tithe Farm Primary School | Primary | Maintained | Dunstable | 432 |
| Toddington St George Church of England School | Primary | Academy | Dunstable | 341 |
| Totternhoe Church of England Academy | Primary | Academy | Dunstable | 177 |
| Vandyke Upper School | Secondary | Academy | Leighton Buzzard | 1,517 |
| Watling Lower School | Primary | Academy | Dunstable | 190 |
| Weatherfield Academy | Special | Academy | Dunstable | 166 |
| Westfield Nursery School | Nursery | Maintained | Dunstable | 122 |
| Westoning Lower School | Primary | Academy | Bedford | 115 |
| Willow Nursery School | Nursery | Maintained | Dunstable | 83 |
| Woburn Lower School | Primary | Maintained | Woburn | 65 |
| Woodland Middle School Academy | Secondary | Academy | Bedford | 645 |
| Wrestlingworth CofE Infant School | Primary | Maintained | Sandy | 58 |