Westmorland and Furness
147 state-funded schools with 29,937 pupils on roll, in the North West region. Every school’s page has its published figures against Westmorland and Furness and England.
- Primary
- 121
- Secondary
- 19
- All-through
- 1
- Special
- 3
- Alternative provision
- 1
- Nursery
- 2
- Maintained
- 101
- Academies
- 42
- Free schools
- 2
- Maintained special
- 2
Map
Zoom in to see each school. Open the full map
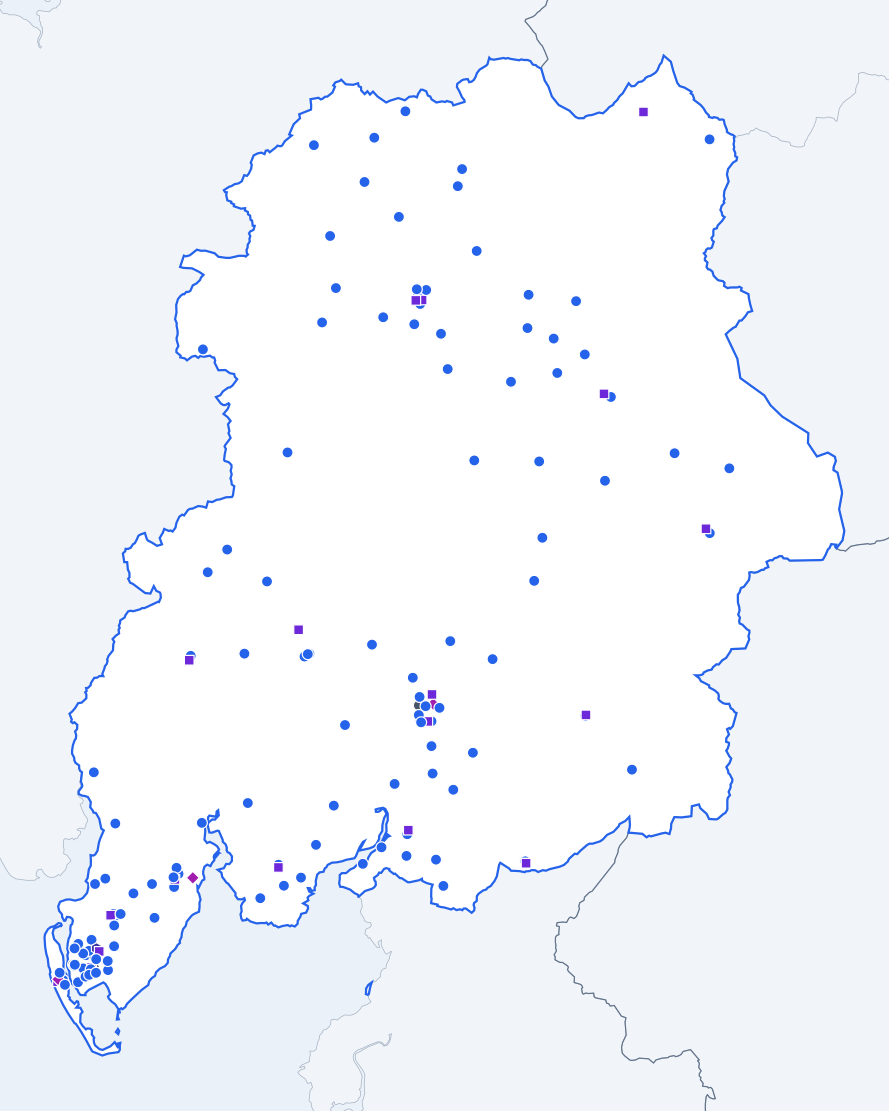
ONS, OS © Crown copyright 2025 · GIAS · © OpenStreetMap
Westmorland and Furness against England
Published figures for the authority’s schools, set against the same kind of school across England.
All state-funded schools
Overall absence
2024/256.3%
- England
- 6.8%
0.5 percentage points lower than England.
Show the figures as a table
| Year | Westmorland and Furness | England |
|---|---|---|
| 2017/18 | Not published | 4.8% |
| 2018/19 | Not published | 4.7% |
| 2020/21 | Not published | 4.6% |
| 2021/22 | Not published | 7.6% |
| 2022/23 | Not published | 7.4% |
| 2023/24 | 6.8% | 7.1% |
| 2024/25 | 6.3% | 6.8% |
Sessions missed for any reason, as a share of all possible sessions in the school year. Source: Department for Education, Explore Education Statistics, Pupil absence in schools in England, 2024/25.
Persistent absence
2024/2515.6%
- England
- 18.1%
2.5 percentage points lower than England.
Show the figures as a table
| Year | Westmorland and Furness | England |
|---|---|---|
| 2017/18 | Not published | 11.2% |
| 2018/19 | Not published | 10.9% |
| 2020/21 | Not published | 12.1% |
| 2021/22 | Not published | 22.5% |
| 2022/23 | Not published | 21.2% |
| 2023/24 | 18.0% | 20.0% |
| 2024/25 | 15.6% | 18.1% |
Pupils who missed 10% or more of their possible sessions, as a share of pupils. Source: Department for Education, Explore Education Statistics, Pupil absence in schools in England, 2024/25.
Severe absence
2024/251.9%
- England
- 2.4%
0.5 percentage points lower than England.
Show the figures as a table
| Year | Westmorland and Furness | England |
|---|---|---|
| 2017/18 | Not published | 0.8% |
| 2018/19 | Not published | 0.8% |
| 2020/21 | Not published | 1.1% |
| 2021/22 | Not published | 1.7% |
| 2022/23 | Not published | 2.0% |
| 2023/24 | 1.8% | 2.3% |
| 2024/25 | 1.9% | 2.4% |
Pupils who missed 50% or more of their possible sessions, as a share of pupils. Source: Department for Education, Explore Education Statistics, Pupil absence in schools in England, 2024/25.
Suspensions per 100 pupils
2024/257.64
- England
- 10.88
3.24 lower than England.
Show the figures as a table
| Year | Westmorland and Furness | England |
|---|---|---|
| 2017/18 | Not published | 5.08 |
| 2018/19 | Not published | 5.36 |
| 2019/20 | Not published | 3.76 |
| 2020/21 | Not published | 4.25 |
| 2021/22 | Not published | 6.91 |
| 2022/23 | Not published | 9.33 |
| 2023/24 | 6.56 | 11.31 |
| 2024/25 | 7.64 | 10.88 |
Suspensions in the school year for every 100 pupils on roll. One pupil can be suspended more than once. Source: Department for Education, Explore Education Statistics, Suspensions and permanent exclusions in England, 2024/25.
Permanent exclusions per 100 pupils
2024/250.11
- England
- 0.12
0.01 lower than England.
Show the figures as a table
| Year | Westmorland and Furness | England |
|---|---|---|
| 2017/18 | Not published | 0.10 |
| 2018/19 | Not published | 0.10 |
| 2019/20 | Not published | 0.06 |
| 2020/21 | Not published | 0.05 |
| 2021/22 | Not published | 0.08 |
| 2022/23 | Not published | 0.11 |
| 2023/24 | 0.06 | 0.13 |
| 2024/25 | 0.11 | 0.12 |
Permanent exclusions in the school year for every 100 pupils on roll. Source: Department for Education, Explore Education Statistics, Suspensions and permanent exclusions in England, 2024/25.
Eligible for free school meals
2024/2515.3%
- England
- 25.7%
10.4 percentage points lower than England.
Show the figures as a table
| Year | Westmorland and Furness | England |
|---|---|---|
| 2021/22 | Not published | 22.5% |
| 2022/23 | Not published | 23.8% |
| 2023/24 | 14.9% | 24.6% |
| 2024/25 | 15.3% | 25.7% |
Pupils known to be eligible for free school meals on census day in January. Source: Department for Education, Explore Education Statistics, Schools, pupils and their characteristics, 2024/25.
SEN support
2024/2514.3%
- England
- 14.0%
0.3 percentage points higher than England.
Show the figures as a table
| Year | Westmorland and Furness | England |
|---|---|---|
| 2021/22 | Not published | 12.4% |
| 2022/23 | Not published | 12.9% |
| 2023/24 | 13.8% | 13.4% |
| 2024/25 | 14.3% | 14.0% |
Pupils receiving special educational needs support without an education, health and care plan. Source: Department for Education, Explore Education Statistics, Schools, pupils and their characteristics, 2024/25.
Education, health and care plan
2024/255.6%
- England
- 5.2%
0.4 percentage points higher than England.
Show the figures as a table
| Year | Westmorland and Furness | England |
|---|---|---|
| 2021/22 | Not published | 3.8% |
| 2022/23 | Not published | 4.2% |
| 2023/24 | 4.9% | 4.7% |
| 2024/25 | 5.6% | 5.2% |
Pupils with an education, health and care plan. Source: Department for Education, Explore Education Statistics, Schools, pupils and their characteristics, 2024/25.
First language other than English
2024/255.0%
- England
- 21.4%
16.4 percentage points lower than England.
Show the figures as a table
| Year | Westmorland and Furness | England |
|---|---|---|
| 2021/22 | Not published | 19.6% |
| 2022/23 | Not published | 20.2% |
| 2023/24 | 4.7% | 20.8% |
| 2024/25 | 5.0% | 21.4% |
Pupils whose first language is known or believed to be other than English. Source: Department for Education, Explore Education Statistics, Schools, pupils and their characteristics, 2024/25.
Pupils per qualified teacher
2025/2616.8
- England
- 18.5
1.7 lower than England.
Show the figures as a table
| Year | Westmorland and Furness | England |
|---|---|---|
| 2017/18 | Not published | 18.4 |
| 2018/19 | Not published | 18.6 |
| 2019/20 | Not published | 18.8 |
| 2020/21 | Not published | 18.5 |
| 2021/22 | Not published | 18.5 |
| 2022/23 | Not published | 18.5 |
| 2023/24 | 16.7 | 18.6 |
| 2024/25 | 16.8 | 18.6 |
| 2025/26 | 16.8 | 18.5 |
Full-time equivalent pupils for each full-time equivalent qualified teacher. Source: Department for Education, Explore Education Statistics, School workforce in England, 2025/26.
Teacher sickness absence
2024/255.1 days
- England
- 5.0 days
0.1 days higher than England.
Show the figures as a table
| Year | Westmorland and Furness | England |
|---|---|---|
| 2017/18 | Not published | 4.0 days |
| 2018/19 | Not published | 4.0 days |
| 2019/20 | Not published | Not published |
| 2020/21 | Not published | 3.9 days |
| 2021/22 | Not published | 6.3 days |
| 2022/23 | 5.1 days | 5.2 days |
| 2023/24 | 6.2 days | 5.3 days |
| 2024/25 | 5.1 days | 5.0 days |
Days lost to sickness absence in the school year, averaged across all teachers. Source: Department for Education, Explore Education Statistics, School workforce in England, 2024/25.
Primary schools
Overall absence
2024/254.4%
- England
- 5.2%
0.8 percentage points lower than England.
Show the figures as a table
| Year | Westmorland and Furness | England |
|---|---|---|
| 2017/18 | Not published | 4.2% |
| 2018/19 | Not published | 4.0% |
| 2020/21 | Not published | 3.6% |
| 2021/22 | Not published | 6.3% |
| 2022/23 | Not published | 5.9% |
| 2023/24 | 5.0% | 5.5% |
| 2024/25 | 4.4% | 5.2% |
Sessions missed for any reason, as a share of all possible sessions in the school year. Source: Department for Education, Explore Education Statistics, Pupil absence in schools in England, 2024/25.
Persistent absence
2024/258.7%
- England
- 13.0%
4.3 percentage points lower than England.
Show the figures as a table
| Year | Westmorland and Furness | England |
|---|---|---|
| 2017/18 | Not published | 8.7% |
| 2018/19 | Not published | 8.2% |
| 2020/21 | Not published | 8.8% |
| 2021/22 | Not published | 17.7% |
| 2022/23 | Not published | 16.2% |
| 2023/24 | 11.3% | 14.6% |
| 2024/25 | 8.7% | 13.0% |
Pupils who missed 10% or more of their possible sessions, as a share of pupils. Source: Department for Education, Explore Education Statistics, Pupil absence in schools in England, 2024/25.
Severe absence
2024/250.3%
- England
- 0.9%
0.6 percentage points lower than England.
Show the figures as a table
| Year | Westmorland and Furness | England |
|---|---|---|
| 2017/18 | Not published | 0.4% |
| 2018/19 | Not published | 0.4% |
| 2020/21 | Not published | 0.7% |
| 2021/22 | Not published | 0.6% |
| 2022/23 | Not published | 0.7% |
| 2023/24 | 0.3% | 0.9% |
| 2024/25 | 0.3% | 0.9% |
Pupils who missed 50% or more of their possible sessions, as a share of pupils. Source: Department for Education, Explore Education Statistics, Pupil absence in schools in England, 2024/25.
Suspensions per 100 pupils
2024/251.04
- England
- 2.47
1.43 lower than England.
Show the figures as a table
| Year | Westmorland and Furness | England |
|---|---|---|
| 2017/18 | Not published | 1.40 |
| 2018/19 | Not published | 1.41 |
| 2019/20 | Not published | 1.00 |
| 2020/21 | Not published | 0.99 |
| 2021/22 | Not published | 1.42 |
| 2022/23 | Not published | 1.81 |
| 2023/24 | 0.93 | 2.27 |
| 2024/25 | 1.04 | 2.47 |
Suspensions in the school year for every 100 pupils on roll. One pupil can be suspended more than once. Source: Department for Education, Explore Education Statistics, Suspensions and permanent exclusions in England, 2024/25.
Permanent exclusions per 100 pupils
2024/250.00
- England
- 0.03
0.03 lower than England.
Show the figures as a table
| Year | Westmorland and Furness | England |
|---|---|---|
| 2017/18 | Not published | 0.03 |
| 2018/19 | Not published | 0.02 |
| 2019/20 | Not published | 0.02 |
| 2020/21 | Not published | 0.01 |
| 2021/22 | Not published | 0.02 |
| 2022/23 | Not published | 0.03 |
| 2023/24 | 0.01 | 0.03 |
| 2024/25 | 0.00 | 0.03 |
Permanent exclusions in the school year for every 100 pupils on roll. Source: Department for Education, Explore Education Statistics, Suspensions and permanent exclusions in England, 2024/25.
Reading, writing and maths: expected standard
2025/26 (provisional)59%
- England
- 63%
4 percentage points lower than England.
Show the figures as a table
| Year | Westmorland and Furness | England |
|---|---|---|
| 2021/22 | Not published | 59% |
| 2022/23 | 60% | 60% |
| 2023/24 | 58% | 61% |
| 2024/25 | 58% | 63% |
| 2025/26 (provisional) | 59% | 63% |
Pupils at the end of key stage 2 who met the expected standard in reading, writing and maths combined. Source: Department for Education, Explore Education Statistics, Key stage 2 attainment, 2025/26.
Reading, writing and maths: higher standard
2025/26 (provisional)5%
- England
- 9%
4 percentage points lower than England.
Show the figures as a table
| Year | Westmorland and Furness | England |
|---|---|---|
| 2021/22 | Not published | 7% |
| 2022/23 | 8% | 8% |
| 2023/24 | 6% | 8% |
| 2024/25 | 6% | 8% |
| 2025/26 (provisional) | 5% | 9% |
Pupils at the end of key stage 2 who met the higher standard in reading, writing and maths combined. Source: Department for Education, Explore Education Statistics, Key stage 2 attainment, 2025/26.
Eligible for free school meals
2024/2514.3%
- England
- 24.7%
10.4 percentage points lower than England.
Show the figures as a table
| Year | Westmorland and Furness | England |
|---|---|---|
| 2021/22 | Not published | 23.1% |
| 2022/23 | Not published | 24.0% |
| 2023/24 | 14.7% | 24.3% |
| 2024/25 | 14.3% | 24.7% |
Pupils known to be eligible for free school meals on census day in January. Source: Department for Education, Explore Education Statistics, Schools, pupils and their characteristics, 2024/25.
SEN support
2024/2513.1%
- England
- 15.0%
1.9 percentage points lower than England.
Show the figures as a table
| Year | Westmorland and Furness | England |
|---|---|---|
| 2021/22 | Not published | 13.0% |
| 2022/23 | Not published | 13.5% |
| 2023/24 | 13.9% | 14.1% |
| 2024/25 | 13.1% | 15.0% |
Pupils receiving special educational needs support without an education, health and care plan. Source: Department for Education, Explore Education Statistics, Schools, pupils and their characteristics, 2024/25.
Education, health and care plan
2024/254.6%
- England
- 3.5%
1.1 percentage points higher than England.
Show the figures as a table
| Year | Westmorland and Furness | England |
|---|---|---|
| 2021/22 | Not published | 2.3% |
| 2022/23 | Not published | 2.5% |
| 2023/24 | 4.0% | 3.0% |
| 2024/25 | 4.6% | 3.5% |
Pupils with an education, health and care plan. Source: Department for Education, Explore Education Statistics, Schools, pupils and their characteristics, 2024/25.
First language other than English
2024/255.5%
- England
- 23.4%
17.9 percentage points lower than England.
Show the figures as a table
| Year | Westmorland and Furness | England |
|---|---|---|
| 2021/22 | Not published | 21.2% |
| 2022/23 | Not published | 22.0% |
| 2023/24 | 4.9% | 22.8% |
| 2024/25 | 5.5% | 23.4% |
Pupils whose first language is known or believed to be other than English. Source: Department for Education, Explore Education Statistics, Schools, pupils and their characteristics, 2024/25.
Pupils per qualified teacher
2025/2619.1
- England
- 21.2
2.1 lower than England.
Show the figures as a table
| Year | Westmorland and Furness | England |
|---|---|---|
| 2017/18 | Not published | 21.3 |
| 2018/19 | Not published | 21.4 |
| 2019/20 | Not published | 21.4 |
| 2020/21 | Not published | 21.1 |
| 2021/22 | Not published | 21.0 |
| 2022/23 | Not published | 21.1 |
| 2023/24 | 18.7 | 21.2 |
| 2024/25 | 18.7 | 21.3 |
| 2025/26 | 19.1 | 21.2 |
Full-time equivalent pupils for each full-time equivalent qualified teacher. Source: Department for Education, Explore Education Statistics, School workforce in England, 2025/26.
Secondary schools
Overall absence
2024/258.2%
- England
- 8.4%
0.2 percentage points lower than England.
Show the figures as a table
| Year | Westmorland and Furness | England |
|---|---|---|
| 2017/18 | Not published | 5.5% |
| 2018/19 | Not published | 5.5% |
| 2020/21 | Not published | 5.5% |
| 2021/22 | Not published | 9.0% |
| 2022/23 | Not published | 9.0% |
| 2023/24 | 8.7% | 8.9% |
| 2024/25 | 8.2% | 8.4% |
Sessions missed for any reason, as a share of all possible sessions in the school year. Source: Department for Education, Explore Education Statistics, Pupil absence in schools in England, 2024/25.
Persistent absence
2024/2522.1%
- England
- 23.4%
1.3 percentage points lower than England.
Show the figures as a table
| Year | Westmorland and Furness | England |
|---|---|---|
| 2017/18 | Not published | 13.9% |
| 2018/19 | Not published | 13.7% |
| 2020/21 | Not published | 14.8% |
| 2021/22 | Not published | 27.7% |
| 2022/23 | Not published | 26.5% |
| 2023/24 | 24.6% | 25.6% |
| 2024/25 | 22.1% | 23.4% |
Pupils who missed 10% or more of their possible sessions, as a share of pupils. Source: Department for Education, Explore Education Statistics, Pupil absence in schools in England, 2024/25.
Severe absence
2024/253.4%
- England
- 3.9%
0.5 percentage points lower than England.
Show the figures as a table
| Year | Westmorland and Furness | England |
|---|---|---|
| 2017/18 | Not published | 1.2% |
| 2018/19 | Not published | 1.3% |
| 2020/21 | Not published | 1.5% |
| 2021/22 | Not published | 2.7% |
| 2022/23 | Not published | 3.4% |
| 2023/24 | 3.3% | 3.8% |
| 2024/25 | 3.4% | 3.9% |
Pupils who missed 50% or more of their possible sessions, as a share of pupils. Source: Department for Education, Explore Education Statistics, Pupil absence in schools in England, 2024/25.
Suspensions per 100 pupils
2024/2515.34
- England
- 21.24
5.90 lower than England.
Show the figures as a table
| Year | Westmorland and Furness | England |
|---|---|---|
| 2017/18 | Not published | 10.13 |
| 2018/19 | Not published | 10.75 |
| 2019/20 | Not published | 7.43 |
| 2020/21 | Not published | 8.48 |
| 2021/22 | Not published | 13.96 |
| 2022/23 | Not published | 18.90 |
| 2023/24 | 13.18 | 22.61 |
| 2024/25 | 15.34 | 21.24 |
Suspensions in the school year for every 100 pupils on roll. One pupil can be suspended more than once. Source: Department for Education, Explore Education Statistics, Suspensions and permanent exclusions in England, 2024/25.
Permanent exclusions per 100 pupils
2024/250.23
- England
- 0.23
The same as England.
Show the figures as a table
| Year | Westmorland and Furness | England |
|---|---|---|
| 2017/18 | Not published | 0.20 |
| 2018/19 | Not published | 0.20 |
| 2019/20 | Not published | 0.13 |
| 2020/21 | Not published | 0.10 |
| 2021/22 | Not published | 0.16 |
| 2022/23 | Not published | 0.22 |
| 2023/24 | 0.11 | 0.25 |
| 2024/25 | 0.23 | 0.23 |
Permanent exclusions in the school year for every 100 pupils on roll. Source: Department for Education, Explore Education Statistics, Suspensions and permanent exclusions in England, 2024/25.
Attainment 8
2025/26 (provisional)45.5
- England
- 47.4
1.9 lower than England.
Show the figures as a table
| Year | Westmorland and Furness | England |
|---|---|---|
| 2021/22 | Not published | 49.8 |
| 2022/23 | 46.8 | 47.2 |
| 2023/24 | 46.3 | 46.9 |
| 2024/25 | 45.7 | 47.1 |
| 2025/26 (provisional) | 45.5 | 47.4 |
The average of pupils' points across eight GCSE-level qualifications, with English and maths counted twice. Source: Department for Education, Explore Education Statistics, Key stage 4 performance, 2025/26.
English and maths: grade 4 or above
2025/26 (provisional)64%
- England
- 66%
2 percentage points lower than England.
Show the figures as a table
| Year | Westmorland and Furness | England |
|---|---|---|
| 2021/22 | Not published | 70% |
| 2022/23 | 67% | 67% |
| 2023/24 | 67% | 67% |
| 2024/25 | 63% | 66% |
| 2025/26 (provisional) | 64% | 66% |
Pupils at the end of key stage 4 with grade 4 or above in both English and maths. Source: Department for Education, Explore Education Statistics, Key stage 4 performance, 2025/26.
English and maths: grade 5 or above
2025/26 (provisional)43%
- England
- 48%
5 percentage points lower than England.
Show the figures as a table
| Year | Westmorland and Furness | England |
|---|---|---|
| 2021/22 | Not published | 51% |
| 2022/23 | 43% | 46% |
| 2023/24 | 44% | 47% |
| 2024/25 | 43% | 47% |
| 2025/26 (provisional) | 43% | 48% |
Pupils at the end of key stage 4 with grade 5 or above in both English and maths. Source: Department for Education, Explore Education Statistics, Key stage 4 performance, 2025/26.
Eligible for free school meals
2024/2515.9%
- England
- 25.8%
9.9 percentage points lower than England.
Show the figures as a table
| Year | Westmorland and Furness | England |
|---|---|---|
| 2021/22 | Not published | 20.9% |
| 2022/23 | Not published | 22.7% |
| 2023/24 | 14.6% | 24.1% |
| 2024/25 | 15.9% | 25.8% |
Pupils known to be eligible for free school meals on census day in January. Source: Department for Education, Explore Education Statistics, Schools, pupils and their characteristics, 2024/25.
SEN support
2024/2515.9%
- England
- 13.4%
2.5 percentage points higher than England.
Show the figures as a table
| Year | Westmorland and Furness | England |
|---|---|---|
| 2021/22 | Not published | 11.9% |
| 2022/23 | Not published | 12.4% |
| 2023/24 | 13.8% | 12.9% |
| 2024/25 | 15.9% | 13.4% |
Pupils receiving special educational needs support without an education, health and care plan. Source: Department for Education, Explore Education Statistics, Schools, pupils and their characteristics, 2024/25.
Education, health and care plan
2024/254.4%
- England
- 3.1%
1.3 percentage points higher than England.
Show the figures as a table
| Year | Westmorland and Furness | England |
|---|---|---|
| 2021/22 | Not published | 2.2% |
| 2022/23 | Not published | 2.4% |
| 2023/24 | 3.9% | 2.7% |
| 2024/25 | 4.4% | 3.1% |
Pupils with an education, health and care plan. Source: Department for Education, Explore Education Statistics, Schools, pupils and their characteristics, 2024/25.
First language other than English
2024/254.5%
- England
- 19.2%
14.7 percentage points lower than England.
Show the figures as a table
| Year | Westmorland and Furness | England |
|---|---|---|
| 2021/22 | Not published | 17.5% |
| 2022/23 | Not published | 18.1% |
| 2023/24 | 4.4% | 18.6% |
| 2024/25 | 4.5% | 19.2% |
Pupils whose first language is known or believed to be other than English. Source: Department for Education, Explore Education Statistics, Schools, pupils and their characteristics, 2024/25.
Pupils per qualified teacher
2025/2615.5
- England
- 17.3
1.8 lower than England.
Show the figures as a table
| Year | Westmorland and Furness | England |
|---|---|---|
| 2017/18 | Not published | 16.5 |
| 2018/19 | Not published | 16.8 |
| 2019/20 | Not published | 17.2 |
| 2020/21 | Not published | 17.1 |
| 2021/22 | Not published | 17.1 |
| 2022/23 | Not published | 17.2 |
| 2023/24 | 15.6 | 17.4 |
| 2024/25 | 15.8 | 17.3 |
| 2025/26 | 15.5 | 17.3 |
Full-time equivalent pupils for each full-time equivalent qualified teacher. Source: Department for Education, Explore Education Statistics, School workforce in England, 2025/26.
Special schools
Overall absence
2024/2510.4%
- England
- 12.8%
2.4 percentage points lower than England.
Show the figures as a table
| Year | Westmorland and Furness | England |
|---|---|---|
| 2017/18 | Not published | 10.2% |
| 2018/19 | Not published | 10.1% |
| 2020/21 | Not published | 15.2% |
| 2021/22 | Not published | 13.2% |
| 2022/23 | Not published | 13.0% |
| 2023/24 | 11.2% | 13.0% |
| 2024/25 | 10.4% | 12.8% |
Sessions missed for any reason, as a share of all possible sessions in the school year. Source: Department for Education, Explore Education Statistics, Pupil absence in schools in England, 2024/25.
Persistent absence
2024/2530.6%
- England
- 35.3%
4.7 percentage points lower than England.
Show the figures as a table
| Year | Westmorland and Furness | England |
|---|---|---|
| 2017/18 | Not published | 29.6% |
| 2018/19 | Not published | 28.8% |
| 2020/21 | Not published | 48.9% |
| 2021/22 | Not published | 40.4% |
| 2022/23 | Not published | 38.3% |
| 2023/24 | 33.2% | 37.2% |
| 2024/25 | 30.6% | 35.3% |
Pupils who missed 10% or more of their possible sessions, as a share of pupils. Source: Department for Education, Explore Education Statistics, Pupil absence in schools in England, 2024/25.
Severe absence
2024/253.8%
- England
- 6.9%
3.1 percentage points lower than England.
Show the figures as a table
| Year | Westmorland and Furness | England |
|---|---|---|
| 2017/18 | Not published | 4.4% |
| 2018/19 | Not published | 4.6% |
| 2020/21 | Not published | 5.6% |
| 2021/22 | Not published | 5.8% |
| 2022/23 | Not published | 6.2% |
| 2023/24 | 4.1% | 6.7% |
| 2024/25 | 3.8% | 6.9% |
Pupils who missed 50% or more of their possible sessions, as a share of pupils. Source: Department for Education, Explore Education Statistics, Pupil absence in schools in England, 2024/25.
Suspensions per 100 pupils
2024/250.00
- England
- 12.32
12.32 lower than England.
Show the figures as a table
| Year | Westmorland and Furness | England |
|---|---|---|
| 2017/18 | Not published | 12.34 |
| 2018/19 | Not published | 11.32 |
| 2019/20 | Not published | 7.76 |
| 2020/21 | Not published | 7.29 |
| 2021/22 | Not published | 9.60 |
| 2022/23 | Not published | 10.99 |
| 2023/24 | 0.00 | 12.62 |
| 2024/25 | 0.00 | 12.32 |
Suspensions in the school year for every 100 pupils on roll. One pupil can be suspended more than once. Source: Department for Education, Explore Education Statistics, Suspensions and permanent exclusions in England, 2024/25.
Permanent exclusions per 100 pupils
2024/250.00
- England
- 0.08
0.08 lower than England.
Show the figures as a table
| Year | Westmorland and Furness | England |
|---|---|---|
| 2017/18 | Not published | 0.07 |
| 2018/19 | Not published | 0.06 |
| 2019/20 | Not published | 0.04 |
| 2020/21 | Not published | 0.03 |
| 2021/22 | Not published | 0.05 |
| 2022/23 | Not published | 0.08 |
| 2023/24 | 0.00 | 0.08 |
| 2024/25 | 0.00 | 0.08 |
Permanent exclusions in the school year for every 100 pupils on roll. Source: Department for Education, Explore Education Statistics, Suspensions and permanent exclusions in England, 2024/25.
Eligible for free school meals
2024/2539.7%
- England
- 48.8%
9.1 percentage points lower than England.
Show the figures as a table
| Year | Westmorland and Furness | England |
|---|---|---|
| 2021/22 | Not published | 44.4% |
| 2022/23 | Not published | 45.6% |
| 2023/24 | 40.9% | 47.1% |
| 2024/25 | 39.7% | 48.8% |
Pupils known to be eligible for free school meals on census day in January. Source: Department for Education, Explore Education Statistics, Schools, pupils and their characteristics, 2024/25.
SEN support
2024/250.3%
- England
- 0.5%
0.2 percentage points lower than England.
Show the figures as a table
| Year | Westmorland and Furness | England |
|---|---|---|
| 2021/22 | Not published | 0.9% |
| 2022/23 | Not published | 0.8% |
| 2023/24 | 1.7% | 0.7% |
| 2024/25 | 0.3% | 0.5% |
Pupils receiving special educational needs support without an education, health and care plan. Source: Department for Education, Explore Education Statistics, Schools, pupils and their characteristics, 2024/25.
Education, health and care plan
2024/2599.7%
- England
- 99.5%
0.2 percentage points higher than England.
Show the figures as a table
| Year | Westmorland and Furness | England |
|---|---|---|
| 2021/22 | Not published | 99.1% |
| 2022/23 | Not published | 99.2% |
| 2023/24 | 98.3% | 99.3% |
| 2024/25 | 99.7% | 99.5% |
Pupils with an education, health and care plan. Source: Department for Education, Explore Education Statistics, Schools, pupils and their characteristics, 2024/25.
First language other than English
2024/252.6%
- England
- 14.4%
11.8 percentage points lower than England.
Show the figures as a table
| Year | Westmorland and Furness | England |
|---|---|---|
| 2021/22 | Not published | 14.5% |
| 2022/23 | Not published | 14.4% |
| 2023/24 | 2.0% | 14.4% |
| 2024/25 | 2.6% | 14.4% |
Pupils whose first language is known or believed to be other than English. Source: Department for Education, Explore Education Statistics, Schools, pupils and their characteristics, 2024/25.
Pupils per qualified teacher
2025/265.9
- England
- 7.3
1.4 lower than England.
Show the figures as a table
| Year | Westmorland and Furness | England |
|---|---|---|
| 2017/18 | Not published | 6.7 |
| 2018/19 | Not published | 6.8 |
| 2019/20 | Not published | 7.0 |
| 2020/21 | Not published | 6.8 |
| 2021/22 | Not published | 6.9 |
| 2022/23 | Not published | 7.0 |
| 2023/24 | 5.7 | 7.1 |
| 2024/25 | 5.6 | 7.3 |
| 2025/26 | 5.9 | 7.3 |
Full-time equivalent pupils for each full-time equivalent qualified teacher. Source: Department for Education, Explore Education Statistics, School workforce in England, 2025/26.
Schools in Westmorland and Furness
Listed by name. Filter by phase or type; sort by name or size. Nothing here is sorted by results.
Showing 147 of 147 schools in Westmorland and Furness.
| School | Phase | Type | Town | Pupils |
|---|---|---|---|---|
| Allithwaite CofE Primary School | Primary | Maintained | Grange-over-Sands | 109 |
| Alston Primary School | Primary | Maintained | Alston | 88 |
| Ambleside CofE Primary School | Primary | Academy | Ambleside | 52 |
| Appleby Grammar School | Secondary | Academy | Appleby-in-Westmorland | 357 |
| Appleby Primary School | Primary | Maintained | Appleby-in-Westmorland | 163 |
| Armathwaite School | Primary | Maintained | Carlisle | 64 |
| Arnside National CofE School | Primary | Academy | Carnforth | 95 |
| Asby Endowed School | Primary | Maintained | Appleby-in-Westmorland | 20 |
| Askam Village School | Primary | Maintained | Askam-in-furness | 187 |
| Barrow Island Community Primary School | Primary | Maintained | Barrow-in-Furness | 162 |
| Beaconside CofE Primary School | Primary | Maintained | Penrith | 445 |
| Beetham CofE Primary School | Primary | Maintained | Milnthorpe | 51 |
| Bolton Primary School | Primary | Maintained | Appleby-in-Westmorland | 56 |
| Brisbane Park Infant School | Primary | Maintained | Barrow-in-Furness | 95 |
| Brough Community Primary School | Primary | Maintained | Brough | 73 |
| Broughton CofE Primary and Nursery School | Primary | Maintained | Broughton-in-Furness | 129 |
| Brunswick School | Primary | Maintained | Penrith | 140 |
| Burlington CofE School | Primary | Maintained | Kirkby-in-Furness | 76 |
| Burton Morewood CofE Primary School | Primary | Academy | Carnforth | 165 |
| Calthwaite CofE School | Primary | Maintained | Penrith | 69 |
| Cambridge Primary School | Primary | Academy | Barrow-in-Furness | 230 |
| Cartmel CofE Primary School | Primary | Maintained | Grange-over-Sands | 47 |
| Cartmel Priory CofE School | Secondary | Academy | Grange-over-Sands | 371 |
| Castle Park School | Primary | Academy | Kendal | 326 |
| Chapel Street Infants and Nursery School | Primary | Maintained | Dalton-in-Furness | 81 |
| Chetwynde School | All-through | Free school | Barrow-in-Furness | 508 |
| Church Walk CofE Primary School | Primary | Maintained | Ulverston | 88 |
| Clifton Primary School | Primary | Maintained | Penrith | 76 |
| Coniston CofE Primary School | Primary | Maintained | Coniston | 67 |
| Croftlands Infant School | Primary | Maintained | Ulverston | 119 |
| Croftlands Junior School | Primary | Maintained | Ulverston | 152 |
| Crosby Ravensworth CofE School | Primary | Maintained | Penrith | 42 |
| Crosscrake CofE Primary School | Primary | Maintained | Kendal | 55 |
| Crosthwaite CofE School | Primary | Maintained | Kendal | 109 |
| Culgaith CofE School | Primary | Maintained | Penrith | 56 |
| Dallam School | Secondary | Academy | Cumbria | 761 |
| Dalton St Mary's CofE Primary School | Primary | Maintained | Dalton-in-Furness | 211 |
| Dane Ghyll Community Primary School and Nursery | Primary | Maintained | Barrow in Furness | 267 |
| Dean Barwick Primary School | Primary | Maintained | Grange-over-Sands | 51 |
| Dean Gibson Catholic Primary School, Kendal | Primary | Academy | Kendal | 134 |
| Dent CofE Voluntary Aided Primary School | Primary | Maintained | Sedbergh | 30 |
| Dowdales School | Secondary | Maintained | Dalton-in-Furness | 877 |
| Flookburgh CofE Primary School | Primary | Maintained | Grange-Over-Sands | 58 |
| Furness Academy | Secondary | Academy | Barrow-in-Furness | 1,187 |
| George Hastwell School Special Academy | Special | Academy | Barrow-in-Furness | 99 |
| George Romney Junior School | Primary | Maintained | Dalton-in-Furness | 75 |
| Ghyllside Primary School | Primary | Academy | Kendal | 424 |
| Goodly Dale Primary School | Primary | Maintained | Windermere | 77 |
| Grange CofE Primary School | Primary | Maintained | Grange-over-Sands | 192 |
| Grasmere CofE Primary School | Primary | Maintained | Ambleside | 89 |
| Grayrigg CofE School | Primary | Maintained | Kendal | 67 |
| Greengate Junior School | Primary | Maintained | Barrow-in-Furness | 161 |
| Greystoke Primary School | Primary | Maintained | Penrith | 51 |
| Hawkshead Esthwaite Primary School | Primary | Maintained | Hawkshead | 30 |
| Heron Hill Primary School | Primary | Maintained | Kendal | 419 |
| High Hesket CofE School | Primary | Maintained | Carlisle | 136 |
| Hindpool Nursery School | Nursery | Maintained | Barrow-in-Furness | 79 |
| Holme Primary School | Primary | Maintained | Carnforth | 122 |
| Holy Family Catholic Primary School | Primary | Maintained | Barrow-in-Furness | 217 |
| Ireleth St Peter's CofE Primary School | Primary | Maintained | Askam-in-Furness | 76 |
| Ivegill CofE School | Primary | Maintained | Carlisle | 75 |
| John Ruskin School | Secondary | Maintained | Coniston | 247 |
| Kendal Nursery School | Nursery | Maintained | Kendal | 118 |
| Kirkbie Kendal School | Secondary | Academy | Kendal | 1,029 |
| Kirkby Stephen Grammar School | Secondary | Academy | Kirkby Stephen | 377 |
| Kirkby Stephen Primary School | Primary | Maintained | Kirkby Stephen | 189 |
| Kirkby Thore School | Primary | Academy | Penrith | 33 |
| Kirkoswald CofE School | Primary | Maintained | Penrith | 48 |
| Langdale CofE School | Primary | Maintained | Ambleside | 31 |
| Langwathby CofE Primary School | Primary | Maintained | Penrith | 169 |
| Lazonby C of E Primary School | Primary | Academy | Penrith | 112 |
| Leven Valley CofE Primary School | Primary | Maintained | ULVERSTON | 68 |
| Levens CofE School | Primary | Maintained | Kendal | 98 |
| Lindal and Marton Primary School | Primary | Academy | Ulverston | 78 |
| Lindale CofE Primary School | Primary | Maintained | Grange Over Sands | 47 |
| Long Marton School | Primary | Maintained | Appleby-in-Westmorland | 81 |
| Low Furness CofE Primary School | Primary | Maintained | Ulverston | 127 |
| Lowther Endowed School | Primary | Maintained | Penrith | 34 |
| Milburn School | Primary | Maintained | Penrith | 19 |
| Milnthorpe Primary School | Primary | Maintained | Milnthorpe | 176 |
| Morland Area CofE Primary School | Primary | Maintained | Penrith | 119 |
| Nenthead Primary School | Primary | Maintained | Alston | 17 |
| Newbarns Primary and Nursery School | Primary | Academy | Barrow-in-Furness | 444 |
| Newton Village Academy | Primary | Academy | Barrow-in-Furness | 79 |
| North Lakes School | Primary | Maintained | Penrith | 161 |
| Old Hutton CofE School | Primary | Maintained | Kendal | 78 |
| Ormsgill Nursery and Primary School | Primary | Academy | Barrow-in-Furness | 156 |
| Orton CofE School | Primary | Maintained | Penrith | 47 |
| Our Lady of the Rosary Catholic Primary School, Dalton-In-Furness | Primary | Academy | Dalton-in-Furness | 101 |
| Parkside Academy | Primary | Academy | BARROW-in-FURNESS | 272 |
| Patterdale CofE Primary School | Primary | Maintained | Penrith | 23 |
| Pennington CofE School | Primary | Maintained | Ulverston | 211 |
| Penny Bridge CofE School | Primary | Academy | Ulverston | 123 |
| Penruddock Primary School | Primary | Maintained | Penrith | 48 |
| Plumpton School | Primary | Maintained | PENRITH | 102 |
| Queen Elizabeth Grammar School Penrith | Secondary | Academy | Penrith | 1,026 |
| Queen Elizabeth School | Secondary | Academy | 1,155 | |
| Queen Elizabeth Studio School | Secondary | Free school | 329 | |
| Ramsden Infant School | Primary | Maintained | Barrow-in-Furness | 80 |
| Roose School | Primary | Maintained | Barrow-in-Furness | 196 |
| Sacred Heart Catholic Primary School, Barrow | Primary | Academy | Barrow-in-Furness | 202 |
| Samuel King's School | Secondary | Maintained | Alston | 113 |
| Sandgate School | Special | Maintained special | Kendal | 166 |
| Sandside Lodge School | Special | Maintained special | Ulverston | 104 |
| Sedbergh Primary School | Primary | Maintained | Sedbergh | 168 |
| Selside Endowed CofE Primary School | Primary | Maintained | Kendal | 33 |
| Settlebeck School | Secondary | Academy | Sedbergh | 203 |
| Shap Endowed CofE Primary School | Primary | Maintained | Penrith | 88 |
| Sir John Barrow School | Primary | Maintained | Ulverston | 235 |
| Skelton School | Primary | Maintained | Penrith | 87 |
| South Cumbria Pupil Referral Service | Alternative provision | Maintained | Barrow-in-Furness | 31 |
| South Walney Infant and Nursery School | Primary | Maintained | Barrow-in-Furness | 134 |
| South Walney Junior School | Primary | Academy | Barrow-in-Furness | 209 |
| St Bernards Catholic High School, Barrow | Secondary | Academy | Barrow-in-Furness | 624 |
| St Catherine's Catholic Primary School, Penrith | Primary | Academy | PENRITH | 104 |
| St Columba's School | Primary | Maintained | Barrow-in-Furness | 212 |
| St Cuthberts Catholic Primary School, Windermere | Primary | Academy | Windermere | 40 |
| St George's CofE School | Primary | Maintained | Barrow-in-Furness | 226 |
| St James' CofE Junior School | Primary | Maintained | Barrow-in-Furness | 115 |
| St Mark's CofE Primary School | Primary | Maintained | Natland, Kendal | 184 |
| St Martin & St Mary Church of England Primary School | Primary | Maintained | Windermere | 336 |
| St Mary's Catholic Primary School, Ulverston | Primary | Academy | Ulverston | 155 |
| St Mary's CofE Primary School | Primary | Maintained | Carnforth | 220 |
| St Oswald's CofE Primary School | Primary | Maintained | Kendal | 88 |
| St Patrick's CofE School | Primary | Maintained | Kendal | 92 |
| St Paul's CofE Junior School | Primary | Maintained | Barrow-in-Furness | 71 |
| St Pius X Catholic Primary School, Barrow | Primary | Academy | Barrow-in-Furness | 210 |
| St Thomas's CofE Primary School | Primary | Maintained | Kendal | 239 |
| Stainton CofE Primary School | Primary | Maintained | Penrith | 112 |
| Staveley CofE School | Primary | Maintained | Kendal | 79 |
| Storth CofE School | Primary | Maintained | Milnthorpe | 88 |
| Stramongate Primary School | Primary | Academy | Kendal | 237 |
| Tebay Primary School | Primary | Academy | Penrith | 49 |
| Temple Sowerby CofE Primary School | Primary | Maintained | Penrith | 49 |
| The Lakes School | Secondary | Maintained | Windermere | 445 |
| The Queen Katherine School | Secondary | Academy | Kendal | 910 |
| Threlkeld CofE Primary School | Primary | Academy | Keswick | 41 |
| Ullswater Community College | Secondary | Maintained | Penrith | 1,520 |
| Ulverston Victoria High School | Secondary | Maintained | Ulverston | 1,319 |
| Vicarage Park CofE Primary School | Primary | Maintained | Kendal | 109 |
| Vickerstown School | Primary | Academy | Barrow-in-Furness | 156 |
| Victoria Academy | Primary | Academy | Barrow-in-Furness | 209 |
| Victoria Infant and Nursery School | Primary | Maintained | Barrow-in-Furness | 228 |
| Walney Academy | Secondary | Academy | Barrow-in-Furness | 468 |
| Warcop CofE Primary School | Primary | Maintained | Appleby-in-Westmorland | 85 |
| Yanwath Primary School | Primary | Academy | Penrith | 166 |
| Yarlside Academy | Primary | Academy | Barrow-in-Furness | 242 |