West Northamptonshire
188 state-funded schools with 67,598 pupils on roll, in the East Midlands region. Every school’s page has its published figures against West Northamptonshire and England.
- Primary
- 147
- Secondary
- 19
- All-through
- 5
- Special
- 9
- Alternative provision
- 3
- Nursery
- 5
- Academies
- 110
- Maintained
- 63
- Free schools
- 14
- Maintained special
- 1
Map
Zoom in to see each school. Open the full map
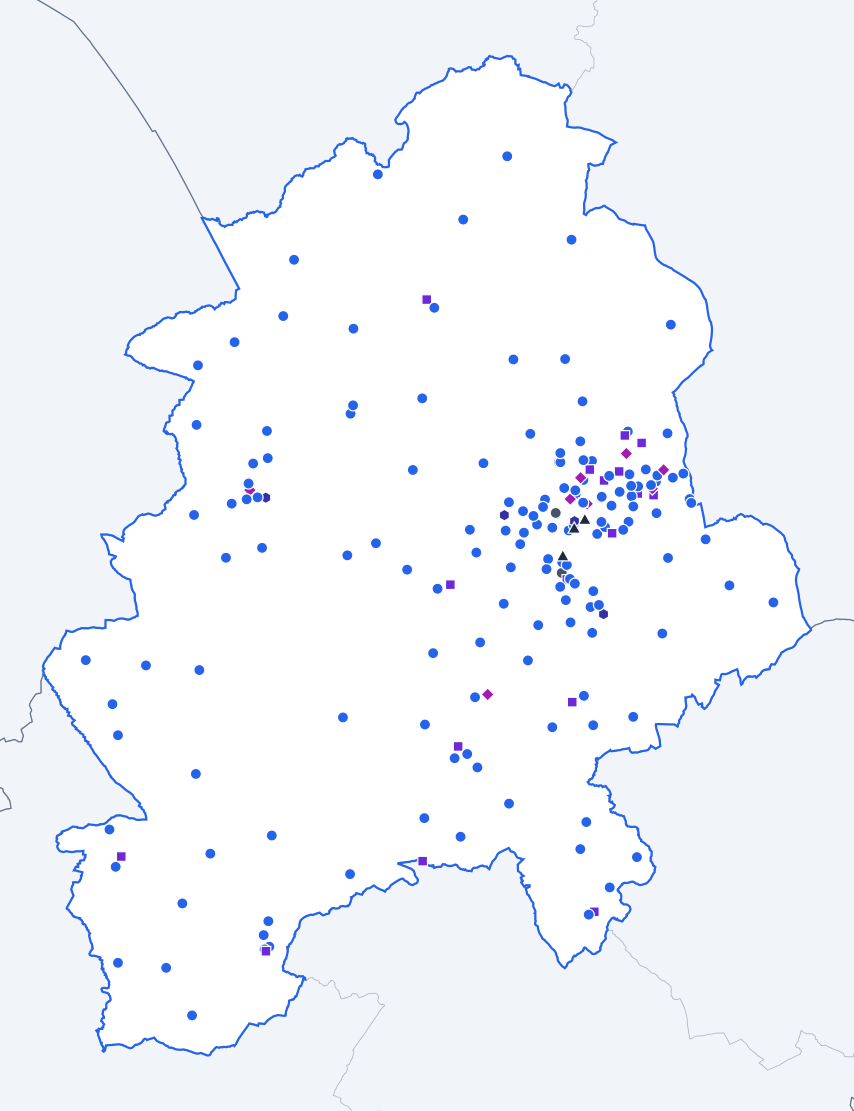
ONS, OS © Crown copyright 2025 · GIAS · © OpenStreetMap
West Northamptonshire against England
Published figures for the authority’s schools, set against the same kind of school across England.
All state-funded schools
Overall absence
2024/256.5%
- England
- 6.8%
0.3 percentage points lower than England.
Show the figures as a table
| Year | West Northamptonshire | England |
|---|---|---|
| 2017/18 | Not published | 4.8% |
| 2018/19 | Not published | 4.7% |
| 2020/21 | Not published | 4.6% |
| 2021/22 | 7.3% | 7.6% |
| 2022/23 | 7.0% | 7.4% |
| 2023/24 | 6.8% | 7.1% |
| 2024/25 | 6.5% | 6.8% |
Sessions missed for any reason, as a share of all possible sessions in the school year. Source: Department for Education, Explore Education Statistics, Pupil absence in schools in England, 2024/25.
Persistent absence
2024/2516.5%
- England
- 18.1%
1.6 percentage points lower than England.
Show the figures as a table
| Year | West Northamptonshire | England |
|---|---|---|
| 2017/18 | Not published | 11.2% |
| 2018/19 | Not published | 10.9% |
| 2020/21 | Not published | 12.1% |
| 2021/22 | 20.6% | 22.5% |
| 2022/23 | 19.2% | 21.2% |
| 2023/24 | 18.2% | 20.0% |
| 2024/25 | 16.5% | 18.1% |
Pupils who missed 10% or more of their possible sessions, as a share of pupils. Source: Department for Education, Explore Education Statistics, Pupil absence in schools in England, 2024/25.
Severe absence
2024/252.5%
- England
- 2.4%
0.1 percentage points higher than England.
Show the figures as a table
| Year | West Northamptonshire | England |
|---|---|---|
| 2017/18 | Not published | 0.8% |
| 2018/19 | Not published | 0.8% |
| 2020/21 | Not published | 1.1% |
| 2021/22 | 1.7% | 1.7% |
| 2022/23 | 2.1% | 2.0% |
| 2023/24 | 2.4% | 2.3% |
| 2024/25 | 2.5% | 2.4% |
Pupils who missed 50% or more of their possible sessions, as a share of pupils. Source: Department for Education, Explore Education Statistics, Pupil absence in schools in England, 2024/25.
Suspensions per 100 pupils
2024/2511.71
- England
- 10.88
0.83 higher than England.
Show the figures as a table
| Year | West Northamptonshire | England |
|---|---|---|
| 2017/18 | Not published | 5.08 |
| 2018/19 | Not published | 5.36 |
| 2019/20 | Not published | 3.76 |
| 2020/21 | Not published | 4.25 |
| 2021/22 | 7.14 | 6.91 |
| 2022/23 | 9.21 | 9.33 |
| 2023/24 | 10.63 | 11.31 |
| 2024/25 | 11.71 | 10.88 |
Suspensions in the school year for every 100 pupils on roll. One pupil can be suspended more than once. Source: Department for Education, Explore Education Statistics, Suspensions and permanent exclusions in England, 2024/25.
Permanent exclusions per 100 pupils
2024/250.10
- England
- 0.12
0.02 lower than England.
Show the figures as a table
| Year | West Northamptonshire | England |
|---|---|---|
| 2017/18 | Not published | 0.10 |
| 2018/19 | Not published | 0.10 |
| 2019/20 | Not published | 0.06 |
| 2020/21 | Not published | 0.05 |
| 2021/22 | 0.06 | 0.08 |
| 2022/23 | 0.12 | 0.11 |
| 2023/24 | 0.08 | 0.13 |
| 2024/25 | 0.10 | 0.12 |
Permanent exclusions in the school year for every 100 pupils on roll. Source: Department for Education, Explore Education Statistics, Suspensions and permanent exclusions in England, 2024/25.
Eligible for free school meals
2024/2517.3%
- England
- 25.7%
8.4 percentage points lower than England.
Show the figures as a table
| Year | West Northamptonshire | England |
|---|---|---|
| 2021/22 | 14.9% | 22.5% |
| 2022/23 | 16.1% | 23.8% |
| 2023/24 | 16.7% | 24.6% |
| 2024/25 | 17.3% | 25.7% |
Pupils known to be eligible for free school meals on census day in January. Source: Department for Education, Explore Education Statistics, Schools, pupils and their characteristics, 2024/25.
SEN support
2024/2512.9%
- England
- 14.0%
1.1 percentage points lower than England.
Show the figures as a table
| Year | West Northamptonshire | England |
|---|---|---|
| 2021/22 | 11.3% | 12.4% |
| 2022/23 | 11.6% | 12.9% |
| 2023/24 | 12.6% | 13.4% |
| 2024/25 | 12.9% | 14.0% |
Pupils receiving special educational needs support without an education, health and care plan. Source: Department for Education, Explore Education Statistics, Schools, pupils and their characteristics, 2024/25.
Education, health and care plan
2024/254.5%
- England
- 5.2%
0.7 percentage points lower than England.
Show the figures as a table
| Year | West Northamptonshire | England |
|---|---|---|
| 2021/22 | 3.1% | 3.8% |
| 2022/23 | 3.5% | 4.2% |
| 2023/24 | 3.9% | 4.7% |
| 2024/25 | 4.5% | 5.2% |
Pupils with an education, health and care plan. Source: Department for Education, Explore Education Statistics, Schools, pupils and their characteristics, 2024/25.
First language other than English
2024/2522.5%
- England
- 21.4%
1.1 percentage points higher than England.
Show the figures as a table
| Year | West Northamptonshire | England |
|---|---|---|
| 2021/22 | 19.7% | 19.6% |
| 2022/23 | 20.7% | 20.2% |
| 2023/24 | 21.8% | 20.8% |
| 2024/25 | 22.5% | 21.4% |
Pupils whose first language is known or believed to be other than English. Source: Department for Education, Explore Education Statistics, Schools, pupils and their characteristics, 2024/25.
Pupils per qualified teacher
2025/2619.4
- England
- 18.5
0.9 higher than England.
Show the figures as a table
| Year | West Northamptonshire | England |
|---|---|---|
| 2017/18 | Not published | 18.4 |
| 2018/19 | Not published | 18.6 |
| 2019/20 | Not published | 18.8 |
| 2020/21 | Not published | 18.5 |
| 2021/22 | 19.1 | 18.5 |
| 2022/23 | 19.2 | 18.5 |
| 2023/24 | 19.6 | 18.6 |
| 2024/25 | 19.9 | 18.6 |
| 2025/26 | 19.4 | 18.5 |
Full-time equivalent pupils for each full-time equivalent qualified teacher. Source: Department for Education, Explore Education Statistics, School workforce in England, 2025/26.
Teacher sickness absence
2024/254.9 days
- England
- 5.0 days
0.1 days lower than England.
Show the figures as a table
| Year | West Northamptonshire | England |
|---|---|---|
| 2017/18 | Not published | 4.0 days |
| 2018/19 | Not published | 4.0 days |
| 2019/20 | Not published | Not published |
| 2020/21 | 4.2 days | 3.9 days |
| 2021/22 | 6.4 days | 6.3 days |
| 2022/23 | 5.2 days | 5.2 days |
| 2023/24 | 4.8 days | 5.3 days |
| 2024/25 | 4.9 days | 5.0 days |
Days lost to sickness absence in the school year, averaged across all teachers. Source: Department for Education, Explore Education Statistics, School workforce in England, 2024/25.
Primary schools
Overall absence
2024/254.9%
- England
- 5.2%
0.3 percentage points lower than England.
Show the figures as a table
| Year | West Northamptonshire | England |
|---|---|---|
| 2017/18 | Not published | 4.2% |
| 2018/19 | Not published | 4.0% |
| 2020/21 | Not published | 3.6% |
| 2021/22 | 5.9% | 6.3% |
| 2022/23 | 5.5% | 5.9% |
| 2023/24 | 5.2% | 5.5% |
| 2024/25 | 4.9% | 5.2% |
Sessions missed for any reason, as a share of all possible sessions in the school year. Source: Department for Education, Explore Education Statistics, Pupil absence in schools in England, 2024/25.
Persistent absence
2024/2511.5%
- England
- 13.0%
1.5 percentage points lower than England.
Show the figures as a table
| Year | West Northamptonshire | England |
|---|---|---|
| 2017/18 | Not published | 8.7% |
| 2018/19 | Not published | 8.2% |
| 2020/21 | Not published | 8.8% |
| 2021/22 | 15.2% | 17.7% |
| 2022/23 | 13.8% | 16.2% |
| 2023/24 | 12.9% | 14.6% |
| 2024/25 | 11.5% | 13.0% |
Pupils who missed 10% or more of their possible sessions, as a share of pupils. Source: Department for Education, Explore Education Statistics, Pupil absence in schools in England, 2024/25.
Severe absence
2024/251.0%
- England
- 0.9%
0.1 percentage points higher than England.
Show the figures as a table
| Year | West Northamptonshire | England |
|---|---|---|
| 2017/18 | Not published | 0.4% |
| 2018/19 | Not published | 0.4% |
| 2020/21 | Not published | 0.7% |
| 2021/22 | 0.7% | 0.6% |
| 2022/23 | 0.9% | 0.7% |
| 2023/24 | 1.0% | 0.9% |
| 2024/25 | 1.0% | 0.9% |
Pupils who missed 50% or more of their possible sessions, as a share of pupils. Source: Department for Education, Explore Education Statistics, Pupil absence in schools in England, 2024/25.
Suspensions per 100 pupils
2024/252.82
- England
- 2.47
0.35 higher than England.
Show the figures as a table
| Year | West Northamptonshire | England |
|---|---|---|
| 2017/18 | Not published | 1.40 |
| 2018/19 | Not published | 1.41 |
| 2019/20 | Not published | 1.00 |
| 2020/21 | Not published | 0.99 |
| 2021/22 | 1.77 | 1.42 |
| 2022/23 | 2.58 | 1.81 |
| 2023/24 | 2.89 | 2.27 |
| 2024/25 | 2.82 | 2.47 |
Suspensions in the school year for every 100 pupils on roll. One pupil can be suspended more than once. Source: Department for Education, Explore Education Statistics, Suspensions and permanent exclusions in England, 2024/25.
Permanent exclusions per 100 pupils
2024/250.03
- England
- 0.03
The same as England.
Show the figures as a table
| Year | West Northamptonshire | England |
|---|---|---|
| 2017/18 | Not published | 0.03 |
| 2018/19 | Not published | 0.02 |
| 2019/20 | Not published | 0.02 |
| 2020/21 | Not published | 0.01 |
| 2021/22 | 0.03 | 0.02 |
| 2022/23 | 0.02 | 0.03 |
| 2023/24 | 0.04 | 0.03 |
| 2024/25 | 0.03 | 0.03 |
Permanent exclusions in the school year for every 100 pupils on roll. Source: Department for Education, Explore Education Statistics, Suspensions and permanent exclusions in England, 2024/25.
Reading, writing and maths: expected standard
2025/26 (provisional)64%
- England
- 63%
1 percentage point higher than England.
Show the figures as a table
| Year | West Northamptonshire | England |
|---|---|---|
| 2021/22 | 60% | 59% |
| 2022/23 | 58% | 60% |
| 2023/24 | 63% | 61% |
| 2024/25 | 63% | 63% |
| 2025/26 (provisional) | 64% | 63% |
Pupils at the end of key stage 2 who met the expected standard in reading, writing and maths combined. Source: Department for Education, Explore Education Statistics, Key stage 2 attainment, 2025/26.
Reading, writing and maths: higher standard
2025/26 (provisional)7%
- England
- 9%
2 percentage points lower than England.
Show the figures as a table
| Year | West Northamptonshire | England |
|---|---|---|
| 2021/22 | 7% | 7% |
| 2022/23 | 8% | 8% |
| 2023/24 | 7% | 8% |
| 2024/25 | 8% | 8% |
| 2025/26 (provisional) | 7% | 9% |
Pupils at the end of key stage 2 who met the higher standard in reading, writing and maths combined. Source: Department for Education, Explore Education Statistics, Key stage 2 attainment, 2025/26.
Eligible for free school meals
2024/2515.9%
- England
- 24.7%
8.8 percentage points lower than England.
Show the figures as a table
| Year | West Northamptonshire | England |
|---|---|---|
| 2021/22 | 15.1% | 23.1% |
| 2022/23 | 15.7% | 24.0% |
| 2023/24 | 15.9% | 24.3% |
| 2024/25 | 15.9% | 24.7% |
Pupils known to be eligible for free school meals on census day in January. Source: Department for Education, Explore Education Statistics, Schools, pupils and their characteristics, 2024/25.
SEN support
2024/2513.2%
- England
- 15.0%
1.8 percentage points lower than England.
Show the figures as a table
| Year | West Northamptonshire | England |
|---|---|---|
| 2021/22 | 11.4% | 13.0% |
| 2022/23 | 11.5% | 13.5% |
| 2023/24 | 12.1% | 14.1% |
| 2024/25 | 13.2% | 15.0% |
Pupils receiving special educational needs support without an education, health and care plan. Source: Department for Education, Explore Education Statistics, Schools, pupils and their characteristics, 2024/25.
Education, health and care plan
2024/253.3%
- England
- 3.5%
0.2 percentage points lower than England.
Show the figures as a table
| Year | West Northamptonshire | England |
|---|---|---|
| 2021/22 | 1.7% | 2.3% |
| 2022/23 | 2.2% | 2.5% |
| 2023/24 | 2.6% | 3.0% |
| 2024/25 | 3.3% | 3.5% |
Pupils with an education, health and care plan. Source: Department for Education, Explore Education Statistics, Schools, pupils and their characteristics, 2024/25.
First language other than English
2024/2524.9%
- England
- 23.4%
1.5 percentage points higher than England.
Show the figures as a table
| Year | West Northamptonshire | England |
|---|---|---|
| 2021/22 | 21.4% | 21.2% |
| 2022/23 | 22.7% | 22.0% |
| 2023/24 | 23.8% | 22.8% |
| 2024/25 | 24.9% | 23.4% |
Pupils whose first language is known or believed to be other than English. Source: Department for Education, Explore Education Statistics, Schools, pupils and their characteristics, 2024/25.
Pupils per qualified teacher
2025/2621.5
- England
- 21.2
0.3 higher than England.
Show the figures as a table
| Year | West Northamptonshire | England |
|---|---|---|
| 2017/18 | Not published | 21.3 |
| 2018/19 | Not published | 21.4 |
| 2019/20 | Not published | 21.4 |
| 2020/21 | Not published | 21.1 |
| 2021/22 | 21.6 | 21.0 |
| 2022/23 | 21.6 | 21.1 |
| 2023/24 | 21.6 | 21.2 |
| 2024/25 | 21.9 | 21.3 |
| 2025/26 | 21.5 | 21.2 |
Full-time equivalent pupils for each full-time equivalent qualified teacher. Source: Department for Education, Explore Education Statistics, School workforce in England, 2025/26.
Secondary schools
Overall absence
2024/258.2%
- England
- 8.4%
0.2 percentage points lower than England.
Show the figures as a table
| Year | West Northamptonshire | England |
|---|---|---|
| 2017/18 | Not published | 5.5% |
| 2018/19 | Not published | 5.5% |
| 2020/21 | Not published | 5.5% |
| 2021/22 | 8.8% | 9.0% |
| 2022/23 | 8.7% | 9.0% |
| 2023/24 | 8.4% | 8.9% |
| 2024/25 | 8.2% | 8.4% |
Sessions missed for any reason, as a share of all possible sessions in the school year. Source: Department for Education, Explore Education Statistics, Pupil absence in schools in England, 2024/25.
Persistent absence
2024/2521.5%
- England
- 23.4%
1.9 percentage points lower than England.
Show the figures as a table
| Year | West Northamptonshire | England |
|---|---|---|
| 2017/18 | Not published | 13.9% |
| 2018/19 | Not published | 13.7% |
| 2020/21 | Not published | 14.8% |
| 2021/22 | 26.5% | 27.7% |
| 2022/23 | 24.9% | 26.5% |
| 2023/24 | 23.7% | 25.6% |
| 2024/25 | 21.5% | 23.4% |
Pupils who missed 10% or more of their possible sessions, as a share of pupils. Source: Department for Education, Explore Education Statistics, Pupil absence in schools in England, 2024/25.
Severe absence
2024/254.0%
- England
- 3.9%
0.1 percentage points higher than England.
Show the figures as a table
| Year | West Northamptonshire | England |
|---|---|---|
| 2017/18 | Not published | 1.2% |
| 2018/19 | Not published | 1.3% |
| 2020/21 | Not published | 1.5% |
| 2021/22 | 2.7% | 2.7% |
| 2022/23 | 3.5% | 3.4% |
| 2023/24 | 3.8% | 3.8% |
| 2024/25 | 4.0% | 3.9% |
Pupils who missed 50% or more of their possible sessions, as a share of pupils. Source: Department for Education, Explore Education Statistics, Pupil absence in schools in England, 2024/25.
Suspensions per 100 pupils
2024/2521.53
- England
- 21.24
0.29 higher than England.
Show the figures as a table
| Year | West Northamptonshire | England |
|---|---|---|
| 2017/18 | Not published | 10.13 |
| 2018/19 | Not published | 10.75 |
| 2019/20 | Not published | 7.43 |
| 2020/21 | Not published | 8.48 |
| 2021/22 | 13.41 | 13.96 |
| 2022/23 | 16.78 | 18.90 |
| 2023/24 | 19.38 | 22.61 |
| 2024/25 | 21.53 | 21.24 |
Suspensions in the school year for every 100 pupils on roll. One pupil can be suspended more than once. Source: Department for Education, Explore Education Statistics, Suspensions and permanent exclusions in England, 2024/25.
Permanent exclusions per 100 pupils
2024/250.18
- England
- 0.23
0.05 lower than England.
Show the figures as a table
| Year | West Northamptonshire | England |
|---|---|---|
| 2017/18 | Not published | 0.20 |
| 2018/19 | Not published | 0.20 |
| 2019/20 | Not published | 0.13 |
| 2020/21 | Not published | 0.10 |
| 2021/22 | 0.11 | 0.16 |
| 2022/23 | 0.23 | 0.22 |
| 2023/24 | 0.13 | 0.25 |
| 2024/25 | 0.18 | 0.23 |
Permanent exclusions in the school year for every 100 pupils on roll. Source: Department for Education, Explore Education Statistics, Suspensions and permanent exclusions in England, 2024/25.
Attainment 8
2025/26 (provisional)47.0
- England
- 47.4
0.4 lower than England.
Show the figures as a table
| Year | West Northamptonshire | England |
|---|---|---|
| 2021/22 | 49.4 | 49.8 |
| 2022/23 | 46.1 | 47.2 |
| 2023/24 | 46.2 | 46.9 |
| 2024/25 | 45.7 | 47.1 |
| 2025/26 (provisional) | 47.0 | 47.4 |
The average of pupils' points across eight GCSE-level qualifications, with English and maths counted twice. Source: Department for Education, Explore Education Statistics, Key stage 4 performance, 2025/26.
English and maths: grade 4 or above
2025/26 (provisional)67%
- England
- 66%
1 percentage point higher than England.
Show the figures as a table
| Year | West Northamptonshire | England |
|---|---|---|
| 2021/22 | 72% | 70% |
| 2022/23 | 67% | 67% |
| 2023/24 | 67% | 67% |
| 2024/25 | 66% | 66% |
| 2025/26 (provisional) | 67% | 66% |
Pupils at the end of key stage 4 with grade 4 or above in both English and maths. Source: Department for Education, Explore Education Statistics, Key stage 4 performance, 2025/26.
English and maths: grade 5 or above
2025/26 (provisional)47%
- England
- 48%
1 percentage point lower than England.
Show the figures as a table
| Year | West Northamptonshire | England |
|---|---|---|
| 2021/22 | 50% | 51% |
| 2022/23 | 45% | 46% |
| 2023/24 | 46% | 47% |
| 2024/25 | 43% | 47% |
| 2025/26 (provisional) | 47% | 48% |
Pupils at the end of key stage 4 with grade 5 or above in both English and maths. Source: Department for Education, Explore Education Statistics, Key stage 4 performance, 2025/26.
Eligible for free school meals
2024/2518.1%
- England
- 25.8%
7.7 percentage points lower than England.
Show the figures as a table
| Year | West Northamptonshire | England |
|---|---|---|
| 2021/22 | 14.0% | 20.9% |
| 2022/23 | 15.7% | 22.7% |
| 2023/24 | 16.7% | 24.1% |
| 2024/25 | 18.1% | 25.8% |
Pupils known to be eligible for free school meals on census day in January. Source: Department for Education, Explore Education Statistics, Schools, pupils and their characteristics, 2024/25.
SEN support
2024/2512.9%
- England
- 13.4%
0.5 percentage points lower than England.
Show the figures as a table
| Year | West Northamptonshire | England |
|---|---|---|
| 2021/22 | 11.7% | 11.9% |
| 2022/23 | 12.0% | 12.4% |
| 2023/24 | 13.2% | 12.9% |
| 2024/25 | 12.9% | 13.4% |
Pupils receiving special educational needs support without an education, health and care plan. Source: Department for Education, Explore Education Statistics, Schools, pupils and their characteristics, 2024/25.
Education, health and care plan
2024/252.1%
- England
- 3.1%
1.0 percentage point lower than England.
Show the figures as a table
| Year | West Northamptonshire | England |
|---|---|---|
| 2021/22 | 1.0% | 2.2% |
| 2022/23 | 1.2% | 2.4% |
| 2023/24 | 1.6% | 2.7% |
| 2024/25 | 2.1% | 3.1% |
Pupils with an education, health and care plan. Source: Department for Education, Explore Education Statistics, Schools, pupils and their characteristics, 2024/25.
First language other than English
2024/2520.1%
- England
- 19.2%
0.9 percentage points higher than England.
Show the figures as a table
| Year | West Northamptonshire | England |
|---|---|---|
| 2021/22 | 17.9% | 17.5% |
| 2022/23 | 18.5% | 18.1% |
| 2023/24 | 19.8% | 18.6% |
| 2024/25 | 20.1% | 19.2% |
Pupils whose first language is known or believed to be other than English. Source: Department for Education, Explore Education Statistics, Schools, pupils and their characteristics, 2024/25.
Pupils per qualified teacher
2025/2619.1
- England
- 17.3
1.8 higher than England.
Show the figures as a table
| Year | West Northamptonshire | England |
|---|---|---|
| 2017/18 | Not published | 16.5 |
| 2018/19 | Not published | 16.8 |
| 2019/20 | Not published | 17.2 |
| 2020/21 | Not published | 17.1 |
| 2021/22 | 18.4 | 17.1 |
| 2022/23 | 18.3 | 17.2 |
| 2023/24 | 19.1 | 17.4 |
| 2024/25 | 19.4 | 17.3 |
| 2025/26 | 19.1 | 17.3 |
Full-time equivalent pupils for each full-time equivalent qualified teacher. Source: Department for Education, Explore Education Statistics, School workforce in England, 2025/26.
Special schools
Overall absence
2024/2512.1%
- England
- 12.8%
0.7 percentage points lower than England.
Show the figures as a table
| Year | West Northamptonshire | England |
|---|---|---|
| 2017/18 | Not published | 10.2% |
| 2018/19 | Not published | 10.1% |
| 2020/21 | Not published | 15.2% |
| 2021/22 | 11.5% | 13.2% |
| 2022/23 | 11.3% | 13.0% |
| 2023/24 | 11.5% | 13.0% |
| 2024/25 | 12.1% | 12.8% |
Sessions missed for any reason, as a share of all possible sessions in the school year. Source: Department for Education, Explore Education Statistics, Pupil absence in schools in England, 2024/25.
Persistent absence
2024/2533.1%
- England
- 35.3%
2.2 percentage points lower than England.
Show the figures as a table
| Year | West Northamptonshire | England |
|---|---|---|
| 2017/18 | Not published | 29.6% |
| 2018/19 | Not published | 28.8% |
| 2020/21 | Not published | 48.9% |
| 2021/22 | 34.8% | 40.4% |
| 2022/23 | 34.4% | 38.3% |
| 2023/24 | 32.7% | 37.2% |
| 2024/25 | 33.1% | 35.3% |
Pupils who missed 10% or more of their possible sessions, as a share of pupils. Source: Department for Education, Explore Education Statistics, Pupil absence in schools in England, 2024/25.
Severe absence
2024/256.5%
- England
- 6.9%
0.4 percentage points lower than England.
Show the figures as a table
| Year | West Northamptonshire | England |
|---|---|---|
| 2017/18 | Not published | 4.4% |
| 2018/19 | Not published | 4.6% |
| 2020/21 | Not published | 5.6% |
| 2021/22 | 3.8% | 5.8% |
| 2022/23 | 4.4% | 6.2% |
| 2023/24 | 4.9% | 6.7% |
| 2024/25 | 6.5% | 6.9% |
Pupils who missed 50% or more of their possible sessions, as a share of pupils. Source: Department for Education, Explore Education Statistics, Pupil absence in schools in England, 2024/25.
Suspensions per 100 pupils
2024/2516.65
- England
- 12.32
4.33 higher than England.
Show the figures as a table
| Year | West Northamptonshire | England |
|---|---|---|
| 2017/18 | Not published | 12.34 |
| 2018/19 | Not published | 11.32 |
| 2019/20 | Not published | 7.76 |
| 2020/21 | Not published | 7.29 |
| 2021/22 | 7.53 | 9.60 |
| 2022/23 | 11.38 | 10.99 |
| 2023/24 | 11.24 | 12.62 |
| 2024/25 | 16.65 | 12.32 |
Suspensions in the school year for every 100 pupils on roll. One pupil can be suspended more than once. Source: Department for Education, Explore Education Statistics, Suspensions and permanent exclusions in England, 2024/25.
Permanent exclusions per 100 pupils
2024/250.08
- England
- 0.08
The same as England.
Show the figures as a table
| Year | West Northamptonshire | England |
|---|---|---|
| 2017/18 | Not published | 0.07 |
| 2018/19 | Not published | 0.06 |
| 2019/20 | Not published | 0.04 |
| 2020/21 | Not published | 0.03 |
| 2021/22 | 0.00 | 0.05 |
| 2022/23 | 0.00 | 0.08 |
| 2023/24 | 0.17 | 0.08 |
| 2024/25 | 0.08 | 0.08 |
Permanent exclusions in the school year for every 100 pupils on roll. Source: Department for Education, Explore Education Statistics, Suspensions and permanent exclusions in England, 2024/25.
Eligible for free school meals
2024/2540.0%
- England
- 48.8%
8.8 percentage points lower than England.
Show the figures as a table
| Year | West Northamptonshire | England |
|---|---|---|
| 2021/22 | 37.7% | 44.4% |
| 2022/23 | 38.2% | 45.6% |
| 2023/24 | 39.1% | 47.1% |
| 2024/25 | 40.0% | 48.8% |
Pupils known to be eligible for free school meals on census day in January. Source: Department for Education, Explore Education Statistics, Schools, pupils and their characteristics, 2024/25.
SEN support
2024/250.2%
- England
- 0.5%
0.3 percentage points lower than England.
Show the figures as a table
| Year | West Northamptonshire | England |
|---|---|---|
| 2021/22 | 0.1% | 0.9% |
| 2022/23 | 0.2% | 0.8% |
| 2023/24 | 0.0% | 0.7% |
| 2024/25 | 0.2% | 0.5% |
Pupils receiving special educational needs support without an education, health and care plan. Source: Department for Education, Explore Education Statistics, Schools, pupils and their characteristics, 2024/25.
Education, health and care plan
2024/2599.8%
- England
- 99.5%
0.3 percentage points higher than England.
Show the figures as a table
| Year | West Northamptonshire | England |
|---|---|---|
| 2021/22 | 99.9% | 99.1% |
| 2022/23 | 99.8% | 99.2% |
| 2023/24 | 100.0% | 99.3% |
| 2024/25 | 99.8% | 99.5% |
Pupils with an education, health and care plan. Source: Department for Education, Explore Education Statistics, Schools, pupils and their characteristics, 2024/25.
First language other than English
2024/2514.4%
- England
- 14.4%
The same as England.
Show the figures as a table
| Year | West Northamptonshire | England |
|---|---|---|
| 2021/22 | 12.9% | 14.5% |
| 2022/23 | 12.9% | 14.4% |
| 2023/24 | 13.3% | 14.4% |
| 2024/25 | 14.4% | 14.4% |
Pupils whose first language is known or believed to be other than English. Source: Department for Education, Explore Education Statistics, Schools, pupils and their characteristics, 2024/25.
Pupils per qualified teacher
2025/267.5
- England
- 7.3
0.2 higher than England.
Show the figures as a table
| Year | West Northamptonshire | England |
|---|---|---|
| 2017/18 | Not published | 6.7 |
| 2018/19 | Not published | 6.8 |
| 2019/20 | Not published | 7.0 |
| 2020/21 | Not published | 6.8 |
| 2021/22 | 6.5 | 6.9 |
| 2022/23 | 6.8 | 7.0 |
| 2023/24 | 7.3 | 7.1 |
| 2024/25 | 7.4 | 7.3 |
| 2025/26 | 7.5 | 7.3 |
Full-time equivalent pupils for each full-time equivalent qualified teacher. Source: Department for Education, Explore Education Statistics, School workforce in England, 2025/26.
Schools in West Northamptonshire
Listed by name. Filter by phase or type; sort by name or size. Nothing here is sorted by results.
Showing 188 of 188 schools in West Northamptonshire.
| School | Phase | Type | Town | Pupils |
|---|---|---|---|---|
| Abbey CofE Academy | Primary | Academy | Daventry | 184 |
| Abbeyfield School | Secondary | Academy | Northampton | 1,296 |
| Abington Vale Primary School | Primary | Academy | Northampton | 409 |
| All Saints CofE VA Primary School | Primary | Maintained | Northampton | 402 |
| Ashby Fields Primary School | Primary | Academy | Daventry | 397 |
| Ashton CofE Primary School | Primary | Maintained | Northampton | 35 |
| Badby School | Primary | Academy | Badby | 192 |
| Barby Church of England Primary School | Primary | Academy | Rugby | 96 |
| Barry Primary School | Primary | Maintained | Northampton | 441 |
| Billing Brook Special School | Special | Academy | Northampton | 257 |
| Blackthorn Primary School | Primary | Academy | Northampton | 236 |
| Blakesley Church of England Primary School | Primary | Academy | Towcester | 104 |
| Blisworth Community Primary School | Primary | Maintained | Northampton | 173 |
| Boddington Church of England Primary Academy | Primary | Academy | Daventry | 52 |
| Boothville Primary School | Primary | Maintained | Northampton | 601 |
| Boughton Primary School | Primary | Academy | Northampton | 199 |
| Bracken Leas Primary School | Primary | Academy | Brackley | 420 |
| Brackley Church of England Junior School | Primary | Maintained | BRACKLEY | 225 |
| Braunston Church of England Primary School | Primary | Academy | Daventry | 200 |
| Briar Hill Primary School & Nursery | Primary | Academy | Northampton | 350 |
| Bridgewater Primary School | Primary | Maintained | Northampton | 650 |
| Brington Primary School | Primary | Maintained | Northampton | 50 |
| Brixworth CofE VC Primary School | Primary | Maintained | Northampton | 484 |
| Buckton Fields Primary School | Primary | Free school | Northampton | 289 |
| Bugbrooke Community Primary School | Primary | Maintained | Northampton | 192 |
| Byfield School | Primary | Academy | Daventry | 108 |
| Campion School | Secondary | Academy | Northampton | 1,309 |
| Camrose Early Years Centre for Children & Families | Nursery | Maintained | Northampton | 98 |
| Caroline Chisholm School | All-through | Academy | Northampton | 2,049 |
| Castle Academy | Primary | Academy | Northampton | 455 |
| Cedar Road Primary School | Primary | Academy | Northampton | 383 |
| Chacombe CEVA Primary Academy | Primary | Academy | Banbury | 99 |
| Chenderit School | Secondary | Academy | Banbury | 1,104 |
| Chiltern Primary School | Primary | Maintained | Northampton | 133 |
| Chipping Warden Primary Academy | Primary | Academy | Banbury | 93 |
| Clipston Endowed Voluntary Controlled Primary School | Primary | Maintained | Market Harborough | 93 |
| Cogenhoe Primary School | Primary | Academy | Northampton | 191 |
| Collingtree Church of England Primary School | Primary | Academy | Northampton | 65 |
| Cosgrove Village Primary School | Primary | Maintained | Cosgrove | 39 |
| Crick Primary School | Primary | Maintained | Northampton | 194 |
| Croughton All Saints CofE Primary School | Primary | Maintained | Brackley | 104 |
| Culworth Church of England Primary Academy | Primary | Academy | Banbury | 109 |
| Daventry Hill School | Special | Free school | Daventry | 235 |
| Deanshanger Primary School | Primary | Academy | Milton Keynes | 257 |
| Delapre Primary School | Primary | Maintained | Northampton | 539 |
| Denton Primary School | Primary | Maintained | Northampton | 84 |
| DSLV E-ACT Academy | All-through | Academy | Daventry | 997 |
| Duston Eldean Primary School | Primary | Maintained | Northampton | 418 |
| E-ACT The Grange School | Primary | Academy | Daventry | 336 |
| Earl Spencer Primary School | Primary | Maintained | Northampton | 352 |
| East Haddon Church of England Primary School | Primary | Maintained | Northampton | 81 |
| East Hunsbury Primary School | Primary | Academy | Northampton | 453 |
| Eastfield Academy | Primary | Academy | Northampton | 221 |
| Ecton Brook Primary School | Primary | Academy | Northampton | 567 |
| Elizabeth Woodville School | Secondary | Academy | Milton Keynes | 1,124 |
| Fairfields School | Special | Maintained special | Northampton | 124 |
| Falconer's Hill Academy | Primary | Academy | Daventry | 236 |
| Falconer's Hill Infant School | Primary | Academy | Daventry | 164 |
| Farthinghoe Primary School | Primary | Academy | Brackley | 16 |
| Flore Church of England Primary School | Primary | Maintained | Northampton | 63 |
| Gayton Church of England Primary School | Primary | Maintained | Northampton | 57 |
| Gloucester Nursery School | Nursery | Maintained | Northampton | 84 |
| Greatworth Primary School | Primary | Maintained | Banbury | 86 |
| Green Oaks Primary Academy | Primary | Academy | Northampton | 220 |
| Greenfields Specialist School for Communication | Special | Academy | Northampton | 106 |
| Greens Norton Church of England Primary School | Primary | Academy | Towcester | 129 |
| Guilsborough Academy | Secondary | Academy | Northampton | 1,198 |
| Guilsborough Church of England Primary School | Primary | Academy | Northampton | 95 |
| Hackleton CofE Primary School | Primary | Maintained | Northampton | 183 |
| Hardingstone Academy | Primary | Academy | Northampton | 230 |
| Harlestone Primary School | Primary | Maintained | Northampton | 64 |
| Harpole Primary School | Primary | Maintained | Northampton | 186 |
| Hartwell Primary School | Primary | Academy | Northampton | 200 |
| Headlands Primary School | Primary | Academy | Northampton | 450 |
| Helmdon Primary School | Primary | Maintained | Brackley | 126 |
| Hopping Hill Primary School | Primary | Maintained | Northampton | 423 |
| Hospital and Outreach Education | Alternative provision | Academy | Northampton | 7 |
| Hunsbury Park Primary School | Primary | Academy | Northampton | 354 |
| John Hellins Primary School | Primary | Maintained | Towcester | 202 |
| Kilsby Church of England Primary School | Primary | Academy | Rugby | 192 |
| Kings Heath Primary Academy | Primary | Academy | Northampton | 350 |
| Kings Meadow School | Special | Academy | Northampton | 53 |
| Kings Sutton Primary Academy | Primary | Academy | Banbury | 79 |
| Kingsley Primary School | Primary | Academy | Northampton | 401 |
| Kingsthorpe College | Secondary | Academy | Northampton | 1,415 |
| Kingsthorpe Grove Primary School | Primary | Maintained | Northampton | 471 |
| Kingsthorpe Village Primary School | Primary | Maintained | Northampton | 202 |
| Kislingbury Primary School | Primary | Academy | Northampton | 111 |
| Lings Primary School | Primary | Academy | Northampton | 401 |
| Little Houghton Church of England Primary | Primary | Maintained | Northampton | 88 |
| Long Buckby Infant School | Primary | Maintained | Northampton | 119 |
| Long Buckby Junior School | Primary | Maintained | Northampton | 181 |
| Lumbertubs Primary School | Primary | Academy | Northampton | 222 |
| Lyncrest Primary School | Primary | Maintained | Northampton | 228 |
| Magdalen College School | Secondary | Academy | Brackley | 1,293 |
| Maidwell Primary School | Primary | Maintained | Northampton | 67 |
| Malcolm Arnold Academy | Secondary | Academy | Northampton | 1,278 |
| Malcolm Arnold Preparatory School | Primary | Free school | Northampton | 401 |
| Marie Weller Primary School | Primary | Free school | Towcester | 245 |
| Middleton Cheney Primary Academy | Primary | Academy | Banbury | 322 |
| Millway Primary School | Primary | Maintained | Northampton | 343 |
| Milton Parochial Primary School | Primary | Academy | Northampton | 38 |
| Monksmoor Park Church of England Primary School | Primary | Academy | Daventry | 234 |
| Moulton Primary School | Primary | Maintained | Northampton | 597 |
| Moulton School and Science College | Secondary | Academy | Northampton | 1,450 |
| Naseby Church of England Primary Academy | Primary | Academy | Northampton | 31 |
| New Horizons Academy | Alternative provision | Free school | Northampton | 50 |
| Newbottle and Charlton Church of England Primary School | Primary | Maintained | Banbury | 108 |
| Newnham Primary School | Primary | Academy | Daventry | 84 |
| Nicholas Hawksmoor Primary School | Primary | Academy | Towcester | 429 |
| Northampton Academy | Secondary | Academy | Northampton | 1,712 |
| Northampton International Academy | All-through | Free school | Northampton | 1,754 |
| Northampton School | Secondary | Free school | Northampton | 650 |
| Northampton School for Boys | Secondary | Academy | Northampton | 1,756 |
| Northampton School for Girls | Secondary | Academy | Northampton | 1,670 |
| Northgate School Academy Trust | Special | Academy | Northampton | 289 |
| Old Stratford Primary School | Primary | Academy | Milton Keynes | 162 |
| Overstone Gate Primary School | Primary | Free school | Northampton | 30 |
| Overstone Primary School | Primary | Maintained | Northampton | 205 |
| Parklands Nursery School | Nursery | Maintained | Northampton | 57 |
| Parklands Primary School | Primary | Academy | Northampton | 418 |
| Pattishall Church of England Primary School | Primary | Maintained | Towcester | 155 |
| Paulerspury Church of England Primary School | Primary | Academy | Towcester | 59 |
| Pineham Barns Primary School | Primary | Free school | Pineham Village | 413 |
| Pitsford Primary School | Primary | Maintained | Northampton | 67 |
| Preston Hedges Primary School | Primary | Academy | Northampton | 418 |
| Purple Oaks Academy | Special | Free school | Northampton | 131 |
| Queen Eleanor Primary Academy | Primary | Academy | Northampton | 223 |
| Rectory Farm Primary School | Primary | Academy | Northampton | 179 |
| Roade Primary School | Primary | Maintained | Northampton | 315 |
| Roade Village Academy | Secondary | Academy | Roade | Not published |
| Rothersthorpe Church of England Primary School | Primary | Academy | Northampton | 87 |
| Silverstone Church of England Primary School | Primary | Academy | Towcester | 224 |
| Silverstone UTC | Secondary | Free school | Towcester | 463 |
| Simon de Senlis Primary School | Primary | Academy | Northampton | 434 |
| Sponne School | Secondary | Academy | Towcester | 1,410 |
| Spratton Church of England Primary School | Primary | Academy | Northampton | 46 |
| Spring Lane Primary School | Primary | Academy | Northampton | 434 |
| St Andrew's Ceva Primary School | Primary | Maintained | Northampton | 281 |
| St Gregory's Catholic Primary School | Primary | Academy | Northampton | 214 |
| St James Church of England Primary School | Primary | Academy | Northampton | 445 |
| St James Infant School | Primary | Academy | Daventry | 199 |
| St Luke's Church of England Primary School | Primary | Academy | Northampton | 391 |
| St Mary's Catholic Primary School | Primary | Academy | Northampton | 160 |
| St Mary's Catholic Primary School, Aston-le-Walls | Primary | Maintained | Daventry | 81 |
| St Thomas Becket Catholic School | Secondary | Academy | Northampton | 912 |
| Standens Barn Primary School | Primary | Academy | Northampton | 327 |
| Staverton Church of England Voluntary Primary School | Primary | Academy | Daventry | 108 |
| Stimpson Avenue Academy | Primary | Academy | Northampton | 440 |
| Stoke Bruerne Church of England Primary School | Primary | Maintained | Towcester | 65 |
| Sunnyside Primary Academy | Primary | Academy | Northampton | 364 |
| Syresham St James CofE Primary School and Nursery | Primary | Maintained | Brackley | 122 |
| The Abbey Primary School | Primary | Academy | Northampton | 330 |
| The Arbours Primary Academy | Primary | Academy | Northampton | 333 |
| The Bliss Charity School | Primary | Maintained | Northampton | 177 |
| The Bramptons Primary School | Primary | Maintained | Northampton | 94 |
| The CE Academy | Alternative provision | Academy | Northampton | 124 |
| The Duston School | All-through | Academy | Northampton | 2,064 |
| The Gateway School | Special | Academy | Northampton | 102 |
| The Good Shepherd Catholic Primary School | Primary | Academy | Northampton | 282 |
| The Parker E-ACT Academy | Secondary | Academy | Daventry | 1,132 |
| The Radstone Primary School | Primary | Free school | Brackley | 415 |
| Thorplands Primary School | Primary | Academy | Northampton | 226 |
| Tiffield Academy | Special | Free school | Towcester | 95 |
| Tiffield Church of England Voluntary Aided Primary School | Primary | Maintained | Towcester | 35 |
| Towcester Church of England Primary School | Primary | Academy | Towcester | 267 |
| Upton Meadows Primary School | Primary | Academy | Northampton | 387 |
| Vernon Terrace Primary School | Primary | Maintained | Northampton | 233 |
| Walgrave Primary School | Primary | Maintained | Northampton | 149 |
| Wallace Road Nursery School | Nursery | Maintained | Northampton | 47 |
| Waynflete Infants' School | Primary | Academy | Brackley | 140 |
| Weedon Bec Primary School | Primary | Academy | Northampton | 182 |
| Welford Sibbertoft and Sulby Endowed School | Primary | Academy | Northampton | 98 |
| Welton Church of England Academy | Primary | Academy | Daventry | 129 |
| West Haddon Endowed Church of England Primary School | Primary | Maintained | Northampton | 239 |
| Weston Favell Academy | Secondary | Academy | Northampton | 1,431 |
| Weston Favell CofE Primary School | Primary | Academy | Northampton | 446 |
| Whitehills Nursery School | Nursery | Maintained | Northampton | 40 |
| Whitehills Primary School | Primary | Maintained | Northampton | 415 |
| Whittlebury Church of England Primary School | Primary | Maintained | Towcester | 71 |
| Woodford Halse Church of England Primary Academy | Primary | Academy | Daventry | 207 |
| Woodland View Primary School | Primary | Academy | Northampton | 417 |
| Woodvale Primary Academy | Primary | Academy | Northampton | 449 |
| Wootton Park School | All-through | Free school | Northampton | 1,670 |
| Wootton Primary School | Primary | Academy | Northampton | 306 |
| Yardley Gobion Church of England Primary School | Primary | Maintained | Towcester | 87 |
| Yardley Hastings Primary School | Primary | Maintained | Northampton | 104 |
| Yelvertoft Primary School | Primary | Maintained | Northampton | 95 |