Walsall
122 state-funded schools with 53,206 pupils on roll, in the West Midlands region. Every school’s page has its published figures against Walsall and England.
- Primary
- 85
- Secondary
- 18
- All-through
- 1
- Special
- 7
- Alternative provision
- 3
- Nursery
- 8
- Academies
- 67
- Maintained
- 50
- Maintained special
- 3
- Free schools
- 2
Map
Zoom in to see each school. Open the full map
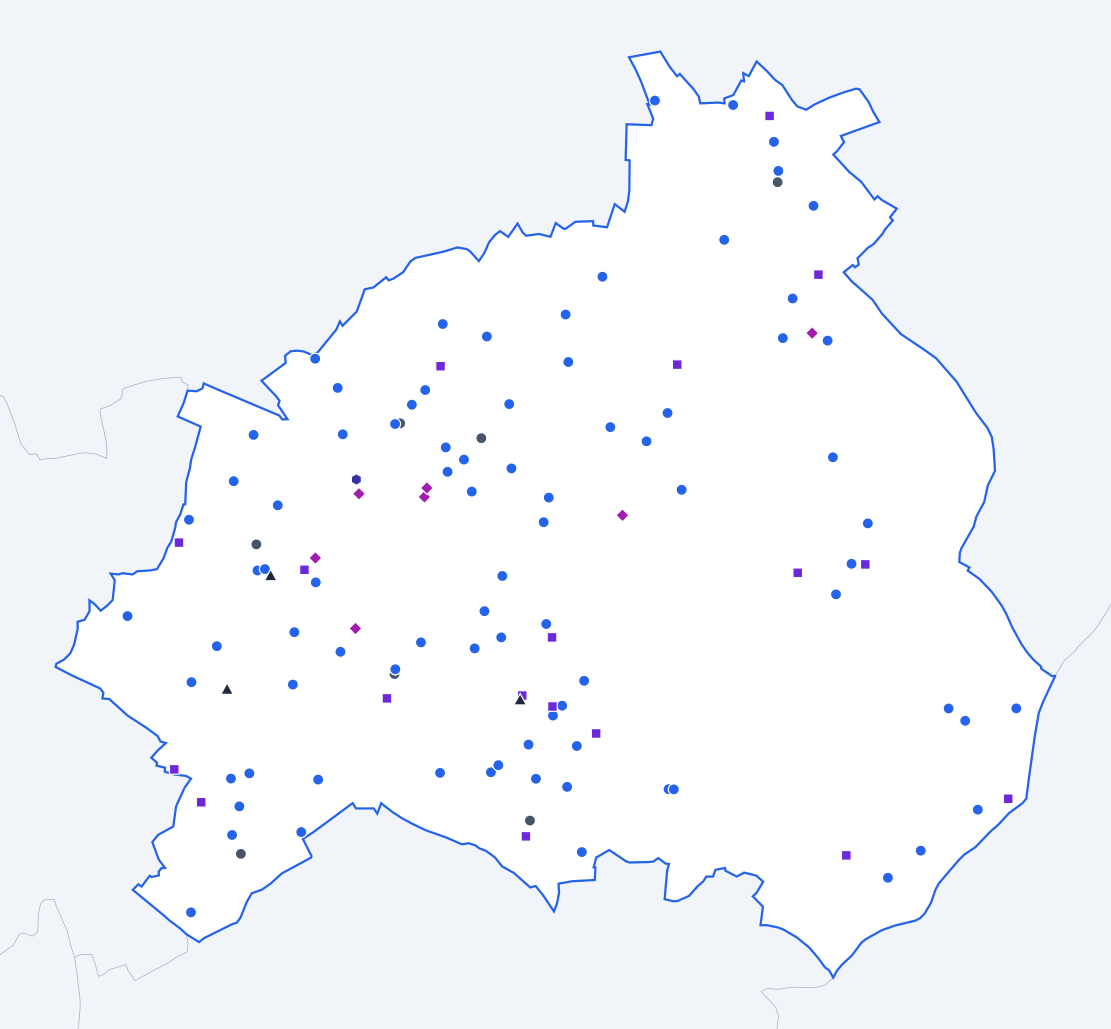
ONS, OS © Crown copyright 2025 · GIAS · © OpenStreetMap
Walsall against England
Published figures for the authority’s schools, set against the same kind of school across England.
All state-funded schools
Overall absence
2024/257.4%
- England
- 6.8%
0.6 percentage points higher than England.
Show the figures as a table
| Year | Walsall | England |
|---|---|---|
| 2017/18 | 5.0% | 4.8% |
| 2018/19 | 4.9% | 4.7% |
| 2020/21 | 5.4% | 4.6% |
| 2021/22 | 7.9% | 7.6% |
| 2022/23 | 8.0% | 7.4% |
| 2023/24 | 7.8% | 7.1% |
| 2024/25 | 7.4% | 6.8% |
Sessions missed for any reason, as a share of all possible sessions in the school year. Source: Department for Education, Explore Education Statistics, Pupil absence in schools in England, 2024/25.
Persistent absence
2024/2521.6%
- England
- 18.1%
3.5 percentage points higher than England.
Show the figures as a table
| Year | Walsall | England |
|---|---|---|
| 2017/18 | 11.9% | 11.2% |
| 2018/19 | 11.7% | 10.9% |
| 2020/21 | 14.9% | 12.1% |
| 2021/22 | 24.9% | 22.5% |
| 2022/23 | 24.3% | 21.2% |
| 2023/24 | 23.0% | 20.0% |
| 2024/25 | 21.6% | 18.1% |
Pupils who missed 10% or more of their possible sessions, as a share of pupils. Source: Department for Education, Explore Education Statistics, Pupil absence in schools in England, 2024/25.
Severe absence
2024/252.7%
- England
- 2.4%
0.3 percentage points higher than England.
Show the figures as a table
| Year | Walsall | England |
|---|---|---|
| 2017/18 | 0.7% | 0.8% |
| 2018/19 | 0.9% | 0.8% |
| 2020/21 | 1.3% | 1.1% |
| 2021/22 | 1.7% | 1.7% |
| 2022/23 | 2.1% | 2.0% |
| 2023/24 | 2.6% | 2.3% |
| 2024/25 | 2.7% | 2.4% |
Pupils who missed 50% or more of their possible sessions, as a share of pupils. Source: Department for Education, Explore Education Statistics, Pupil absence in schools in England, 2024/25.
Suspensions per 100 pupils
2024/2511.44
- England
- 10.88
0.56 higher than England.
Show the figures as a table
| Year | Walsall | England |
|---|---|---|
| 2017/18 | 4.13 | 5.08 |
| 2018/19 | 4.13 | 5.36 |
| 2019/20 | 2.98 | 3.76 |
| 2020/21 | 2.89 | 4.25 |
| 2021/22 | 4.22 | 6.91 |
| 2022/23 | 5.87 | 9.33 |
| 2023/24 | 11.90 | 11.31 |
| 2024/25 | 11.44 | 10.88 |
Suspensions in the school year for every 100 pupils on roll. One pupil can be suspended more than once. Source: Department for Education, Explore Education Statistics, Suspensions and permanent exclusions in England, 2024/25.
Permanent exclusions per 100 pupils
2024/250.06
- England
- 0.12
0.06 lower than England.
Show the figures as a table
| Year | Walsall | England |
|---|---|---|
| 2017/18 | 0.12 | 0.10 |
| 2018/19 | 0.14 | 0.10 |
| 2019/20 | 0.08 | 0.06 |
| 2020/21 | 0.08 | 0.05 |
| 2021/22 | 0.09 | 0.08 |
| 2022/23 | 0.09 | 0.11 |
| 2023/24 | 0.10 | 0.13 |
| 2024/25 | 0.06 | 0.12 |
Permanent exclusions in the school year for every 100 pupils on roll. Source: Department for Education, Explore Education Statistics, Suspensions and permanent exclusions in England, 2024/25.
Eligible for free school meals
2024/2536.0%
- England
- 25.7%
10.3 percentage points higher than England.
Show the figures as a table
| Year | Walsall | England |
|---|---|---|
| 2021/22 | 31.5% | 22.5% |
| 2022/23 | 33.1% | 23.8% |
| 2023/24 | 33.7% | 24.6% |
| 2024/25 | 36.0% | 25.7% |
Pupils known to be eligible for free school meals on census day in January. Source: Department for Education, Explore Education Statistics, Schools, pupils and their characteristics, 2024/25.
SEN support
2024/2513.4%
- England
- 14.0%
0.6 percentage points lower than England.
Show the figures as a table
| Year | Walsall | England |
|---|---|---|
| 2021/22 | 12.7% | 12.4% |
| 2022/23 | 13.0% | 12.9% |
| 2023/24 | 12.8% | 13.4% |
| 2024/25 | 13.4% | 14.0% |
Pupils receiving special educational needs support without an education, health and care plan. Source: Department for Education, Explore Education Statistics, Schools, pupils and their characteristics, 2024/25.
Education, health and care plan
2024/255.6%
- England
- 5.2%
0.4 percentage points higher than England.
Show the figures as a table
| Year | Walsall | England |
|---|---|---|
| 2021/22 | 3.5% | 3.8% |
| 2022/23 | 4.1% | 4.2% |
| 2023/24 | 5.2% | 4.7% |
| 2024/25 | 5.6% | 5.2% |
Pupils with an education, health and care plan. Source: Department for Education, Explore Education Statistics, Schools, pupils and their characteristics, 2024/25.
First language other than English
2024/2524.5%
- England
- 21.4%
3.1 percentage points higher than England.
Show the figures as a table
| Year | Walsall | England |
|---|---|---|
| 2021/22 | 23.2% | 19.6% |
| 2022/23 | 23.5% | 20.2% |
| 2023/24 | 23.7% | 20.8% |
| 2024/25 | 24.5% | 21.4% |
Pupils whose first language is known or believed to be other than English. Source: Department for Education, Explore Education Statistics, Schools, pupils and their characteristics, 2024/25.
Pupils per qualified teacher
2025/2617.7
- England
- 18.5
0.8 lower than England.
Show the figures as a table
| Year | Walsall | England |
|---|---|---|
| 2017/18 | 19.6 | 18.4 |
| 2018/19 | 19.4 | 18.6 |
| 2019/20 | 19.7 | 18.8 |
| 2020/21 | 19.5 | 18.5 |
| 2021/22 | 18.2 | 18.5 |
| 2022/23 | 18.2 | 18.5 |
| 2023/24 | 18.5 | 18.6 |
| 2024/25 | 18.2 | 18.6 |
| 2025/26 | 17.7 | 18.5 |
Full-time equivalent pupils for each full-time equivalent qualified teacher. Source: Department for Education, Explore Education Statistics, School workforce in England, 2025/26.
Teacher sickness absence
2024/255.6 days
- England
- 5.0 days
0.6 days higher than England.
Show the figures as a table
| Year | Walsall | England |
|---|---|---|
| 2017/18 | 4.8 days | 4.0 days |
| 2018/19 | 4.9 days | 4.0 days |
| 2019/20 | Not published | Not published |
| 2020/21 | 3.9 days | 3.9 days |
| 2021/22 | 6.8 days | 6.3 days |
| 2022/23 | 5.7 days | 5.2 days |
| 2023/24 | 6.2 days | 5.3 days |
| 2024/25 | 5.6 days | 5.0 days |
Days lost to sickness absence in the school year, averaged across all teachers. Source: Department for Education, Explore Education Statistics, School workforce in England, 2024/25.
Primary schools
Overall absence
2024/255.9%
- England
- 5.2%
0.7 percentage points higher than England.
Show the figures as a table
| Year | Walsall | England |
|---|---|---|
| 2017/18 | 4.3% | 4.2% |
| 2018/19 | 4.1% | 4.0% |
| 2020/21 | 4.1% | 3.6% |
| 2021/22 | 6.5% | 6.3% |
| 2022/23 | 6.7% | 5.9% |
| 2023/24 | 6.0% | 5.5% |
| 2024/25 | 5.9% | 5.2% |
Sessions missed for any reason, as a share of all possible sessions in the school year. Source: Department for Education, Explore Education Statistics, Pupil absence in schools in England, 2024/25.
Persistent absence
2024/2516.1%
- England
- 13.0%
3.1 percentage points higher than England.
Show the figures as a table
| Year | Walsall | England |
|---|---|---|
| 2017/18 | 9.0% | 8.7% |
| 2018/19 | 8.5% | 8.2% |
| 2020/21 | 10.5% | 8.8% |
| 2021/22 | 19.7% | 17.7% |
| 2022/23 | 20.0% | 16.2% |
| 2023/24 | 17.1% | 14.6% |
| 2024/25 | 16.1% | 13.0% |
Pupils who missed 10% or more of their possible sessions, as a share of pupils. Source: Department for Education, Explore Education Statistics, Pupil absence in schools in England, 2024/25.
Severe absence
2024/251.2%
- England
- 0.9%
0.3 percentage points higher than England.
Show the figures as a table
| Year | Walsall | England |
|---|---|---|
| 2017/18 | 0.4% | 0.4% |
| 2018/19 | 0.4% | 0.4% |
| 2020/21 | 0.7% | 0.7% |
| 2021/22 | 0.7% | 0.6% |
| 2022/23 | 0.8% | 0.7% |
| 2023/24 | 1.0% | 0.9% |
| 2024/25 | 1.2% | 0.9% |
Pupils who missed 50% or more of their possible sessions, as a share of pupils. Source: Department for Education, Explore Education Statistics, Pupil absence in schools in England, 2024/25.
Suspensions per 100 pupils
2024/252.03
- England
- 2.47
0.44 lower than England.
Show the figures as a table
| Year | Walsall | England |
|---|---|---|
| 2017/18 | 1.53 | 1.40 |
| 2018/19 | 1.20 | 1.41 |
| 2019/20 | 0.92 | 1.00 |
| 2020/21 | 0.71 | 0.99 |
| 2021/22 | 1.07 | 1.42 |
| 2022/23 | 1.02 | 1.81 |
| 2023/24 | 1.51 | 2.27 |
| 2024/25 | 2.03 | 2.47 |
Suspensions in the school year for every 100 pupils on roll. One pupil can be suspended more than once. Source: Department for Education, Explore Education Statistics, Suspensions and permanent exclusions in England, 2024/25.
Permanent exclusions per 100 pupils
2024/250.02
- England
- 0.03
0.01 lower than England.
Show the figures as a table
| Year | Walsall | England |
|---|---|---|
| 2017/18 | 0.03 | 0.03 |
| 2018/19 | 0.03 | 0.02 |
| 2019/20 | 0.03 | 0.02 |
| 2020/21 | 0.02 | 0.01 |
| 2021/22 | 0.03 | 0.02 |
| 2022/23 | 0.01 | 0.03 |
| 2023/24 | 0.02 | 0.03 |
| 2024/25 | 0.02 | 0.03 |
Permanent exclusions in the school year for every 100 pupils on roll. Source: Department for Education, Explore Education Statistics, Suspensions and permanent exclusions in England, 2024/25.
Reading, writing and maths: expected standard
2025/26 (provisional)61%
- England
- 63%
2 percentage points lower than England.
Show the figures as a table
| Year | Walsall | England |
|---|---|---|
| 2021/22 | 56% | 59% |
| 2022/23 | 59% | 60% |
| 2023/24 | 60% | 61% |
| 2024/25 | 59% | 63% |
| 2025/26 (provisional) | 61% | 63% |
Pupils at the end of key stage 2 who met the expected standard in reading, writing and maths combined. Source: Department for Education, Explore Education Statistics, Key stage 2 attainment, 2025/26.
Reading, writing and maths: higher standard
2025/26 (provisional)7%
- England
- 9%
2 percentage points lower than England.
Show the figures as a table
| Year | Walsall | England |
|---|---|---|
| 2021/22 | 5% | 7% |
| 2022/23 | 6% | 8% |
| 2023/24 | 6% | 8% |
| 2024/25 | 6% | 8% |
| 2025/26 (provisional) | 7% | 9% |
Pupils at the end of key stage 2 who met the higher standard in reading, writing and maths combined. Source: Department for Education, Explore Education Statistics, Key stage 2 attainment, 2025/26.
Eligible for free school meals
2024/2535.0%
- England
- 24.7%
10.3 percentage points higher than England.
Show the figures as a table
| Year | Walsall | England |
|---|---|---|
| 2021/22 | 33.1% | 23.1% |
| 2022/23 | 33.8% | 24.0% |
| 2023/24 | 33.2% | 24.3% |
| 2024/25 | 35.0% | 24.7% |
Pupils known to be eligible for free school meals on census day in January. Source: Department for Education, Explore Education Statistics, Schools, pupils and their characteristics, 2024/25.
SEN support
2024/2514.3%
- England
- 15.0%
0.7 percentage points lower than England.
Show the figures as a table
| Year | Walsall | England |
|---|---|---|
| 2021/22 | 14.1% | 13.0% |
| 2022/23 | 14.2% | 13.5% |
| 2023/24 | 13.5% | 14.1% |
| 2024/25 | 14.3% | 15.0% |
Pupils receiving special educational needs support without an education, health and care plan. Source: Department for Education, Explore Education Statistics, Schools, pupils and their characteristics, 2024/25.
Education, health and care plan
2024/254.1%
- England
- 3.5%
0.6 percentage points higher than England.
Show the figures as a table
| Year | Walsall | England |
|---|---|---|
| 2021/22 | 2.1% | 2.3% |
| 2022/23 | 2.7% | 2.5% |
| 2023/24 | 3.7% | 3.0% |
| 2024/25 | 4.1% | 3.5% |
Pupils with an education, health and care plan. Source: Department for Education, Explore Education Statistics, Schools, pupils and their characteristics, 2024/25.
First language other than English
2024/2527.4%
- England
- 23.4%
4.0 percentage points higher than England.
Show the figures as a table
| Year | Walsall | England |
|---|---|---|
| 2021/22 | 25.6% | 21.2% |
| 2022/23 | 26.0% | 22.0% |
| 2023/24 | 26.1% | 22.8% |
| 2024/25 | 27.4% | 23.4% |
Pupils whose first language is known or believed to be other than English. Source: Department for Education, Explore Education Statistics, Schools, pupils and their characteristics, 2024/25.
Pupils per qualified teacher
2025/2620.5
- England
- 21.2
0.7 lower than England.
Show the figures as a table
| Year | Walsall | England |
|---|---|---|
| 2017/18 | 24.5 | 21.3 |
| 2018/19 | 23.6 | 21.4 |
| 2019/20 | 24.0 | 21.4 |
| 2020/21 | 23.1 | 21.1 |
| 2021/22 | 21.3 | 21.0 |
| 2022/23 | 21.2 | 21.1 |
| 2023/24 | 21.6 | 21.2 |
| 2024/25 | 21.3 | 21.3 |
| 2025/26 | 20.5 | 21.2 |
Full-time equivalent pupils for each full-time equivalent qualified teacher. Source: Department for Education, Explore Education Statistics, School workforce in England, 2025/26.
Secondary schools
Overall absence
2024/259.2%
- England
- 8.4%
0.8 percentage points higher than England.
Show the figures as a table
| Year | Walsall | England |
|---|---|---|
| 2017/18 | 5.7% | 5.5% |
| 2018/19 | 5.8% | 5.5% |
| 2020/21 | 6.4% | 5.5% |
| 2021/22 | 9.5% | 9.0% |
| 2022/23 | 9.6% | 9.0% |
| 2023/24 | 9.8% | 8.9% |
| 2024/25 | 9.2% | 8.4% |
Sessions missed for any reason, as a share of all possible sessions in the school year. Source: Department for Education, Explore Education Statistics, Pupil absence in schools in England, 2024/25.
Persistent absence
2024/2527.4%
- England
- 23.4%
4.0 percentage points higher than England.
Show the figures as a table
| Year | Walsall | England |
|---|---|---|
| 2017/18 | 15.0% | 13.9% |
| 2018/19 | 15.1% | 13.7% |
| 2020/21 | 18.3% | 14.8% |
| 2021/22 | 30.6% | 27.7% |
| 2022/23 | 28.9% | 26.5% |
| 2023/24 | 29.5% | 25.6% |
| 2024/25 | 27.4% | 23.4% |
Pupils who missed 10% or more of their possible sessions, as a share of pupils. Source: Department for Education, Explore Education Statistics, Pupil absence in schools in England, 2024/25.
Severe absence
2024/254.4%
- England
- 3.9%
0.5 percentage points higher than England.
Show the figures as a table
| Year | Walsall | England |
|---|---|---|
| 2017/18 | 1.1% | 1.2% |
| 2018/19 | 1.4% | 1.3% |
| 2020/21 | 1.8% | 1.5% |
| 2021/22 | 2.8% | 2.7% |
| 2022/23 | 3.6% | 3.4% |
| 2023/24 | 4.4% | 3.8% |
| 2024/25 | 4.4% | 3.9% |
Pupils who missed 50% or more of their possible sessions, as a share of pupils. Source: Department for Education, Explore Education Statistics, Pupil absence in schools in England, 2024/25.
Suspensions per 100 pupils
2024/2523.68
- England
- 21.24
2.44 higher than England.
Show the figures as a table
| Year | Walsall | England |
|---|---|---|
| 2017/18 | 7.56 | 10.13 |
| 2018/19 | 7.92 | 10.75 |
| 2019/20 | 5.69 | 7.43 |
| 2020/21 | 5.60 | 8.48 |
| 2021/22 | 8.22 | 13.96 |
| 2022/23 | 11.99 | 18.90 |
| 2023/24 | 25.26 | 22.61 |
| 2024/25 | 23.68 | 21.24 |
Suspensions in the school year for every 100 pupils on roll. One pupil can be suspended more than once. Source: Department for Education, Explore Education Statistics, Suspensions and permanent exclusions in England, 2024/25.
Permanent exclusions per 100 pupils
2024/250.13
- England
- 0.23
0.10 lower than England.
Show the figures as a table
| Year | Walsall | England |
|---|---|---|
| 2017/18 | 0.23 | 0.20 |
| 2018/19 | 0.30 | 0.20 |
| 2019/20 | 0.15 | 0.13 |
| 2020/21 | 0.15 | 0.10 |
| 2021/22 | 0.17 | 0.16 |
| 2022/23 | 0.18 | 0.22 |
| 2023/24 | 0.20 | 0.25 |
| 2024/25 | 0.13 | 0.23 |
Permanent exclusions in the school year for every 100 pupils on roll. Source: Department for Education, Explore Education Statistics, Suspensions and permanent exclusions in England, 2024/25.
Attainment 8
2025/26 (provisional)43.8
- England
- 47.4
3.6 lower than England.
Show the figures as a table
| Year | Walsall | England |
|---|---|---|
| 2021/22 | 47.1 | 49.8 |
| 2022/23 | 45.0 | 47.2 |
| 2023/24 | 43.9 | 46.9 |
| 2024/25 | 43.9 | 47.1 |
| 2025/26 (provisional) | 43.8 | 47.4 |
The average of pupils' points across eight GCSE-level qualifications, with English and maths counted twice. Source: Department for Education, Explore Education Statistics, Key stage 4 performance, 2025/26.
English and maths: grade 4 or above
2025/26 (provisional)59%
- England
- 66%
7 percentage points lower than England.
Show the figures as a table
| Year | Walsall | England |
|---|---|---|
| 2021/22 | 64% | 70% |
| 2022/23 | 60% | 67% |
| 2023/24 | 60% | 67% |
| 2024/25 | 58% | 66% |
| 2025/26 (provisional) | 59% | 66% |
Pupils at the end of key stage 4 with grade 4 or above in both English and maths. Source: Department for Education, Explore Education Statistics, Key stage 4 performance, 2025/26.
English and maths: grade 5 or above
2025/26 (provisional)39%
- England
- 48%
9 percentage points lower than England.
Show the figures as a table
| Year | Walsall | England |
|---|---|---|
| 2021/22 | 45% | 51% |
| 2022/23 | 40% | 46% |
| 2023/24 | 39% | 47% |
| 2024/25 | 40% | 47% |
| 2025/26 (provisional) | 39% | 48% |
Pupils at the end of key stage 4 with grade 5 or above in both English and maths. Source: Department for Education, Explore Education Statistics, Key stage 4 performance, 2025/26.
Eligible for free school meals
2024/2537.7%
- England
- 25.8%
11.9 percentage points higher than England.
Show the figures as a table
| Year | Walsall | England |
|---|---|---|
| 2021/22 | 30.2% | 20.9% |
| 2022/23 | 32.6% | 22.7% |
| 2023/24 | 34.6% | 24.1% |
| 2024/25 | 37.7% | 25.8% |
Pupils known to be eligible for free school meals on census day in January. Source: Department for Education, Explore Education Statistics, Schools, pupils and their characteristics, 2024/25.
SEN support
2024/2512.9%
- England
- 13.4%
0.5 percentage points lower than England.
Show the figures as a table
| Year | Walsall | England |
|---|---|---|
| 2021/22 | 11.6% | 11.9% |
| 2022/23 | 12.0% | 12.4% |
| 2023/24 | 12.6% | 12.9% |
| 2024/25 | 12.9% | 13.4% |
Pupils receiving special educational needs support without an education, health and care plan. Source: Department for Education, Explore Education Statistics, Schools, pupils and their characteristics, 2024/25.
Education, health and care plan
2024/252.8%
- England
- 3.1%
0.3 percentage points lower than England.
Show the figures as a table
| Year | Walsall | England |
|---|---|---|
| 2021/22 | 1.9% | 2.2% |
| 2022/23 | 2.1% | 2.4% |
| 2023/24 | 2.6% | 2.7% |
| 2024/25 | 2.8% | 3.1% |
Pupils with an education, health and care plan. Source: Department for Education, Explore Education Statistics, Schools, pupils and their characteristics, 2024/25.
First language other than English
2024/2521.4%
- England
- 19.2%
2.2 percentage points higher than England.
Show the figures as a table
| Year | Walsall | England |
|---|---|---|
| 2021/22 | 20.5% | 17.5% |
| 2022/23 | 20.9% | 18.1% |
| 2023/24 | 21.4% | 18.6% |
| 2024/25 | 21.4% | 19.2% |
Pupils whose first language is known or believed to be other than English. Source: Department for Education, Explore Education Statistics, Schools, pupils and their characteristics, 2024/25.
Pupils per qualified teacher
2025/2616.4
- England
- 17.3
0.9 lower than England.
Show the figures as a table
| Year | Walsall | England |
|---|---|---|
| 2017/18 | 16.2 | 16.5 |
| 2018/19 | 16.3 | 16.8 |
| 2019/20 | 16.6 | 17.2 |
| 2020/21 | 17.1 | 17.1 |
| 2021/22 | 16.4 | 17.1 |
| 2022/23 | 16.5 | 17.2 |
| 2023/24 | 16.8 | 17.4 |
| 2024/25 | 16.6 | 17.3 |
| 2025/26 | 16.4 | 17.3 |
Full-time equivalent pupils for each full-time equivalent qualified teacher. Source: Department for Education, Explore Education Statistics, School workforce in England, 2025/26.
Special schools
Overall absence
2024/2510.5%
- England
- 12.8%
2.3 percentage points lower than England.
Show the figures as a table
| Year | Walsall | England |
|---|---|---|
| 2017/18 | 9.3% | 10.2% |
| 2018/19 | 9.9% | 10.1% |
| 2020/21 | 20.9% | 15.2% |
| 2021/22 | 12.3% | 13.2% |
| 2022/23 | 12.6% | 13.0% |
| 2023/24 | 11.3% | 13.0% |
| 2024/25 | 10.5% | 12.8% |
Sessions missed for any reason, as a share of all possible sessions in the school year. Source: Department for Education, Explore Education Statistics, Pupil absence in schools in England, 2024/25.
Persistent absence
2024/2533.1%
- England
- 35.3%
2.2 percentage points lower than England.
Show the figures as a table
| Year | Walsall | England |
|---|---|---|
| 2017/18 | 31.4% | 29.6% |
| 2018/19 | 29.9% | 28.8% |
| 2020/21 | 73.5% | 48.9% |
| 2021/22 | 37.9% | 40.4% |
| 2022/23 | 37.6% | 38.3% |
| 2023/24 | 35.6% | 37.2% |
| 2024/25 | 33.1% | 35.3% |
Pupils who missed 10% or more of their possible sessions, as a share of pupils. Source: Department for Education, Explore Education Statistics, Pupil absence in schools in England, 2024/25.
Severe absence
2024/252.8%
- England
- 6.9%
4.1 percentage points lower than England.
Show the figures as a table
| Year | Walsall | England |
|---|---|---|
| 2017/18 | 2.9% | 4.4% |
| 2018/19 | 2.8% | 4.6% |
| 2020/21 | 6.0% | 5.6% |
| 2021/22 | 5.3% | 5.8% |
| 2022/23 | 4.8% | 6.2% |
| 2023/24 | 3.8% | 6.7% |
| 2024/25 | 2.8% | 6.9% |
Pupils who missed 50% or more of their possible sessions, as a share of pupils. Source: Department for Education, Explore Education Statistics, Pupil absence in schools in England, 2024/25.
Suspensions per 100 pupils
2024/254.50
- England
- 12.32
7.82 lower than England.
Show the figures as a table
| Year | Walsall | England |
|---|---|---|
| 2017/18 | 8.00 | 12.34 |
| 2018/19 | 12.48 | 11.32 |
| 2019/20 | 5.92 | 7.76 |
| 2020/21 | 6.81 | 7.29 |
| 2021/22 | 6.58 | 9.60 |
| 2022/23 | 8.94 | 10.99 |
| 2023/24 | 7.57 | 12.62 |
| 2024/25 | 4.50 | 12.32 |
Suspensions in the school year for every 100 pupils on roll. One pupil can be suspended more than once. Source: Department for Education, Explore Education Statistics, Suspensions and permanent exclusions in England, 2024/25.
Permanent exclusions per 100 pupils
2024/250.00
- England
- 0.08
0.08 lower than England.
Show the figures as a table
| Year | Walsall | England |
|---|---|---|
| 2017/18 | 0.15 | 0.07 |
| 2018/19 | 0.14 | 0.06 |
| 2019/20 | 0.00 | 0.04 |
| 2020/21 | 0.13 | 0.03 |
| 2021/22 | 0.12 | 0.05 |
| 2022/23 | 0.11 | 0.08 |
| 2023/24 | 0.10 | 0.08 |
| 2024/25 | 0.00 | 0.08 |
Permanent exclusions in the school year for every 100 pupils on roll. Source: Department for Education, Explore Education Statistics, Suspensions and permanent exclusions in England, 2024/25.
Eligible for free school meals
2024/2558.4%
- England
- 48.8%
9.6 percentage points higher than England.
Show the figures as a table
| Year | Walsall | England |
|---|---|---|
| 2021/22 | 54.3% | 44.4% |
| 2022/23 | 57.4% | 45.6% |
| 2023/24 | 58.1% | 47.1% |
| 2024/25 | 58.4% | 48.8% |
Pupils known to be eligible for free school meals on census day in January. Source: Department for Education, Explore Education Statistics, Schools, pupils and their characteristics, 2024/25.
SEN support
2024/250.0%
- England
- 0.5%
0.5 percentage points lower than England.
Show the figures as a table
| Year | Walsall | England |
|---|---|---|
| 2021/22 | 0.7% | 0.9% |
| 2022/23 | 0.1% | 0.8% |
| 2023/24 | 0.0% | 0.7% |
| 2024/25 | 0.0% | 0.5% |
Pupils receiving special educational needs support without an education, health and care plan. Source: Department for Education, Explore Education Statistics, Schools, pupils and their characteristics, 2024/25.
Education, health and care plan
2024/25100.0%
- England
- 99.5%
0.5 percentage points higher than England.
Show the figures as a table
| Year | Walsall | England |
|---|---|---|
| 2021/22 | 99.3% | 99.1% |
| 2022/23 | 99.9% | 99.2% |
| 2023/24 | 100.0% | 99.3% |
| 2024/25 | 100.0% | 99.5% |
Pupils with an education, health and care plan. Source: Department for Education, Explore Education Statistics, Schools, pupils and their characteristics, 2024/25.
First language other than English
2024/2517.8%
- England
- 14.4%
3.4 percentage points higher than England.
Show the figures as a table
| Year | Walsall | England |
|---|---|---|
| 2021/22 | 16.8% | 14.5% |
| 2022/23 | 17.1% | 14.4% |
| 2023/24 | 17.5% | 14.4% |
| 2024/25 | 17.8% | 14.4% |
Pupils whose first language is known or believed to be other than English. Source: Department for Education, Explore Education Statistics, Schools, pupils and their characteristics, 2024/25.
Pupils per qualified teacher
2025/267.1
- England
- 7.3
0.2 lower than England.
Show the figures as a table
| Year | Walsall | England |
|---|---|---|
| 2017/18 | 8.0 | 6.7 |
| 2018/19 | 8.8 | 6.8 |
| 2019/20 | 8.4 | 7.0 |
| 2020/21 | 7.4 | 6.8 |
| 2021/22 | 6.9 | 6.9 |
| 2022/23 | 6.7 | 7.0 |
| 2023/24 | 7.5 | 7.1 |
| 2024/25 | 7.2 | 7.3 |
| 2025/26 | 7.1 | 7.3 |
Full-time equivalent pupils for each full-time equivalent qualified teacher. Source: Department for Education, Explore Education Statistics, School workforce in England, 2025/26.
Schools in Walsall
Listed by name. Filter by phase or type; sort by name or size. Nothing here is sorted by results.
Showing 122 of 122 schools in Walsall.
| School | Phase | Type | Town | Pupils |
|---|---|---|---|---|
| Abbey Primary School | Primary | Academy | Walsall | 223 |
| Aldridge School - A Science College | Secondary | Academy | Walsall | 1,629 |
| All Saints National Academy | Primary | Academy | Walsall | 208 |
| Alumwell Infant School | Primary | Maintained | Walsall | 267 |
| Alumwell Junior School | Primary | Maintained | Walsall | 360 |
| Alumwell Nursery School | Nursery | Maintained | Walsall | 131 |
| Barcroft Academy | Primary | Academy | Willenhall | 453 |
| Barr Beacon School | Secondary | Academy | Walsall | 1,469 |
| Beacon Academy | Primary | Academy | Walsall | 488 |
| Bentley West Primary School | Primary | Academy | Walsall | 436 |
| Birchills Church of England Community Academy | Primary | Academy | Walsall | 442 |
| Blackwood School | Primary | Academy | Sutton Coldfield | 677 |
| Bloxwich Academy | All-through | Academy | Walsall | 1,383 |
| Blue Coat Church of England Academy | Secondary | Academy | Walsall | 972 |
| Blue Coat Church of England Aided Infant School | Primary | Maintained | Walsall | 314 |
| Blue Coat Church of England Aided Junior School | Primary | Maintained | Walsall | 366 |
| Brownhills Ormiston Academy | Secondary | Academy | Walsall | 778 |
| Brownhills West Primary School | Primary | Academy | Walsall | 190 |
| Busill Jones Primary School | Primary | Academy | Walsall | 235 |
| Butts Primary School | Primary | Maintained | Walsall | 241 |
| Caldmore Primary Academy | Primary | Academy | Walsall | 436 |
| Castle School | Special | Maintained special | Walsall | 247 |
| Castlefort Academy | Primary | Academy | Walsall | 225 |
| Christ Church Church of England Primary School | Primary | Academy | WALSALL | 459 |
| Chuckery Primary School | Primary | Maintained | Walsall | 465 |
| Cooper and Jordan Church of England Primary School | Primary | Maintained | Walsall | 478 |
| County Bridge Primary School | Primary | Maintained | Walsall | 229 |
| Croft Academy | Primary | Academy | Walsall | 246 |
| Delves Infant School | Primary | Academy | Walsall | 335 |
| Delves Junior School | Primary | Academy | Walsall | 365 |
| Edgar Stammers Primary Academy | Primary | Academy | Walsall | 328 |
| Elmore Green Primary School | Primary | Maintained | Walsall | 314 |
| Elmwood School | Special | Academy | Walsall | 85 |
| Fibbersley Park Academy | Primary | Academy | Willenhall | 619 |
| Field Road Academy | Primary | Academy | Walsall | 214 |
| Fullbrook Nursery School | Nursery | Maintained | Walsall | 120 |
| Goldsmith Primary Academy | Primary | Academy | Harden | 482 |
| Grace Academy Darlaston | Secondary | Academy | Wednesbury | 1,059 |
| Greenfield Primary School | Primary | Academy | Walsall | 244 |
| Hillary Primary School | Primary | Academy | Walsall | 675 |
| Holy Trinity Church of England Primary School | Primary | Maintained | Walsall | 197 |
| Jane Lane School | Special | Maintained special | Walsall | 195 |
| Joseph Leckie Academy | Secondary | Academy | Walsall | 1,524 |
| Jubilee Academy Mossley | Primary | Academy | Walsall | 170 |
| King Charles Primary School | Primary | Maintained | Walsall | 436 |
| Kings Hill Primary School | Primary | Maintained | Wednesbury | 459 |
| Lane Head Nursery School | Nursery | Maintained | Willenhall | 75 |
| Leamore Primary School | Primary | Maintained | Walsall | 236 |
| Leighswood School | Primary | Maintained | Walsall | 442 |
| Lindens Academy | Primary | Academy | Sutton Coldfield | 457 |
| Little Bloxwich CofE VC Primary School | Primary | Academy | Walsall | Not published |
| Lodge Farm Primary School | Primary | Academy | Willenhall | 376 |
| Lower Farm Primary School | Primary | Maintained | Walsall | 463 |
| Manor Primary School | Primary | Maintained | Sutton Coldfield | 411 |
| Mary Elliot Academy | Special | Academy | Walsall | 148 |
| Meadow View Academy | Primary | Academy | Birmingham | 467 |
| Millfield Primary School | Primary | Maintained | Walsall | 217 |
| Millfields Nursery School | Nursery | Maintained | Walsall | 81 |
| Moorcroft Wood Academy | Primary | Academy | Walsall | 260 |
| New Invention Infant School | Primary | Maintained | Willenhall | 320 |
| New Invention Learning Academy | Primary | Academy | Willenhall | 362 |
| New Leaf School | Alternative provision | Academy | Walsall | 20 |
| North Walsall Primary Academy | Primary | Academy | Walsall | 234 |
| Oakwood School | Special | Academy | Walsall | 272 |
| Ogley Hay Nursery School | Nursery | Maintained | Walsall | 92 |
| Old Church Church of England C Primary School | Primary | Academy | Wednesbury | 431 |
| Old Hall School | Special | Maintained special | Walsall | 134 |
| Ormiston Shelfield Community Academy | Secondary | Academy | Walsall | 1,419 |
| Palfrey Infant School | Primary | Academy | Walsall | 310 |
| Palfrey Junior School | Primary | Maintained | Walsall | 359 |
| Park Hall Infant Academy | Primary | Academy | Walsall | 310 |
| Park Hall Junior Academy | Primary | Academy | Walsall | 409 |
| Pelsall Village School | Primary | Maintained | Walsall | 259 |
| Pheasey Park Farm Primary School and Early Years Centre | Primary | Academy | Birmingham | 621 |
| Phoenix Academy | Special | Academy | Walsall | 50 |
| Pinfold Street Primary School | Primary | Maintained | Wednesbury | 410 |
| Pool Hayes Academy | Secondary | Academy | Willenhall | 1,162 |
| Pool Hayes Primary School | Primary | Academy | Willenhall | Not published |
| Queen Mary's Grammar School | Secondary | Academy | Walsall | 1,399 |
| Queen Mary's High School | Secondary | Academy | Walsall | 949 |
| Radleys Primary School | Primary | Maintained | Walsall | 223 |
| Reedswood E-ACT Academy | Primary | Academy | Walsall | 478 |
| Rivers Primary Academy | Primary | Academy | Walsall | 463 |
| Rosedale Church of England C Infant School | Primary | Maintained | Willenhall | 199 |
| Rowley View Nursery School | Nursery | Maintained | Wednesbury | 105 |
| Rushall Primary School | Primary | Academy | Walsall | 260 |
| Ryders Hayes School | Primary | Academy | Walsall | 463 |
| Salisbury Primary School | Primary | Maintained | Wednesbury | 317 |
| Sandbank Nursery School | Nursery | Maintained | Walsall | 164 |
| Shepwell Short Stay School (PRU-Medical) | Alternative provision | Maintained | Willenhall | 66 |
| Shire Oak Academy | Secondary | Academy | Walsall | 1,149 |
| Short Heath Junior School | Primary | Maintained | Willenhall | 305 |
| St Anne's Catholic Primary School, Streetly | Primary | Maintained | Sutton Coldfield | 242 |
| St Bernadette's Catholic Primary School | Primary | Academy | Walsall | 104 |
| St Francis Catholic Primary School | Primary | Maintained | Walsall | 207 |
| St Francis of Assisi Catholic College | Secondary | Maintained | Walsall | 1,109 |
| St Giles Church of England Primary School | Primary | Maintained | Willenhall | 449 |
| St James Academy | Primary | Academy | Walsall | 220 |
| St John's Church of England Primary School | Primary | Maintained | Walsall | 340 |
| St Joseph's Catholic Primary School, Darlaston | Primary | Maintained | Wednesbury | 245 |
| St Mary of the Angels Catholic Primary School | Primary | Maintained | Walsall | 239 |
| St Mary's The Mount Catholic Primary School | Primary | Maintained | Walsall | 235 |
| St Michael's Church of England C Primary School | Primary | Maintained | Walsall | 460 |
| St Patrick's Catholic Primary School, Walsall | Primary | Maintained | Walsall | 223 |
| St Peter's Catholic Primary School, Bloxwich | Primary | Maintained | Walsall | 214 |
| St Thomas More Catholic School, Willenhall | Secondary | Maintained | Willenhall | 1,464 |
| St Thomas of Canterbury Catholic Primary School | Primary | Maintained | Walsall | 296 |
| Sunshine Academy | Primary | Academy | Walsall | 150 |
| The Ladder School | Alternative provision | Free school | Walsall | 62 |
| The Streetly Academy | Secondary | Academy | Sutton Coldfield | 1,544 |
| Valley Nursery School | Nursery | Maintained | Walsall | 170 |
| Walsall Academy | Secondary | Academy | Walsall | 1,423 |
| Walsall Studio School | Secondary | Free school | Walsall | 206 |
| Walsall Wood School | Primary | Academy | Walsall | 231 |
| Watling Street Primary School | Primary | Maintained | Walsall | 235 |
| West Walsall E-ACT Academy | Secondary | Academy | Walsall | 1,186 |
| Whetstone Field Primary School | Primary | Maintained | Walsall | 229 |
| Whitehall Junior Community School | Primary | Maintained | Walsall | 340 |
| Whitehall Nursery and Infant Academy | Primary | Academy | Walsall | 313 |
| Willenhall E-ACT Academy | Secondary | Academy | Willenhall | 1,106 |
| Woodlands Academy of Learning | Primary | Academy | Willenhall | 446 |
| Woods Bank Academy | Primary | Academy | Wednesbury | 303 |