Trafford
90 state-funded schools with 42,965 pupils on roll, in the North West region. Every school’s page has its published figures against Trafford and England.
- Primary
- 63
- Secondary
- 19
- Special
- 7
- Alternative provision
- 1
- Maintained
- 50
- Academies
- 35
- Maintained special
- 3
- Free schools
- 2
Map
Zoom in to see each school. Open the full map
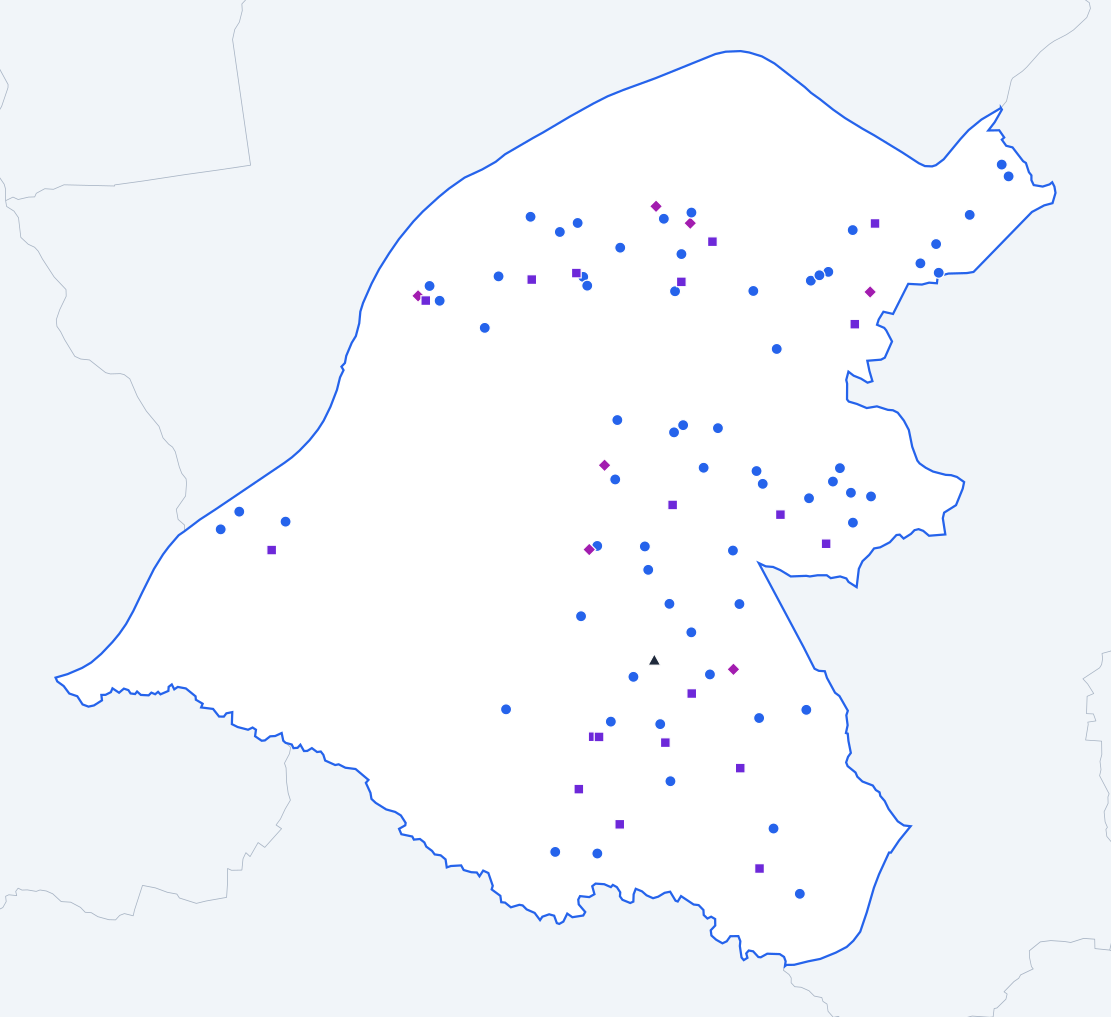
ONS, OS © Crown copyright 2025 · GIAS · © OpenStreetMap
Trafford against England
Published figures for the authority’s schools, set against the same kind of school across England.
All state-funded schools
Overall absence
2024/255.4%
- England
- 6.8%
1.4 percentage points lower than England.
Show the figures as a table
| Year | Trafford | England |
|---|---|---|
| 2017/18 | 4.2% | 4.8% |
| 2018/19 | 3.9% | 4.7% |
| 2020/21 | 3.9% | 4.6% |
| 2021/22 | 6.4% | 7.6% |
| 2022/23 | 5.9% | 7.4% |
| 2023/24 | 5.8% | 7.1% |
| 2024/25 | 5.4% | 6.8% |
Sessions missed for any reason, as a share of all possible sessions in the school year. Source: Department for Education, Explore Education Statistics, Pupil absence in schools in England, 2024/25.
Persistent absence
2024/2512.6%
- England
- 18.1%
5.5 percentage points lower than England.
Show the figures as a table
| Year | Trafford | England |
|---|---|---|
| 2017/18 | 8.5% | 11.2% |
| 2018/19 | 7.9% | 10.9% |
| 2020/21 | 9.8% | 12.1% |
| 2021/22 | 17.6% | 22.5% |
| 2022/23 | 14.9% | 21.2% |
| 2023/24 | 14.3% | 20.0% |
| 2024/25 | 12.6% | 18.1% |
Pupils who missed 10% or more of their possible sessions, as a share of pupils. Source: Department for Education, Explore Education Statistics, Pupil absence in schools in England, 2024/25.
Severe absence
2024/251.3%
- England
- 2.4%
1.1 percentage points lower than England.
Show the figures as a table
| Year | Trafford | England |
|---|---|---|
| 2017/18 | 0.3% | 0.8% |
| 2018/19 | 0.5% | 0.8% |
| 2020/21 | 0.7% | 1.1% |
| 2021/22 | 0.9% | 1.7% |
| 2022/23 | 1.1% | 2.0% |
| 2023/24 | 1.3% | 2.3% |
| 2024/25 | 1.3% | 2.4% |
Pupils who missed 50% or more of their possible sessions, as a share of pupils. Source: Department for Education, Explore Education Statistics, Pupil absence in schools in England, 2024/25.
Suspensions per 100 pupils
2024/253.77
- England
- 10.88
7.11 lower than England.
Show the figures as a table
| Year | Trafford | England |
|---|---|---|
| 2017/18 | 2.89 | 5.08 |
| 2018/19 | 3.01 | 5.36 |
| 2019/20 | 2.20 | 3.76 |
| 2020/21 | 2.40 | 4.25 |
| 2021/22 | 3.58 | 6.91 |
| 2022/23 | 3.93 | 9.33 |
| 2023/24 | 4.34 | 11.31 |
| 2024/25 | 3.77 | 10.88 |
Suspensions in the school year for every 100 pupils on roll. One pupil can be suspended more than once. Source: Department for Education, Explore Education Statistics, Suspensions and permanent exclusions in England, 2024/25.
Permanent exclusions per 100 pupils
2024/250.11
- England
- 0.12
0.01 lower than England.
Show the figures as a table
| Year | Trafford | England |
|---|---|---|
| 2017/18 | 0.16 | 0.10 |
| 2018/19 | 0.13 | 0.10 |
| 2019/20 | 0.08 | 0.06 |
| 2020/21 | 0.04 | 0.05 |
| 2021/22 | 0.10 | 0.08 |
| 2022/23 | 0.12 | 0.11 |
| 2023/24 | 0.12 | 0.13 |
| 2024/25 | 0.11 | 0.12 |
Permanent exclusions in the school year for every 100 pupils on roll. Source: Department for Education, Explore Education Statistics, Suspensions and permanent exclusions in England, 2024/25.
Eligible for free school meals
2024/2517.2%
- England
- 25.7%
8.5 percentage points lower than England.
Show the figures as a table
| Year | Trafford | England |
|---|---|---|
| 2021/22 | 14.6% | 22.5% |
| 2022/23 | 15.3% | 23.8% |
| 2023/24 | 16.2% | 24.6% |
| 2024/25 | 17.2% | 25.7% |
Pupils known to be eligible for free school meals on census day in January. Source: Department for Education, Explore Education Statistics, Schools, pupils and their characteristics, 2024/25.
SEN support
2024/2511.4%
- England
- 14.0%
2.6 percentage points lower than England.
Show the figures as a table
| Year | Trafford | England |
|---|---|---|
| 2021/22 | 10.0% | 12.4% |
| 2022/23 | 10.4% | 12.9% |
| 2023/24 | 10.8% | 13.4% |
| 2024/25 | 11.4% | 14.0% |
Pupils receiving special educational needs support without an education, health and care plan. Source: Department for Education, Explore Education Statistics, Schools, pupils and their characteristics, 2024/25.
Education, health and care plan
2024/255.1%
- England
- 5.2%
0.1 percentage points lower than England.
Show the figures as a table
| Year | Trafford | England |
|---|---|---|
| 2021/22 | 3.9% | 3.8% |
| 2022/23 | 4.4% | 4.2% |
| 2023/24 | 4.8% | 4.7% |
| 2024/25 | 5.1% | 5.2% |
Pupils with an education, health and care plan. Source: Department for Education, Explore Education Statistics, Schools, pupils and their characteristics, 2024/25.
First language other than English
2024/2523.8%
- England
- 21.4%
2.4 percentage points higher than England.
Show the figures as a table
| Year | Trafford | England |
|---|---|---|
| 2021/22 | 19.3% | 19.6% |
| 2022/23 | 21.8% | 20.2% |
| 2023/24 | 23.4% | 20.8% |
| 2024/25 | 23.8% | 21.4% |
Pupils whose first language is known or believed to be other than English. Source: Department for Education, Explore Education Statistics, Schools, pupils and their characteristics, 2024/25.
Pupils per qualified teacher
2025/2618.2
- England
- 18.5
0.3 lower than England.
Show the figures as a table
| Year | Trafford | England |
|---|---|---|
| 2017/18 | 18.5 | 18.4 |
| 2018/19 | 18.7 | 18.6 |
| 2019/20 | 18.6 | 18.8 |
| 2020/21 | 18.3 | 18.5 |
| 2021/22 | 18.3 | 18.5 |
| 2022/23 | 18.1 | 18.5 |
| 2023/24 | 18.3 | 18.6 |
| 2024/25 | 18.3 | 18.6 |
| 2025/26 | 18.2 | 18.5 |
Full-time equivalent pupils for each full-time equivalent qualified teacher. Source: Department for Education, Explore Education Statistics, School workforce in England, 2025/26.
Teacher sickness absence
2024/254.6 days
- England
- 5.0 days
0.4 days lower than England.
Show the figures as a table
| Year | Trafford | England |
|---|---|---|
| 2017/18 | 3.7 days | 4.0 days |
| 2018/19 | 3.3 days | 4.0 days |
| 2019/20 | Not published | Not published |
| 2020/21 | 3.0 days | 3.9 days |
| 2021/22 | 6.6 days | 6.3 days |
| 2022/23 | 4.9 days | 5.2 days |
| 2023/24 | 4.8 days | 5.3 days |
| 2024/25 | 4.6 days | 5.0 days |
Days lost to sickness absence in the school year, averaged across all teachers. Source: Department for Education, Explore Education Statistics, School workforce in England, 2024/25.
Primary schools
Overall absence
2024/254.2%
- England
- 5.2%
1.0 percentage point lower than England.
Show the figures as a table
| Year | Trafford | England |
|---|---|---|
| 2017/18 | 3.7% | 4.2% |
| 2018/19 | 3.2% | 4.0% |
| 2020/21 | 2.9% | 3.6% |
| 2021/22 | 5.4% | 6.3% |
| 2022/23 | 4.8% | 5.9% |
| 2023/24 | 4.6% | 5.5% |
| 2024/25 | 4.2% | 5.2% |
Sessions missed for any reason, as a share of all possible sessions in the school year. Source: Department for Education, Explore Education Statistics, Pupil absence in schools in England, 2024/25.
Persistent absence
2024/259.2%
- England
- 13.0%
3.8 percentage points lower than England.
Show the figures as a table
| Year | Trafford | England |
|---|---|---|
| 2017/18 | 6.5% | 8.7% |
| 2018/19 | 5.5% | 8.2% |
| 2020/21 | 5.6% | 8.8% |
| 2021/22 | 13.4% | 17.7% |
| 2022/23 | 11.4% | 16.2% |
| 2023/24 | 10.5% | 14.6% |
| 2024/25 | 9.2% | 13.0% |
Pupils who missed 10% or more of their possible sessions, as a share of pupils. Source: Department for Education, Explore Education Statistics, Pupil absence in schools in England, 2024/25.
Severe absence
2024/250.4%
- England
- 0.9%
0.5 percentage points lower than England.
Show the figures as a table
| Year | Trafford | England |
|---|---|---|
| 2017/18 | 0.1% | 0.4% |
| 2018/19 | 0.1% | 0.4% |
| 2020/21 | 0.4% | 0.7% |
| 2021/22 | 0.3% | 0.6% |
| 2022/23 | 0.4% | 0.7% |
| 2023/24 | 0.4% | 0.9% |
| 2024/25 | 0.4% | 0.9% |
Pupils who missed 50% or more of their possible sessions, as a share of pupils. Source: Department for Education, Explore Education Statistics, Pupil absence in schools in England, 2024/25.
Suspensions per 100 pupils
2024/250.84
- England
- 2.47
1.63 lower than England.
Show the figures as a table
| Year | Trafford | England |
|---|---|---|
| 2017/18 | 0.39 | 1.40 |
| 2018/19 | 0.38 | 1.41 |
| 2019/20 | 0.43 | 1.00 |
| 2020/21 | 0.38 | 0.99 |
| 2021/22 | 0.46 | 1.42 |
| 2022/23 | 0.64 | 1.81 |
| 2023/24 | 1.02 | 2.27 |
| 2024/25 | 0.84 | 2.47 |
Suspensions in the school year for every 100 pupils on roll. One pupil can be suspended more than once. Source: Department for Education, Explore Education Statistics, Suspensions and permanent exclusions in England, 2024/25.
Permanent exclusions per 100 pupils
2024/250.01
- England
- 0.03
0.02 lower than England.
Show the figures as a table
| Year | Trafford | England |
|---|---|---|
| 2017/18 | 0.00 | 0.03 |
| 2018/19 | 0.01 | 0.02 |
| 2019/20 | 0.00 | 0.02 |
| 2020/21 | 0.00 | 0.01 |
| 2021/22 | 0.00 | 0.02 |
| 2022/23 | 0.02 | 0.03 |
| 2023/24 | 0.01 | 0.03 |
| 2024/25 | 0.01 | 0.03 |
Permanent exclusions in the school year for every 100 pupils on roll. Source: Department for Education, Explore Education Statistics, Suspensions and permanent exclusions in England, 2024/25.
Reading, writing and maths: expected standard
2025/26 (provisional)71%
- England
- 63%
8 percentage points higher than England.
Show the figures as a table
| Year | Trafford | England |
|---|---|---|
| 2021/22 | 67% | 59% |
| 2022/23 | 69% | 60% |
| 2023/24 | 70% | 61% |
| 2024/25 | 72% | 63% |
| 2025/26 (provisional) | 71% | 63% |
Pupils at the end of key stage 2 who met the expected standard in reading, writing and maths combined. Source: Department for Education, Explore Education Statistics, Key stage 2 attainment, 2025/26.
Reading, writing and maths: higher standard
2025/26 (provisional)15%
- England
- 9%
6 percentage points higher than England.
Show the figures as a table
| Year | Trafford | England |
|---|---|---|
| 2021/22 | 12% | 7% |
| 2022/23 | 14% | 8% |
| 2023/24 | 14% | 8% |
| 2024/25 | 15% | 8% |
| 2025/26 (provisional) | 15% | 9% |
Pupils at the end of key stage 2 who met the higher standard in reading, writing and maths combined. Source: Department for Education, Explore Education Statistics, Key stage 2 attainment, 2025/26.
Eligible for free school meals
2024/2517.0%
- England
- 24.7%
7.7 percentage points lower than England.
Show the figures as a table
| Year | Trafford | England |
|---|---|---|
| 2021/22 | 14.7% | 23.1% |
| 2022/23 | 15.4% | 24.0% |
| 2023/24 | 16.0% | 24.3% |
| 2024/25 | 17.0% | 24.7% |
Pupils known to be eligible for free school meals on census day in January. Source: Department for Education, Explore Education Statistics, Schools, pupils and their characteristics, 2024/25.
SEN support
2024/2512.4%
- England
- 15.0%
2.6 percentage points lower than England.
Show the figures as a table
| Year | Trafford | England |
|---|---|---|
| 2021/22 | 10.7% | 13.0% |
| 2022/23 | 11.1% | 13.5% |
| 2023/24 | 11.5% | 14.1% |
| 2024/25 | 12.4% | 15.0% |
Pupils receiving special educational needs support without an education, health and care plan. Source: Department for Education, Explore Education Statistics, Schools, pupils and their characteristics, 2024/25.
Education, health and care plan
2024/253.1%
- England
- 3.5%
0.4 percentage points lower than England.
Show the figures as a table
| Year | Trafford | England |
|---|---|---|
| 2021/22 | 2.1% | 2.3% |
| 2022/23 | 2.4% | 2.5% |
| 2023/24 | 2.8% | 3.0% |
| 2024/25 | 3.1% | 3.5% |
Pupils with an education, health and care plan. Source: Department for Education, Explore Education Statistics, Schools, pupils and their characteristics, 2024/25.
First language other than English
2024/2527.2%
- England
- 23.4%
3.8 percentage points higher than England.
Show the figures as a table
| Year | Trafford | England |
|---|---|---|
| 2021/22 | 23.4% | 21.2% |
| 2022/23 | 25.4% | 22.0% |
| 2023/24 | 27.2% | 22.8% |
| 2024/25 | 27.2% | 23.4% |
Pupils whose first language is known or believed to be other than English. Source: Department for Education, Explore Education Statistics, Schools, pupils and their characteristics, 2024/25.
Pupils per qualified teacher
2025/2621.4
- England
- 21.2
0.2 higher than England.
Show the figures as a table
| Year | Trafford | England |
|---|---|---|
| 2017/18 | 22.7 | 21.3 |
| 2018/19 | 22.4 | 21.4 |
| 2019/20 | 22.4 | 21.4 |
| 2020/21 | 21.9 | 21.1 |
| 2021/22 | 22.1 | 21.0 |
| 2022/23 | 21.7 | 21.1 |
| 2023/24 | 21.7 | 21.2 |
| 2024/25 | 21.6 | 21.3 |
| 2025/26 | 21.4 | 21.2 |
Full-time equivalent pupils for each full-time equivalent qualified teacher. Source: Department for Education, Explore Education Statistics, School workforce in England, 2025/26.
Secondary schools
Overall absence
2024/256.5%
- England
- 8.4%
1.9 percentage points lower than England.
Show the figures as a table
| Year | Trafford | England |
|---|---|---|
| 2017/18 | 4.6% | 5.5% |
| 2018/19 | 4.6% | 5.5% |
| 2020/21 | 4.8% | 5.5% |
| 2021/22 | 7.4% | 9.0% |
| 2022/23 | 6.9% | 9.0% |
| 2023/24 | 6.9% | 8.9% |
| 2024/25 | 6.5% | 8.4% |
Sessions missed for any reason, as a share of all possible sessions in the school year. Source: Department for Education, Explore Education Statistics, Pupil absence in schools in England, 2024/25.
Persistent absence
2024/2515.5%
- England
- 23.4%
7.9 percentage points lower than England.
Show the figures as a table
| Year | Trafford | England |
|---|---|---|
| 2017/18 | 10.3% | 13.9% |
| 2018/19 | 10.0% | 13.7% |
| 2020/21 | 13.5% | 14.8% |
| 2021/22 | 21.9% | 27.7% |
| 2022/23 | 18.1% | 26.5% |
| 2023/24 | 17.7% | 25.6% |
| 2024/25 | 15.5% | 23.4% |
Pupils who missed 10% or more of their possible sessions, as a share of pupils. Source: Department for Education, Explore Education Statistics, Pupil absence in schools in England, 2024/25.
Severe absence
2024/252.2%
- England
- 3.9%
1.7 percentage points lower than England.
Show the figures as a table
| Year | Trafford | England |
|---|---|---|
| 2017/18 | 0.5% | 1.2% |
| 2018/19 | 0.8% | 1.3% |
| 2020/21 | 0.7% | 1.5% |
| 2021/22 | 1.5% | 2.7% |
| 2022/23 | 1.7% | 3.4% |
| 2023/24 | 2.1% | 3.8% |
| 2024/25 | 2.2% | 3.9% |
Pupils who missed 50% or more of their possible sessions, as a share of pupils. Source: Department for Education, Explore Education Statistics, Pupil absence in schools in England, 2024/25.
Suspensions per 100 pupils
2024/256.78
- England
- 21.24
14.46 lower than England.
Show the figures as a table
| Year | Trafford | England |
|---|---|---|
| 2017/18 | 5.22 | 10.13 |
| 2018/19 | 5.59 | 10.75 |
| 2019/20 | 3.75 | 7.43 |
| 2020/21 | 4.69 | 8.48 |
| 2021/22 | 7.04 | 13.96 |
| 2022/23 | 7.55 | 18.90 |
| 2023/24 | 7.71 | 22.61 |
| 2024/25 | 6.78 | 21.24 |
Suspensions in the school year for every 100 pupils on roll. One pupil can be suspended more than once. Source: Department for Education, Explore Education Statistics, Suspensions and permanent exclusions in England, 2024/25.
Permanent exclusions per 100 pupils
2024/250.23
- England
- 0.23
The same as England.
Show the figures as a table
| Year | Trafford | England |
|---|---|---|
| 2017/18 | 0.38 | 0.20 |
| 2018/19 | 0.29 | 0.20 |
| 2019/20 | 0.18 | 0.13 |
| 2020/21 | 0.08 | 0.10 |
| 2021/22 | 0.21 | 0.16 |
| 2022/23 | 0.24 | 0.22 |
| 2023/24 | 0.24 | 0.25 |
| 2024/25 | 0.23 | 0.23 |
Permanent exclusions in the school year for every 100 pupils on roll. Source: Department for Education, Explore Education Statistics, Suspensions and permanent exclusions in England, 2024/25.
Attainment 8
2025/26 (provisional)58.5
- England
- 47.4
11.1 higher than England.
Show the figures as a table
| Year | Trafford | England |
|---|---|---|
| 2021/22 | 59.1 | 49.8 |
| 2022/23 | 58.2 | 47.2 |
| 2023/24 | 59.4 | 46.9 |
| 2024/25 | 58.9 | 47.1 |
| 2025/26 (provisional) | 58.5 | 47.4 |
The average of pupils' points across eight GCSE-level qualifications, with English and maths counted twice. Source: Department for Education, Explore Education Statistics, Key stage 4 performance, 2025/26.
English and maths: grade 4 or above
2025/26 (provisional)80%
- England
- 66%
14 percentage points higher than England.
Show the figures as a table
| Year | Trafford | England |
|---|---|---|
| 2021/22 | 80% | 70% |
| 2022/23 | 81% | 67% |
| 2023/24 | 82% | 67% |
| 2024/25 | 81% | 66% |
| 2025/26 (provisional) | 80% | 66% |
Pupils at the end of key stage 4 with grade 4 or above in both English and maths. Source: Department for Education, Explore Education Statistics, Key stage 4 performance, 2025/26.
English and maths: grade 5 or above
2025/26 (provisional)66%
- England
- 48%
18 percentage points higher than England.
Show the figures as a table
| Year | Trafford | England |
|---|---|---|
| 2021/22 | 65% | 51% |
| 2022/23 | 65% | 46% |
| 2023/24 | 68% | 47% |
| 2024/25 | 65% | 47% |
| 2025/26 (provisional) | 66% | 48% |
Pupils at the end of key stage 4 with grade 5 or above in both English and maths. Source: Department for Education, Explore Education Statistics, Key stage 4 performance, 2025/26.
Eligible for free school meals
2024/2516.0%
- England
- 25.8%
9.8 percentage points lower than England.
Show the figures as a table
| Year | Trafford | England |
|---|---|---|
| 2021/22 | 13.4% | 20.9% |
| 2022/23 | 14.1% | 22.7% |
| 2023/24 | 14.9% | 24.1% |
| 2024/25 | 16.0% | 25.8% |
Pupils known to be eligible for free school meals on census day in January. Source: Department for Education, Explore Education Statistics, Schools, pupils and their characteristics, 2024/25.
SEN support
2024/2510.6%
- England
- 13.4%
2.8 percentage points lower than England.
Show the figures as a table
| Year | Trafford | England |
|---|---|---|
| 2021/22 | 9.5% | 11.9% |
| 2022/23 | 9.7% | 12.4% |
| 2023/24 | 10.1% | 12.9% |
| 2024/25 | 10.6% | 13.4% |
Pupils receiving special educational needs support without an education, health and care plan. Source: Department for Education, Explore Education Statistics, Schools, pupils and their characteristics, 2024/25.
Education, health and care plan
2024/253.1%
- England
- 3.1%
The same as England.
Show the figures as a table
| Year | Trafford | England |
|---|---|---|
| 2021/22 | 2.3% | 2.2% |
| 2022/23 | 2.8% | 2.4% |
| 2023/24 | 3.0% | 2.7% |
| 2024/25 | 3.1% | 3.1% |
Pupils with an education, health and care plan. Source: Department for Education, Explore Education Statistics, Schools, pupils and their characteristics, 2024/25.
First language other than English
2024/2520.2%
- England
- 19.2%
1.0 percentage point higher than England.
Show the figures as a table
| Year | Trafford | England |
|---|---|---|
| 2021/22 | 14.5% | 17.5% |
| 2022/23 | 17.8% | 18.1% |
| 2023/24 | 19.3% | 18.6% |
| 2024/25 | 20.2% | 19.2% |
Pupils whose first language is known or believed to be other than English. Source: Department for Education, Explore Education Statistics, Schools, pupils and their characteristics, 2024/25.
Pupils per qualified teacher
2025/2616.7
- England
- 17.3
0.6 lower than England.
Show the figures as a table
| Year | Trafford | England |
|---|---|---|
| 2017/18 | 15.9 | 16.5 |
| 2018/19 | 16.4 | 16.8 |
| 2019/20 | 16.4 | 17.2 |
| 2020/21 | 16.4 | 17.1 |
| 2021/22 | 16.3 | 17.1 |
| 2022/23 | 16.3 | 17.2 |
| 2023/24 | 16.7 | 17.4 |
| 2024/25 | 16.8 | 17.3 |
| 2025/26 | 16.7 | 17.3 |
Full-time equivalent pupils for each full-time equivalent qualified teacher. Source: Department for Education, Explore Education Statistics, School workforce in England, 2025/26.
Special schools
Overall absence
2024/2510.9%
- England
- 12.8%
1.9 percentage points lower than England.
Show the figures as a table
| Year | Trafford | England |
|---|---|---|
| 2017/18 | 9.3% | 10.2% |
| 2018/19 | 7.7% | 10.1% |
| 2020/21 | 13.1% | 15.2% |
| 2021/22 | 11.1% | 13.2% |
| 2022/23 | 11.5% | 13.0% |
| 2023/24 | 11.5% | 13.0% |
| 2024/25 | 10.9% | 12.8% |
Sessions missed for any reason, as a share of all possible sessions in the school year. Source: Department for Education, Explore Education Statistics, Pupil absence in schools in England, 2024/25.
Persistent absence
2024/2528.3%
- England
- 35.3%
7.0 percentage points lower than England.
Show the figures as a table
| Year | Trafford | England |
|---|---|---|
| 2017/18 | 26.1% | 29.6% |
| 2018/19 | 24.9% | 28.8% |
| 2020/21 | 36.2% | 48.9% |
| 2021/22 | 31.5% | 40.4% |
| 2022/23 | 30.6% | 38.3% |
| 2023/24 | 31.8% | 37.2% |
| 2024/25 | 28.3% | 35.3% |
Pupils who missed 10% or more of their possible sessions, as a share of pupils. Source: Department for Education, Explore Education Statistics, Pupil absence in schools in England, 2024/25.
Severe absence
2024/255.5%
- England
- 6.9%
1.4 percentage points lower than England.
Show the figures as a table
| Year | Trafford | England |
|---|---|---|
| 2017/18 | 2.7% | 4.4% |
| 2018/19 | 2.5% | 4.6% |
| 2020/21 | 6.5% | 5.6% |
| 2021/22 | 4.7% | 5.8% |
| 2022/23 | 5.5% | 6.2% |
| 2023/24 | 5.7% | 6.7% |
| 2024/25 | 5.5% | 6.9% |
Pupils who missed 50% or more of their possible sessions, as a share of pupils. Source: Department for Education, Explore Education Statistics, Pupil absence in schools in England, 2024/25.
Suspensions per 100 pupils
2024/257.64
- England
- 12.32
4.68 lower than England.
Show the figures as a table
| Year | Trafford | England |
|---|---|---|
| 2017/18 | 24.47 | 12.34 |
| 2018/19 | 21.60 | 11.32 |
| 2019/20 | 17.39 | 7.76 |
| 2020/21 | 6.00 | 7.29 |
| 2021/22 | 9.04 | 9.60 |
| 2022/23 | 8.31 | 10.99 |
| 2023/24 | 12.64 | 12.62 |
| 2024/25 | 7.64 | 12.32 |
Suspensions in the school year for every 100 pupils on roll. One pupil can be suspended more than once. Source: Department for Education, Explore Education Statistics, Suspensions and permanent exclusions in England, 2024/25.
Permanent exclusions per 100 pupils
2024/250.00
- England
- 0.08
0.08 lower than England.
Show the figures as a table
| Year | Trafford | England |
|---|---|---|
| 2017/18 | 0.00 | 0.07 |
| 2018/19 | 0.13 | 0.06 |
| 2019/20 | 0.00 | 0.04 |
| 2020/21 | 0.12 | 0.03 |
| 2021/22 | 0.00 | 0.05 |
| 2022/23 | 0.00 | 0.08 |
| 2023/24 | 0.00 | 0.08 |
| 2024/25 | 0.00 | 0.08 |
Permanent exclusions in the school year for every 100 pupils on roll. Source: Department for Education, Explore Education Statistics, Suspensions and permanent exclusions in England, 2024/25.
Eligible for free school meals
2024/2545.2%
- England
- 48.8%
3.6 percentage points lower than England.
Show the figures as a table
| Year | Trafford | England |
|---|---|---|
| 2021/22 | 41.6% | 44.4% |
| 2022/23 | 40.9% | 45.6% |
| 2023/24 | 45.6% | 47.1% |
| 2024/25 | 45.2% | 48.8% |
Pupils known to be eligible for free school meals on census day in January. Source: Department for Education, Explore Education Statistics, Schools, pupils and their characteristics, 2024/25.
SEN support
2024/252.7%
- England
- 0.5%
2.2 percentage points higher than England.
Show the figures as a table
| Year | Trafford | England |
|---|---|---|
| 2021/22 | 5.0% | 0.9% |
| 2022/23 | 4.9% | 0.8% |
| 2023/24 | 4.0% | 0.7% |
| 2024/25 | 2.7% | 0.5% |
Pupils receiving special educational needs support without an education, health and care plan. Source: Department for Education, Explore Education Statistics, Schools, pupils and their characteristics, 2024/25.
Education, health and care plan
2024/2597.3%
- England
- 99.5%
2.2 percentage points lower than England.
Show the figures as a table
| Year | Trafford | England |
|---|---|---|
| 2021/22 | 95.0% | 99.1% |
| 2022/23 | 95.1% | 99.2% |
| 2023/24 | 96.0% | 99.3% |
| 2024/25 | 97.3% | 99.5% |
Pupils with an education, health and care plan. Source: Department for Education, Explore Education Statistics, Schools, pupils and their characteristics, 2024/25.
First language other than English
2024/2519.4%
- England
- 14.4%
5.0 percentage points higher than England.
Show the figures as a table
| Year | Trafford | England |
|---|---|---|
| 2021/22 | 15.4% | 14.5% |
| 2022/23 | 18.0% | 14.4% |
| 2023/24 | 17.3% | 14.4% |
| 2024/25 | 19.4% | 14.4% |
Pupils whose first language is known or believed to be other than English. Source: Department for Education, Explore Education Statistics, Schools, pupils and their characteristics, 2024/25.
Pupils per qualified teacher
2025/267.8
- England
- 7.3
0.5 higher than England.
Show the figures as a table
| Year | Trafford | England |
|---|---|---|
| 2017/18 | 6.7 | 6.7 |
| 2018/19 | 6.4 | 6.8 |
| 2019/20 | 6.4 | 7.0 |
| 2020/21 | 6.7 | 6.8 |
| 2021/22 | 6.5 | 6.9 |
| 2022/23 | 6.9 | 7.0 |
| 2023/24 | 7.0 | 7.1 |
| 2024/25 | 7.1 | 7.3 |
| 2025/26 | 7.8 | 7.3 |
Full-time equivalent pupils for each full-time equivalent qualified teacher. Source: Department for Education, Explore Education Statistics, School workforce in England, 2025/26.
Schools in Trafford
Listed by name. Filter by phase or type; sort by name or size. Nothing here is sorted by results.
Showing 90 of 90 schools in Trafford.
| School | Phase | Type | Town | Pupils |
|---|---|---|---|---|
| Acre Hall Primary School | Primary | Academy | Manchester | 297 |
| All Saints' Catholic Primary School | Primary | Maintained | Sale | 205 |
| Altrincham CofE (Aided) Primary School | Primary | Maintained | Altrincham | 211 |
| Altrincham College | Secondary | Academy | Altrincham | 973 |
| Altrincham Grammar School for Boys | Secondary | Academy | Altrincham | 1,432 |
| Altrincham Grammar School for Girls | Secondary | Academy | Altrincham | 1,381 |
| Ashton-on-Mersey School | Secondary | Academy | Sale | 1,609 |
| Barton Clough Primary School | Primary | Academy | Manchester | 155 |
| Blessed Thomas Holford Catholic College | Secondary | Maintained | Altrincham | 1,638 |
| Bollin Primary School | Primary | Academy | Altrincham | 368 |
| Bowdon CofE Primary School | Primary | Maintained | Altrincham | 622 |
| Brentwood School | Special | Maintained special | Sale | 185 |
| Broadheath Primary School | Primary | Maintained | Altrincham | 524 |
| Broadoak School | Secondary | Academy | Manchester | 507 |
| Brooklands Primary School | Primary | Maintained | Sale | 645 |
| Broomwood Primary School | Primary | Maintained | Altrincham | 355 |
| Cloverlea Primary School | Primary | Maintained | Altrincham | 228 |
| Davyhulme Primary School | Primary | Maintained | Manchester | 511 |
| Delamere School | Special | Maintained special | Manchester | 135 |
| Egerton High School | Special | Maintained special | Manchester | 69 |
| Elmridge Primary School | Primary | Academy | Altrincham | 199 |
| English Martyrs' RC Primary School, a Voluntary Academy | Primary | Academy | Manchester | 209 |
| Firs Primary School | Primary | Maintained | Sale | 540 |
| Flixton Girls School | Secondary | Academy | Manchester | 981 |
| Flixton Primary School | Primary | Maintained | Manchester | 439 |
| Forest Gate Academy | Primary | Academy | Manchester | 215 |
| Gorse Hill Primary School | Primary | Maintained | Manchester | 302 |
| Heyes Lane Primary School | Primary | Maintained | Altrincham | 577 |
| Highfield Primary School | Primary | Maintained | Manchester | 288 |
| Holy Family Catholic Primary School | Primary | Maintained | Sale | 199 |
| Kings Road Primary School | Primary | Maintained | Manchester | 638 |
| Kingsway Primary School | Primary | Academy | Manchester | 193 |
| Lime Tree Primary Academy | Primary | Academy | Sale | 473 |
| Longford Park School | Special | Academy | Manchester | 90 |
| Loreto Grammar School | Secondary | Academy | Altrincham | 1,075 |
| Lostock High School | Secondary | Maintained | Manchester | 513 |
| Manor Academy Sale | Special | Academy | Sale | 205 |
| Moorlands Junior School | Primary | Maintained | Sale | 329 |
| Moss Park Primary School | Primary | Maintained | Manchester | 464 |
| Navigation Primary School | Primary | Maintained | Altrincham | 444 |
| North Cestrian School | Secondary | Free school | Altrincham | 799 |
| Old Trafford Community Academy | Primary | Academy | Manchester | 324 |
| Oldfield Brow Primary School | Primary | Maintained | Altrincham | 318 |
| Our Lady of Lourdes Catholic School, a Voluntary Academy | Primary | Academy | Manchester | 232 |
| Our Lady of the Rosary RC Primary School, a Voluntary Academy | Primary | Academy | Manchester | 230 |
| Park Road Academy Primary School | Primary | Academy | Altrincham | 236 |
| Park Road Sale Primary School | Primary | Academy | Sale | 461 |
| Partington Central Academy | Primary | Academy | Manchester | 373 |
| Pictor Academy | Special | Academy | Timperley | 122 |
| Saint Ambrose College | Secondary | Academy | Altrincham | 1,096 |
| Sale Grammar School | Secondary | Academy | Sale | 1,352 |
| Sale High School | Secondary | Academy | Sale | 1,103 |
| Seymour Park Community Primary School | Primary | Maintained | Manchester | 682 |
| Springfield Primary School | Primary | Maintained | Sale | 680 |
| St Alphonsus RC Primary School | Primary | Maintained | Manchester | 167 |
| St Ann's RC Primary School | Primary | Maintained | Manchester | 415 |
| St Anne's CofE Primary School | Primary | Maintained | Sale | 216 |
| St Antony's Roman Catholic School, a Voluntary Academy | Secondary | Academy | Manchester | 688 |
| St Hilda's CofE Primary School | Primary | Academy | Manchester | 191 |
| St Hugh of Lincoln RC Primary School | Primary | Maintained | Stretford | 324 |
| St Hugh's Catholic Primary School | Primary | Maintained | Altrincham | 584 |
| St Joseph's Catholic Primary School, a Voluntary Academy | Primary | Academy | Sale | 437 |
| St Margaret Ward Catholic Primary School | Primary | Maintained | Sale | 223 |
| St Mary's CofE Primary School | Primary | Maintained | Sale | 239 |
| St Mary's CofE Primary School | Primary | Maintained | Manchester | 174 |
| St Matthew's CofE Primary School | Primary | Maintained | Manchester | 141 |
| St Michael's CofE (Aided) Primary School | Primary | Maintained | Manchester | 240 |
| St Monica's RC Primary School, a Voluntary Academy | Primary | Academy | Manchester | Not published |
| St Teresa's RC Primary School | Primary | Maintained | Manchester | 126 |
| St Vincent's Catholic Primary School | Primary | Maintained | Altrincham | 632 |
| Stamford Park Primary School | Primary | Maintained | Altrincham | 426 |
| Stretford Grammar School | Secondary | Maintained | Manchester | 956 |
| Stretford High School | Secondary | Maintained | Manchester | 1,000 |
| Templemoor Infant and Nursery School | Primary | Maintained | Sale | 213 |
| The Orchards | Special | Free school | Stretford | 148 |
| Trafford Alternative Education Provision | Alternative provision | Maintained | Altrincham | 53 |
| Tyntesfield Primary School | Primary | Academy | Sale | 441 |
| Urmston Grammar Academy | Secondary | Academy | Manchester | 1,137 |
| Urmston Primary School | Primary | Maintained | Manchester | 497 |
| Victoria Park Infant School | Primary | Maintained | Manchester | 203 |
| Victoria Park Junior School | Primary | Maintained | Manchester | 230 |
| Well Green Primary School | Primary | Maintained | Altrincham | 226 |
| Wellacre Technology Academy | Secondary | Academy | Manchester | 727 |
| Wellfield Infant and Nursery School | Primary | Maintained | Sale | 206 |
| Wellfield Junior School | Primary | Maintained | Sale | 246 |
| Wellington School | Secondary | Academy | Altrincham | 1,536 |
| Willows Primary School | Primary | Maintained | Altrincham | 375 |
| Woodheys Primary School | Primary | Maintained | Sale | 443 |
| Woodhouse Primary School | Primary | Maintained | Manchester | 228 |
| Worthington Primary School | Primary | Maintained | Sale | 446 |