Sunderland
116 state-funded schools with 41,019 pupils on roll, in the North East region. Every school’s page has its published figures against Sunderland and England.
- Primary
- 81
- Secondary
- 16
- All-through
- 2
- Special
- 7
- Alternative provision
- 3
- Nursery
- 7
- Academies
- 71
- Maintained
- 41
- Free schools
- 3
- Maintained special
- 1
Map
Zoom in to see each school. Open the full map
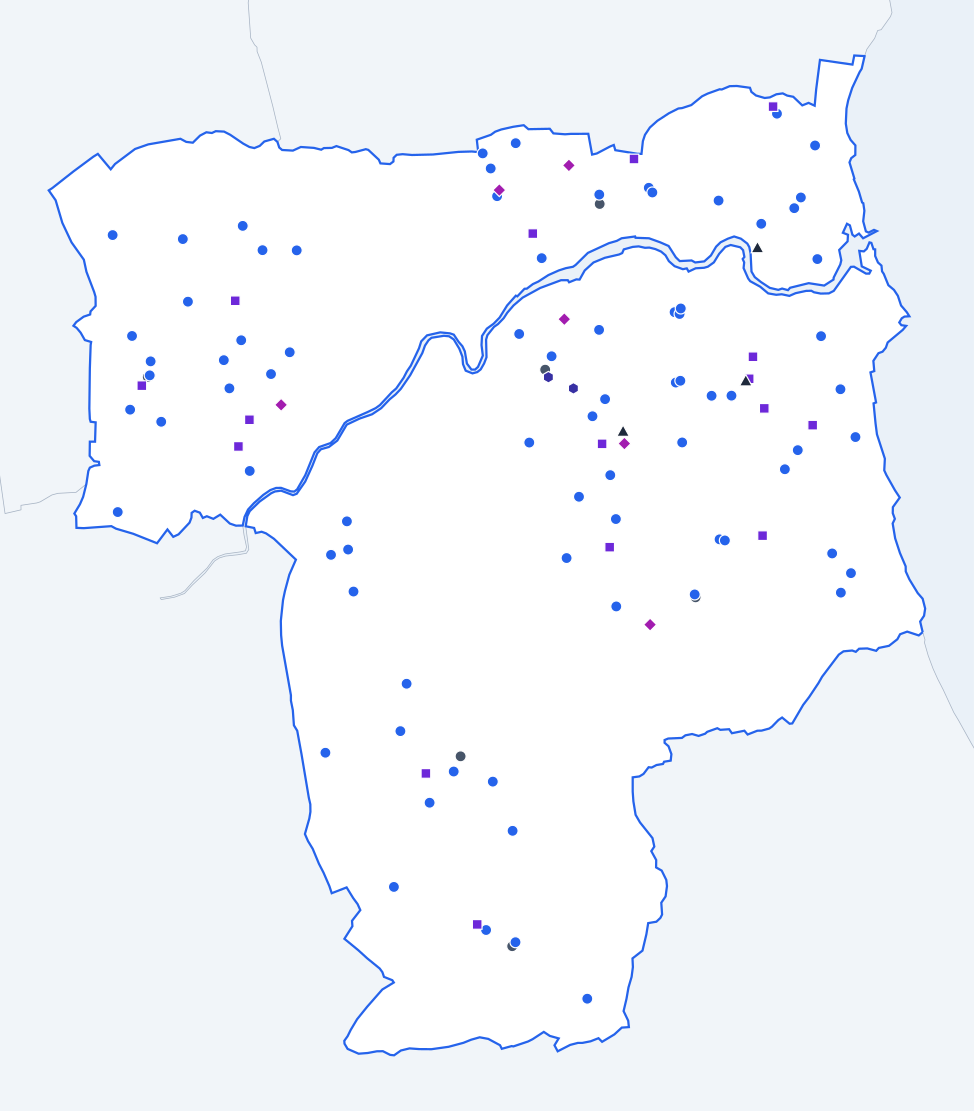
ONS, OS © Crown copyright 2025 · GIAS · © OpenStreetMap
Sunderland against England
Published figures for the authority’s schools, set against the same kind of school across England.
All state-funded schools
Overall absence
2024/257.5%
- England
- 6.8%
0.7 percentage points higher than England.
Show the figures as a table
| Year | Sunderland | England |
|---|---|---|
| 2017/18 | 5.2% | 4.8% |
| 2018/19 | 5.5% | 4.7% |
| 2020/21 | 5.1% | 4.6% |
| 2021/22 | 8.4% | 7.6% |
| 2022/23 | 8.1% | 7.4% |
| 2023/24 | 8.2% | 7.1% |
| 2024/25 | 7.5% | 6.8% |
Sessions missed for any reason, as a share of all possible sessions in the school year. Source: Department for Education, Explore Education Statistics, Pupil absence in schools in England, 2024/25.
Persistent absence
2024/2520.9%
- England
- 18.1%
2.8 percentage points higher than England.
Show the figures as a table
| Year | Sunderland | England |
|---|---|---|
| 2017/18 | 12.6% | 11.2% |
| 2018/19 | 13.9% | 10.9% |
| 2020/21 | 13.5% | 12.1% |
| 2021/22 | 26.0% | 22.5% |
| 2022/23 | 23.9% | 21.2% |
| 2023/24 | 24.0% | 20.0% |
| 2024/25 | 20.9% | 18.1% |
Pupils who missed 10% or more of their possible sessions, as a share of pupils. Source: Department for Education, Explore Education Statistics, Pupil absence in schools in England, 2024/25.
Severe absence
2024/253.0%
- England
- 2.4%
0.6 percentage points higher than England.
Show the figures as a table
| Year | Sunderland | England |
|---|---|---|
| 2017/18 | 0.8% | 0.8% |
| 2018/19 | 1.1% | 0.8% |
| 2020/21 | 1.3% | 1.1% |
| 2021/22 | 2.0% | 1.7% |
| 2022/23 | 2.4% | 2.0% |
| 2023/24 | 2.9% | 2.3% |
| 2024/25 | 3.0% | 2.4% |
Pupils who missed 50% or more of their possible sessions, as a share of pupils. Source: Department for Education, Explore Education Statistics, Pupil absence in schools in England, 2024/25.
Suspensions per 100 pupils
2024/2520.27
- England
- 10.88
9.39 higher than England.
Show the figures as a table
| Year | Sunderland | England |
|---|---|---|
| 2017/18 | 9.43 | 5.08 |
| 2018/19 | 6.76 | 5.36 |
| 2019/20 | 4.74 | 3.76 |
| 2020/21 | 5.33 | 4.25 |
| 2021/22 | 8.05 | 6.91 |
| 2022/23 | 14.41 | 9.33 |
| 2023/24 | 22.50 | 11.31 |
| 2024/25 | 20.27 | 10.88 |
Suspensions in the school year for every 100 pupils on roll. One pupil can be suspended more than once. Source: Department for Education, Explore Education Statistics, Suspensions and permanent exclusions in England, 2024/25.
Permanent exclusions per 100 pupils
2024/250.31
- England
- 0.12
0.19 higher than England.
Show the figures as a table
| Year | Sunderland | England |
|---|---|---|
| 2017/18 | 0.13 | 0.10 |
| 2018/19 | 0.22 | 0.10 |
| 2019/20 | 0.14 | 0.06 |
| 2020/21 | 0.08 | 0.05 |
| 2021/22 | 0.12 | 0.08 |
| 2022/23 | 0.22 | 0.11 |
| 2023/24 | 0.25 | 0.13 |
| 2024/25 | 0.31 | 0.12 |
Permanent exclusions in the school year for every 100 pupils on roll. Source: Department for Education, Explore Education Statistics, Suspensions and permanent exclusions in England, 2024/25.
Eligible for free school meals
2024/2530.8%
- England
- 25.7%
5.1 percentage points higher than England.
Show the figures as a table
| Year | Sunderland | England |
|---|---|---|
| 2021/22 | 29.3% | 22.5% |
| 2022/23 | 30.1% | 23.8% |
| 2023/24 | 30.3% | 24.6% |
| 2024/25 | 30.8% | 25.7% |
Pupils known to be eligible for free school meals on census day in January. Source: Department for Education, Explore Education Statistics, Schools, pupils and their characteristics, 2024/25.
SEN support
2024/2516.5%
- England
- 14.0%
2.5 percentage points higher than England.
Show the figures as a table
| Year | Sunderland | England |
|---|---|---|
| 2021/22 | 14.1% | 12.4% |
| 2022/23 | 14.8% | 12.9% |
| 2023/24 | 15.5% | 13.4% |
| 2024/25 | 16.5% | 14.0% |
Pupils receiving special educational needs support without an education, health and care plan. Source: Department for Education, Explore Education Statistics, Schools, pupils and their characteristics, 2024/25.
Education, health and care plan
2024/254.7%
- England
- 5.2%
0.5 percentage points lower than England.
Show the figures as a table
| Year | Sunderland | England |
|---|---|---|
| 2021/22 | 3.7% | 3.8% |
| 2022/23 | 4.1% | 4.2% |
| 2023/24 | 4.4% | 4.7% |
| 2024/25 | 4.7% | 5.2% |
Pupils with an education, health and care plan. Source: Department for Education, Explore Education Statistics, Schools, pupils and their characteristics, 2024/25.
First language other than English
2024/257.8%
- England
- 21.4%
13.6 percentage points lower than England.
Show the figures as a table
| Year | Sunderland | England |
|---|---|---|
| 2021/22 | 5.6% | 19.6% |
| 2022/23 | 6.4% | 20.2% |
| 2023/24 | 7.1% | 20.8% |
| 2024/25 | 7.8% | 21.4% |
Pupils whose first language is known or believed to be other than English. Source: Department for Education, Explore Education Statistics, Schools, pupils and their characteristics, 2024/25.
Pupils per qualified teacher
2025/2617.6
- England
- 18.5
0.9 lower than England.
Show the figures as a table
| Year | Sunderland | England |
|---|---|---|
| 2017/18 | 17.8 | 18.4 |
| 2018/19 | 18.1 | 18.6 |
| 2019/20 | 18.4 | 18.8 |
| 2020/21 | 18.0 | 18.5 |
| 2021/22 | 17.6 | 18.5 |
| 2022/23 | 17.5 | 18.5 |
| 2023/24 | 17.8 | 18.6 |
| 2024/25 | 17.8 | 18.6 |
| 2025/26 | 17.6 | 18.5 |
Full-time equivalent pupils for each full-time equivalent qualified teacher. Source: Department for Education, Explore Education Statistics, School workforce in England, 2025/26.
Teacher sickness absence
2024/255.6 days
- England
- 5.0 days
0.6 days higher than England.
Show the figures as a table
| Year | Sunderland | England |
|---|---|---|
| 2017/18 | 5.0 days | 4.0 days |
| 2018/19 | 5.4 days | 4.0 days |
| 2019/20 | Not published | Not published |
| 2020/21 | 4.8 days | 3.9 days |
| 2021/22 | 6.5 days | 6.3 days |
| 2022/23 | 5.9 days | 5.2 days |
| 2023/24 | 6.1 days | 5.3 days |
| 2024/25 | 5.6 days | 5.0 days |
Days lost to sickness absence in the school year, averaged across all teachers. Source: Department for Education, Explore Education Statistics, School workforce in England, 2024/25.
Primary schools
Overall absence
2024/255.2%
- England
- 5.2%
The same as England.
Show the figures as a table
| Year | Sunderland | England |
|---|---|---|
| 2017/18 | 4.4% | 4.2% |
| 2018/19 | 4.5% | 4.0% |
| 2020/21 | 3.6% | 3.6% |
| 2021/22 | 6.6% | 6.3% |
| 2022/23 | 6.1% | 5.9% |
| 2023/24 | 5.9% | 5.5% |
| 2024/25 | 5.2% | 5.2% |
Sessions missed for any reason, as a share of all possible sessions in the school year. Source: Department for Education, Explore Education Statistics, Pupil absence in schools in England, 2024/25.
Persistent absence
2024/2513.6%
- England
- 13.0%
0.6 percentage points higher than England.
Show the figures as a table
| Year | Sunderland | England |
|---|---|---|
| 2017/18 | 9.2% | 8.7% |
| 2018/19 | 10.2% | 8.2% |
| 2020/21 | 8.2% | 8.8% |
| 2021/22 | 20.4% | 17.7% |
| 2022/23 | 17.2% | 16.2% |
| 2023/24 | 16.8% | 14.6% |
| 2024/25 | 13.6% | 13.0% |
Pupils who missed 10% or more of their possible sessions, as a share of pupils. Source: Department for Education, Explore Education Statistics, Pupil absence in schools in England, 2024/25.
Severe absence
2024/250.7%
- England
- 0.9%
0.2 percentage points lower than England.
Show the figures as a table
| Year | Sunderland | England |
|---|---|---|
| 2017/18 | 0.3% | 0.4% |
| 2018/19 | 0.4% | 0.4% |
| 2020/21 | 0.6% | 0.7% |
| 2021/22 | 0.4% | 0.6% |
| 2022/23 | 0.6% | 0.7% |
| 2023/24 | 0.8% | 0.9% |
| 2024/25 | 0.7% | 0.9% |
Pupils who missed 50% or more of their possible sessions, as a share of pupils. Source: Department for Education, Explore Education Statistics, Pupil absence in schools in England, 2024/25.
Suspensions per 100 pupils
2024/251.64
- England
- 2.47
0.83 lower than England.
Show the figures as a table
| Year | Sunderland | England |
|---|---|---|
| 2017/18 | 1.40 | 1.40 |
| 2018/19 | 1.09 | 1.41 |
| 2019/20 | 0.96 | 1.00 |
| 2020/21 | 0.71 | 0.99 |
| 2021/22 | 1.33 | 1.42 |
| 2022/23 | 1.68 | 1.81 |
| 2023/24 | 1.28 | 2.27 |
| 2024/25 | 1.64 | 2.47 |
Suspensions in the school year for every 100 pupils on roll. One pupil can be suspended more than once. Source: Department for Education, Explore Education Statistics, Suspensions and permanent exclusions in England, 2024/25.
Permanent exclusions per 100 pupils
2024/250.06
- England
- 0.03
0.03 higher than England.
Show the figures as a table
| Year | Sunderland | England |
|---|---|---|
| 2017/18 | 0.03 | 0.03 |
| 2018/19 | 0.03 | 0.02 |
| 2019/20 | 0.06 | 0.02 |
| 2020/21 | 0.01 | 0.01 |
| 2021/22 | 0.01 | 0.02 |
| 2022/23 | 0.04 | 0.03 |
| 2023/24 | 0.04 | 0.03 |
| 2024/25 | 0.06 | 0.03 |
Permanent exclusions in the school year for every 100 pupils on roll. Source: Department for Education, Explore Education Statistics, Suspensions and permanent exclusions in England, 2024/25.
Reading, writing and maths: expected standard
2025/26 (provisional)67%
- England
- 63%
4 percentage points higher than England.
Show the figures as a table
| Year | Sunderland | England |
|---|---|---|
| 2021/22 | 61% | 59% |
| 2022/23 | 62% | 60% |
| 2023/24 | 65% | 61% |
| 2024/25 | 66% | 63% |
| 2025/26 (provisional) | 67% | 63% |
Pupils at the end of key stage 2 who met the expected standard in reading, writing and maths combined. Source: Department for Education, Explore Education Statistics, Key stage 2 attainment, 2025/26.
Reading, writing and maths: higher standard
2025/26 (provisional)11%
- England
- 9%
2 percentage points higher than England.
Show the figures as a table
| Year | Sunderland | England |
|---|---|---|
| 2021/22 | 7% | 7% |
| 2022/23 | 8% | 8% |
| 2023/24 | 8% | 8% |
| 2024/25 | 11% | 8% |
| 2025/26 (provisional) | 11% | 9% |
Pupils at the end of key stage 2 who met the higher standard in reading, writing and maths combined. Source: Department for Education, Explore Education Statistics, Key stage 2 attainment, 2025/26.
Eligible for free school meals
2024/2527.3%
- England
- 24.7%
2.6 percentage points higher than England.
Show the figures as a table
| Year | Sunderland | England |
|---|---|---|
| 2021/22 | 28.0% | 23.1% |
| 2022/23 | 27.8% | 24.0% |
| 2023/24 | 27.4% | 24.3% |
| 2024/25 | 27.3% | 24.7% |
Pupils known to be eligible for free school meals on census day in January. Source: Department for Education, Explore Education Statistics, Schools, pupils and their characteristics, 2024/25.
SEN support
2024/2517.8%
- England
- 15.0%
2.8 percentage points higher than England.
Show the figures as a table
| Year | Sunderland | England |
|---|---|---|
| 2021/22 | 15.0% | 13.0% |
| 2022/23 | 15.9% | 13.5% |
| 2023/24 | 16.8% | 14.1% |
| 2024/25 | 17.8% | 15.0% |
Pupils receiving special educational needs support without an education, health and care plan. Source: Department for Education, Explore Education Statistics, Schools, pupils and their characteristics, 2024/25.
Education, health and care plan
2024/252.1%
- England
- 3.5%
1.4 percentage points lower than England.
Show the figures as a table
| Year | Sunderland | England |
|---|---|---|
| 2021/22 | 1.4% | 2.3% |
| 2022/23 | 1.7% | 2.5% |
| 2023/24 | 1.9% | 3.0% |
| 2024/25 | 2.1% | 3.5% |
Pupils with an education, health and care plan. Source: Department for Education, Explore Education Statistics, Schools, pupils and their characteristics, 2024/25.
First language other than English
2024/258.5%
- England
- 23.4%
14.9 percentage points lower than England.
Show the figures as a table
| Year | Sunderland | England |
|---|---|---|
| 2021/22 | 6.0% | 21.2% |
| 2022/23 | 6.8% | 22.0% |
| 2023/24 | 7.8% | 22.8% |
| 2024/25 | 8.5% | 23.4% |
Pupils whose first language is known or believed to be other than English. Source: Department for Education, Explore Education Statistics, Schools, pupils and their characteristics, 2024/25.
Pupils per qualified teacher
2025/2620.5
- England
- 21.2
0.7 lower than England.
Show the figures as a table
| Year | Sunderland | England |
|---|---|---|
| 2017/18 | 20.9 | 21.3 |
| 2018/19 | 20.7 | 21.4 |
| 2019/20 | 21.0 | 21.4 |
| 2020/21 | 20.7 | 21.1 |
| 2021/22 | 20.3 | 21.0 |
| 2022/23 | 20.1 | 21.1 |
| 2023/24 | 20.4 | 21.2 |
| 2024/25 | 20.8 | 21.3 |
| 2025/26 | 20.5 | 21.2 |
Full-time equivalent pupils for each full-time equivalent qualified teacher. Source: Department for Education, Explore Education Statistics, School workforce in England, 2025/26.
Secondary schools
Overall absence
2024/259.8%
- England
- 8.4%
1.4 percentage points higher than England.
Show the figures as a table
| Year | Sunderland | England |
|---|---|---|
| 2017/18 | 6.2% | 5.5% |
| 2018/19 | 6.5% | 5.5% |
| 2020/21 | 6.5% | 5.5% |
| 2021/22 | 10.2% | 9.0% |
| 2022/23 | 10.1% | 9.0% |
| 2023/24 | 10.6% | 8.9% |
| 2024/25 | 9.8% | 8.4% |
Sessions missed for any reason, as a share of all possible sessions in the school year. Source: Department for Education, Explore Education Statistics, Pupil absence in schools in England, 2024/25.
Persistent absence
2024/2528.4%
- England
- 23.4%
5.0 percentage points higher than England.
Show the figures as a table
| Year | Sunderland | England |
|---|---|---|
| 2017/18 | 16.4% | 13.9% |
| 2018/19 | 17.7% | 13.7% |
| 2020/21 | 18.2% | 14.8% |
| 2021/22 | 31.9% | 27.7% |
| 2022/23 | 30.6% | 26.5% |
| 2023/24 | 31.5% | 25.6% |
| 2024/25 | 28.4% | 23.4% |
Pupils who missed 10% or more of their possible sessions, as a share of pupils. Source: Department for Education, Explore Education Statistics, Pupil absence in schools in England, 2024/25.
Severe absence
2024/255.2%
- England
- 3.9%
1.3 percentage points higher than England.
Show the figures as a table
| Year | Sunderland | England |
|---|---|---|
| 2017/18 | 1.2% | 1.2% |
| 2018/19 | 1.6% | 1.3% |
| 2020/21 | 1.9% | 1.5% |
| 2021/22 | 3.4% | 2.7% |
| 2022/23 | 4.1% | 3.4% |
| 2023/24 | 4.9% | 3.8% |
| 2024/25 | 5.2% | 3.9% |
Pupils who missed 50% or more of their possible sessions, as a share of pupils. Source: Department for Education, Explore Education Statistics, Pupil absence in schools in England, 2024/25.
Suspensions per 100 pupils
2024/2545.24
- England
- 21.24
24.00 higher than England.
Show the figures as a table
| Year | Sunderland | England |
|---|---|---|
| 2017/18 | 21.65 | 10.13 |
| 2018/19 | 14.88 | 10.75 |
| 2019/20 | 9.88 | 7.43 |
| 2020/21 | 11.33 | 8.48 |
| 2021/22 | 16.35 | 13.96 |
| 2022/23 | 31.31 | 18.90 |
| 2023/24 | 49.37 | 22.61 |
| 2024/25 | 45.24 | 21.24 |
Suspensions in the school year for every 100 pupils on roll. One pupil can be suspended more than once. Source: Department for Education, Explore Education Statistics, Suspensions and permanent exclusions in England, 2024/25.
Permanent exclusions per 100 pupils
2024/250.68
- England
- 0.23
0.45 higher than England.
Show the figures as a table
| Year | Sunderland | England |
|---|---|---|
| 2017/18 | 0.29 | 0.20 |
| 2018/19 | 0.50 | 0.20 |
| 2019/20 | 0.27 | 0.13 |
| 2020/21 | 0.19 | 0.10 |
| 2021/22 | 0.26 | 0.16 |
| 2022/23 | 0.47 | 0.22 |
| 2023/24 | 0.56 | 0.25 |
| 2024/25 | 0.68 | 0.23 |
Permanent exclusions in the school year for every 100 pupils on roll. Source: Department for Education, Explore Education Statistics, Suspensions and permanent exclusions in England, 2024/25.
Attainment 8
2025/26 (provisional)45.2
- England
- 47.4
2.2 lower than England.
Show the figures as a table
| Year | Sunderland | England |
|---|---|---|
| 2021/22 | 47.4 | 49.8 |
| 2022/23 | 43.9 | 47.2 |
| 2023/24 | 44.0 | 46.9 |
| 2024/25 | 44.5 | 47.1 |
| 2025/26 (provisional) | 45.2 | 47.4 |
The average of pupils' points across eight GCSE-level qualifications, with English and maths counted twice. Source: Department for Education, Explore Education Statistics, Key stage 4 performance, 2025/26.
English and maths: grade 4 or above
2025/26 (provisional)66%
- England
- 66%
The same as England.
Show the figures as a table
| Year | Sunderland | England |
|---|---|---|
| 2021/22 | 64% | 70% |
| 2022/23 | 60% | 67% |
| 2023/24 | 62% | 67% |
| 2024/25 | 63% | 66% |
| 2025/26 (provisional) | 66% | 66% |
Pupils at the end of key stage 4 with grade 4 or above in both English and maths. Source: Department for Education, Explore Education Statistics, Key stage 4 performance, 2025/26.
English and maths: grade 5 or above
2025/26 (provisional)46%
- England
- 48%
2 percentage points lower than England.
Show the figures as a table
| Year | Sunderland | England |
|---|---|---|
| 2021/22 | 44% | 51% |
| 2022/23 | 40% | 46% |
| 2023/24 | 43% | 47% |
| 2024/25 | 43% | 47% |
| 2025/26 (provisional) | 46% | 48% |
Pupils at the end of key stage 4 with grade 5 or above in both English and maths. Source: Department for Education, Explore Education Statistics, Key stage 4 performance, 2025/26.
Eligible for free school meals
2024/2535.3%
- England
- 25.8%
9.5 percentage points higher than England.
Show the figures as a table
| Year | Sunderland | England |
|---|---|---|
| 2021/22 | 31.0% | 20.9% |
| 2022/23 | 32.8% | 22.7% |
| 2023/24 | 33.8% | 24.1% |
| 2024/25 | 35.3% | 25.8% |
Pupils known to be eligible for free school meals on census day in January. Source: Department for Education, Explore Education Statistics, Schools, pupils and their characteristics, 2024/25.
SEN support
2024/2516.0%
- England
- 13.4%
2.6 percentage points higher than England.
Show the figures as a table
| Year | Sunderland | England |
|---|---|---|
| 2021/22 | 13.8% | 11.9% |
| 2022/23 | 14.0% | 12.4% |
| 2023/24 | 14.6% | 12.9% |
| 2024/25 | 16.0% | 13.4% |
Pupils receiving special educational needs support without an education, health and care plan. Source: Department for Education, Explore Education Statistics, Schools, pupils and their characteristics, 2024/25.
Education, health and care plan
2024/252.5%
- England
- 3.1%
0.6 percentage points lower than England.
Show the figures as a table
| Year | Sunderland | England |
|---|---|---|
| 2021/22 | 1.8% | 2.2% |
| 2022/23 | 2.1% | 2.4% |
| 2023/24 | 2.2% | 2.7% |
| 2024/25 | 2.5% | 3.1% |
Pupils with an education, health and care plan. Source: Department for Education, Explore Education Statistics, Schools, pupils and their characteristics, 2024/25.
First language other than English
2024/257.3%
- England
- 19.2%
11.9 percentage points lower than England.
Show the figures as a table
| Year | Sunderland | England |
|---|---|---|
| 2021/22 | 5.3% | 17.5% |
| 2022/23 | 6.1% | 18.1% |
| 2023/24 | 6.6% | 18.6% |
| 2024/25 | 7.3% | 19.2% |
Pupils whose first language is known or believed to be other than English. Source: Department for Education, Explore Education Statistics, Schools, pupils and their characteristics, 2024/25.
Pupils per qualified teacher
2025/2616.7
- England
- 17.3
0.6 lower than England.
Show the figures as a table
| Year | Sunderland | England |
|---|---|---|
| 2017/18 | 15.5 | 16.5 |
| 2018/19 | 16.4 | 16.8 |
| 2019/20 | 16.8 | 17.2 |
| 2020/21 | 16.6 | 17.1 |
| 2021/22 | 16.4 | 17.1 |
| 2022/23 | 16.6 | 17.2 |
| 2023/24 | 16.9 | 17.4 |
| 2024/25 | 16.6 | 17.3 |
| 2025/26 | 16.7 | 17.3 |
Full-time equivalent pupils for each full-time equivalent qualified teacher. Source: Department for Education, Explore Education Statistics, School workforce in England, 2025/26.
Special schools
Overall absence
2024/2514.6%
- England
- 12.8%
1.8 percentage points higher than England.
Show the figures as a table
| Year | Sunderland | England |
|---|---|---|
| 2017/18 | 11.0% | 10.2% |
| 2018/19 | 10.9% | 10.1% |
| 2020/21 | 16.2% | 15.2% |
| 2021/22 | 14.6% | 13.2% |
| 2022/23 | 14.6% | 13.0% |
| 2023/24 | 15.4% | 13.0% |
| 2024/25 | 14.6% | 12.8% |
Sessions missed for any reason, as a share of all possible sessions in the school year. Source: Department for Education, Explore Education Statistics, Pupil absence in schools in England, 2024/25.
Persistent absence
2024/2534.2%
- England
- 35.3%
1.1 percentage points lower than England.
Show the figures as a table
| Year | Sunderland | England |
|---|---|---|
| 2017/18 | 28.3% | 29.6% |
| 2018/19 | 28.0% | 28.8% |
| 2020/21 | 49.5% | 48.9% |
| 2021/22 | 41.7% | 40.4% |
| 2022/23 | 37.4% | 38.3% |
| 2023/24 | 38.6% | 37.2% |
| 2024/25 | 34.2% | 35.3% |
Pupils who missed 10% or more of their possible sessions, as a share of pupils. Source: Department for Education, Explore Education Statistics, Pupil absence in schools in England, 2024/25.
Severe absence
2024/259.4%
- England
- 6.9%
2.5 percentage points higher than England.
Show the figures as a table
| Year | Sunderland | England |
|---|---|---|
| 2017/18 | 5.7% | 4.4% |
| 2018/19 | 8.0% | 4.6% |
| 2020/21 | 7.9% | 5.6% |
| 2021/22 | 8.7% | 5.8% |
| 2022/23 | 9.2% | 6.2% |
| 2023/24 | 9.8% | 6.7% |
| 2024/25 | 9.4% | 6.9% |
Pupils who missed 50% or more of their possible sessions, as a share of pupils. Source: Department for Education, Explore Education Statistics, Pupil absence in schools in England, 2024/25.
Suspensions per 100 pupils
2024/2535.61
- England
- 12.32
23.29 higher than England.
Show the figures as a table
| Year | Sunderland | England |
|---|---|---|
| 2017/18 | 11.31 | 12.34 |
| 2018/19 | 13.62 | 11.32 |
| 2019/20 | 12.13 | 7.76 |
| 2020/21 | 16.25 | 7.29 |
| 2021/22 | 28.30 | 9.60 |
| 2022/23 | 26.12 | 10.99 |
| 2023/24 | 57.24 | 12.62 |
| 2024/25 | 35.61 | 12.32 |
Suspensions in the school year for every 100 pupils on roll. One pupil can be suspended more than once. Source: Department for Education, Explore Education Statistics, Suspensions and permanent exclusions in England, 2024/25.
Permanent exclusions per 100 pupils
2024/250.00
- England
- 0.08
0.08 lower than England.
Show the figures as a table
| Year | Sunderland | England |
|---|---|---|
| 2017/18 | 0.00 | 0.07 |
| 2018/19 | 0.28 | 0.06 |
| 2019/20 | 0.00 | 0.04 |
| 2020/21 | 0.00 | 0.03 |
| 2021/22 | 0.11 | 0.05 |
| 2022/23 | 0.10 | 0.08 |
| 2023/24 | 0.10 | 0.08 |
| 2024/25 | 0.00 | 0.08 |
Permanent exclusions in the school year for every 100 pupils on roll. Source: Department for Education, Explore Education Statistics, Suspensions and permanent exclusions in England, 2024/25.
Eligible for free school meals
2024/2559.4%
- England
- 48.8%
10.6 percentage points higher than England.
Show the figures as a table
| Year | Sunderland | England |
|---|---|---|
| 2021/22 | 54.9% | 44.4% |
| 2022/23 | 55.0% | 45.6% |
| 2023/24 | 55.3% | 47.1% |
| 2024/25 | 59.4% | 48.8% |
Pupils known to be eligible for free school meals on census day in January. Source: Department for Education, Explore Education Statistics, Schools, pupils and their characteristics, 2024/25.
SEN support
2024/250.7%
- England
- 0.5%
0.2 percentage points higher than England.
Show the figures as a table
| Year | Sunderland | England |
|---|---|---|
| 2021/22 | 0.8% | 0.9% |
| 2022/23 | 1.3% | 0.8% |
| 2023/24 | 1.0% | 0.7% |
| 2024/25 | 0.7% | 0.5% |
Pupils receiving special educational needs support without an education, health and care plan. Source: Department for Education, Explore Education Statistics, Schools, pupils and their characteristics, 2024/25.
Education, health and care plan
2024/2599.3%
- England
- 99.5%
0.2 percentage points lower than England.
Show the figures as a table
| Year | Sunderland | England |
|---|---|---|
| 2021/22 | 99.2% | 99.1% |
| 2022/23 | 98.7% | 99.2% |
| 2023/24 | 99.0% | 99.3% |
| 2024/25 | 99.3% | 99.5% |
Pupils with an education, health and care plan. Source: Department for Education, Explore Education Statistics, Schools, pupils and their characteristics, 2024/25.
First language other than English
2024/255.4%
- England
- 14.4%
9.0 percentage points lower than England.
Show the figures as a table
| Year | Sunderland | England |
|---|---|---|
| 2021/22 | 5.4% | 14.5% |
| 2022/23 | 6.1% | 14.4% |
| 2023/24 | 5.5% | 14.4% |
| 2024/25 | 5.4% | 14.4% |
Pupils whose first language is known or believed to be other than English. Source: Department for Education, Explore Education Statistics, Schools, pupils and their characteristics, 2024/25.
Pupils per qualified teacher
2025/266.7
- England
- 7.3
0.6 lower than England.
Show the figures as a table
| Year | Sunderland | England |
|---|---|---|
| 2017/18 | 6.6 | 6.7 |
| 2018/19 | 6.9 | 6.8 |
| 2019/20 | 7.2 | 7.0 |
| 2020/21 | 7.2 | 6.8 |
| 2021/22 | 6.8 | 6.9 |
| 2022/23 | 6.8 | 7.0 |
| 2023/24 | 7.0 | 7.1 |
| 2024/25 | 6.9 | 7.3 |
| 2025/26 | 6.7 | 7.3 |
Full-time equivalent pupils for each full-time equivalent qualified teacher. Source: Department for Education, Explore Education Statistics, School workforce in England, 2025/26.
Schools in Sunderland
Listed by name. Filter by phase or type; sort by name or size. Nothing here is sorted by results.
Showing 116 of 116 schools in Sunderland.
| School | Phase | Type | Town | Pupils |
|---|---|---|---|---|
| Academy 360 | All-through | Academy | Sunderland | 854 |
| Albany Village Primary School | Primary | Maintained | Washington | 214 |
| Barbara Priestman Academy | Special | Academy | Sunderland | 189 |
| Barmston Village Primary School | Primary | Maintained | Washington | 206 |
| Barnes Infant Academy | Primary | Academy | Sunderland | 311 |
| Barnes Junior School | Primary | Maintained | Sunderland | 341 |
| Barnwell Academy | Primary | Academy | Houghton le Spring | 302 |
| Beacon of Light School | Alternative provision | Free school | Sunderland | 0 |
| Benedict Biscop Church of England Academy | Primary | Academy | Sunderland | 333 |
| Bernard Gilpin Primary School | Primary | Maintained | Houghton le Spring | 417 |
| Bexhill Academy | Primary | Academy | Sunderland | 360 |
| Biddick Academy | Secondary | Academy | Washington | 1,002 |
| Biddick Primary School | Primary | Maintained | Washington | 285 |
| Blackfell Primary School | Primary | Maintained | Washington | 142 |
| Broadway Junior School | Primary | Maintained | Sunderland | 227 |
| Burnside Academy Inspires | Primary | Academy | Houghton le Spring | 174 |
| Castle View Enterprise Academy | Secondary | Academy | Sunderland | 993 |
| Castletown Primary School | Primary | Maintained | Sunderland | 347 |
| Christ's College | All-through | Free school | Sunderland | 796 |
| Columbia Grange School | Special | Academy | Washington | 140 |
| Consilium Evolve | Alternative provision | Academy | Sunderland | 0 |
| Dame Dorothy Primary School | Primary | Academy | Sunderland | 181 |
| Diamond Hall Infant Academy | Primary | Academy | Sunderland | 314 |
| Diamond Hall Junior Academy | Primary | Academy | Sunderland | 320 |
| Dubmire Primary | Primary | Academy | Houghton le Spring | 479 |
| Easington Lane Primary School | Primary | Maintained | Houghton le Spring | 281 |
| East Herrington Primary Academy | Primary | Academy | Sunderland | 476 |
| East Rainton Primary School | Primary | Maintained | Houghton le Spring | 101 |
| English Martyrs' Catholic Primary School, Sunderland | Primary | Academy | Sunderland | 178 |
| Eppleton Academy Primary School | Primary | Academy | Houghton le Spring | 208 |
| Farringdon Academy | Primary | Academy | Sunderland | 384 |
| Farringdon Community Academy | Secondary | Academy | Sunderland | 712 |
| Fatfield Academy | Primary | Academy | Washington | 233 |
| Fulwell Infant School Academy | Primary | Academy | Sunderland | 354 |
| Fulwell Junior School | Primary | Maintained | Sunderland | 350 |
| George Washington Primary School | Primary | Academy | Washington | 384 |
| Gillas Lane Primary Academy | Primary | Academy | Houghton le Spring | 134 |
| Grange Park Primary School | Primary | Maintained | Sunderland | 208 |
| Grangetown Primary School | Primary | Maintained | Sunderland | 302 |
| Grindon Infant School | Primary | Maintained | Sunderland | 163 |
| Harry Watts Academy | Special | Free school | Sunderland | 187 |
| Hasting Hill Academy | Primary | Academy | Sunderland | 238 |
| Hetton Academy | Secondary | Academy | Houghton le Spring | 681 |
| Hetton Lyons Nursery School | Nursery | Maintained | Houghton Le Spring | 110 |
| Hetton Lyons Primary School | Primary | Academy | Houghton le Spring | 431 |
| Hetton Primary School | Primary | Maintained | Houghton le Spring | 206 |
| Highfield Academy | Primary | Academy | Sunderland | 443 |
| Hill View Infant Academy | Primary | Academy | Sunderland | 439 |
| Hill View Junior Academy | Primary | Academy | Sunderland | 451 |
| Holley Park Academy | Primary | Academy | Washington | 204 |
| Houghton Le Spring Nursery School | Nursery | Maintained | Houghton le Spring | 142 |
| Hudson Road Primary School | Primary | Maintained | Sunderland | 345 |
| Hylton Castle Primary School | Primary | Maintained | Sunderland | 229 |
| Hylton Red House Nursery School | Nursery | Maintained | Sunderland | 122 |
| John F Kennedy Primary School | Primary | Academy | Washington | 412 |
| Kepier | Secondary | Academy | Houghton le Spring | 1,131 |
| Lambton Primary School | Primary | Maintained | Washington | 179 |
| Marlborough Primary School | Primary | Maintained | Washington | 150 |
| Mill Hill Nursery School | Nursery | Maintained | Sunderland | 169 |
| Mill Hill Primary School | Primary | Maintained | Sunderland | 434 |
| Monkwearmouth Academy | Secondary | Academy | Sunderland | 810 |
| New Penshaw Academy | Primary | Academy | Houghton le Spring | 112 |
| New Silksworth Academy Infant | Primary | Academy | Sunderland | 215 |
| New Silksworth Academy Junior | Primary | Academy | Sunderland | 200 |
| Newbottle Primary Academy | Primary | Academy | Houghton le Spring | 437 |
| North View Academy | Special | Academy | Sunderland | 71 |
| Northern Saints Church of England Academy | Primary | Academy | Sunderland | 423 |
| Our Lady Queen of Peace Catholic Primary School, Penshaw | Primary | Academy | Houghton le Spring | 291 |
| Oxclose Community Academy | Secondary | Academy | Washington | 1,029 |
| Oxclose Nursery School | Nursery | Maintained | Washington | 77 |
| Oxclose Primary Academy | Primary | Academy | Washington | 183 |
| Pennywell Early Years Centre | Nursery | Maintained | Sunderland | 147 |
| Plains Farm Academy | Primary | Academy | Sunderland | 164 |
| Portland Academy | Special | Academy | Sunderland | 207 |
| Red House Academy | Secondary | Academy | Sunderland | 432 |
| Redby Academy | Primary | Academy | Sunderland | 259 |
| Richard Avenue Primary School | Primary | Maintained | Sunderland | 445 |
| Rickleton Primary School | Primary | Maintained | Washington | 450 |
| Ryhope Infant School Academy | Primary | Academy | Sunderland | 172 |
| Ryhope Junior School | Primary | Maintained | Sunderland | 158 |
| Sandhill View Academy | Secondary | Academy | Sunderland | 743 |
| Seaburn Dene Primary School | Primary | Maintained | Sunderland | 218 |
| Shiney Row Primary School | Primary | Maintained | Houghton le Spring | 249 |
| South Hylton Primary Academy | Primary | Academy | Sunderland | 252 |
| Southmoor Academy | Secondary | Academy | Sunderland | 1,398 |
| Southwick Community Primary School | Primary | Maintained | Southwick | 345 |
| Springwell Village Primary School | Primary | Academy | Gateshead | 207 |
| St Aidan's Catholic Academy | Secondary | Academy | Sunderland | 1,057 |
| St Anne's Roman Catholic Voluntary Aided Primary School | Primary | Maintained | Sunderland | 238 |
| St Anthony's Girls' Catholic Academy | Secondary | Academy | Sunderland | 1,297 |
| St Bede's Catholic Primary School, Washington | Primary | Academy | Washington | 204 |
| St Benet's Roman Catholic Voluntary Aided Primary School | Primary | Maintained | Sunderland | 303 |
| St Cuthbert's Catholic Primary School, Sunderland | Primary | Academy | Sunderland | 240 |
| St John Bosco Catholic Primary School, Town End Farm, Sunderland | Primary | Academy | Sunderland | 203 |
| St John Boste Catholic Primary School, Washington | Primary | Academy | Washington | 178 |
| St Joseph's Catholic Primary School, Sunderland | Primary | Academy | Sunderland | 247 |
| St Joseph's Catholic Primary School, Washington | Primary | Academy | Washington | 227 |
| St Leonard's Catholic Primary School, Silksworth | Primary | Academy | Sunderland | 207 |
| St Mary's Catholic Primary School, Sunderland | Primary | Academy | Sunderland | 472 |
| St Michael's Catholic Primary School, Houghton | Primary | Academy | Houghton le Spring | 193 |
| St Patrick's Catholic Primary School, Ryhope | Primary | Academy | Sunderland | 184 |
| St Paul's CofE Primary School | Primary | Maintained | Sunderland | 332 |
| St Robert of Newminster Catholic School and Sixth Form College, Washington | Secondary | Academy | Washington | 1,527 |
| Sunningdale School | Special | Maintained special | Sunderland | 153 |
| The Link School | Alternative provision | Maintained | Sunderland | 164 |
| Thorney Close Primary School | Primary | Maintained | Sunderland | 289 |
| Thornhill Academy | Secondary | Academy | Sunderland | 526 |
| Town End Academy | Primary | Academy | Sunderland | 218 |
| Trinity Academy New Bridge | Special | Academy | Sunderland | 128 |
| Usworth Colliery Nursery School | Nursery | Maintained | Washington | 90 |
| Usworth Colliery Primary School | Primary | Maintained | Washington | 333 |
| Valley Road Academy | Primary | Academy | Sunderland | 344 |
| Venerable Bede Church of England Academy | Secondary | Academy | Sunderland | 738 |
| Washington Academy | Secondary | Academy | Washington | 627 |
| Wessington Primary School | Primary | Maintained | Washington | 218 |
| Willow Wood Community Primary School | Primary | Maintained | Sunderland | 290 |