Stockport
113 state-funded schools with 42,052 pupils on roll, in the North West region. Every school’s page has its published figures against Stockport and England.
- Primary
- 85
- Secondary
- 14
- Special
- 7
- Alternative provision
- 4
- Nursery
- 3
- Maintained
- 68
- Academies
- 36
- Free schools
- 5
- Maintained special
- 4
Map
Zoom in to see each school. Open the full map
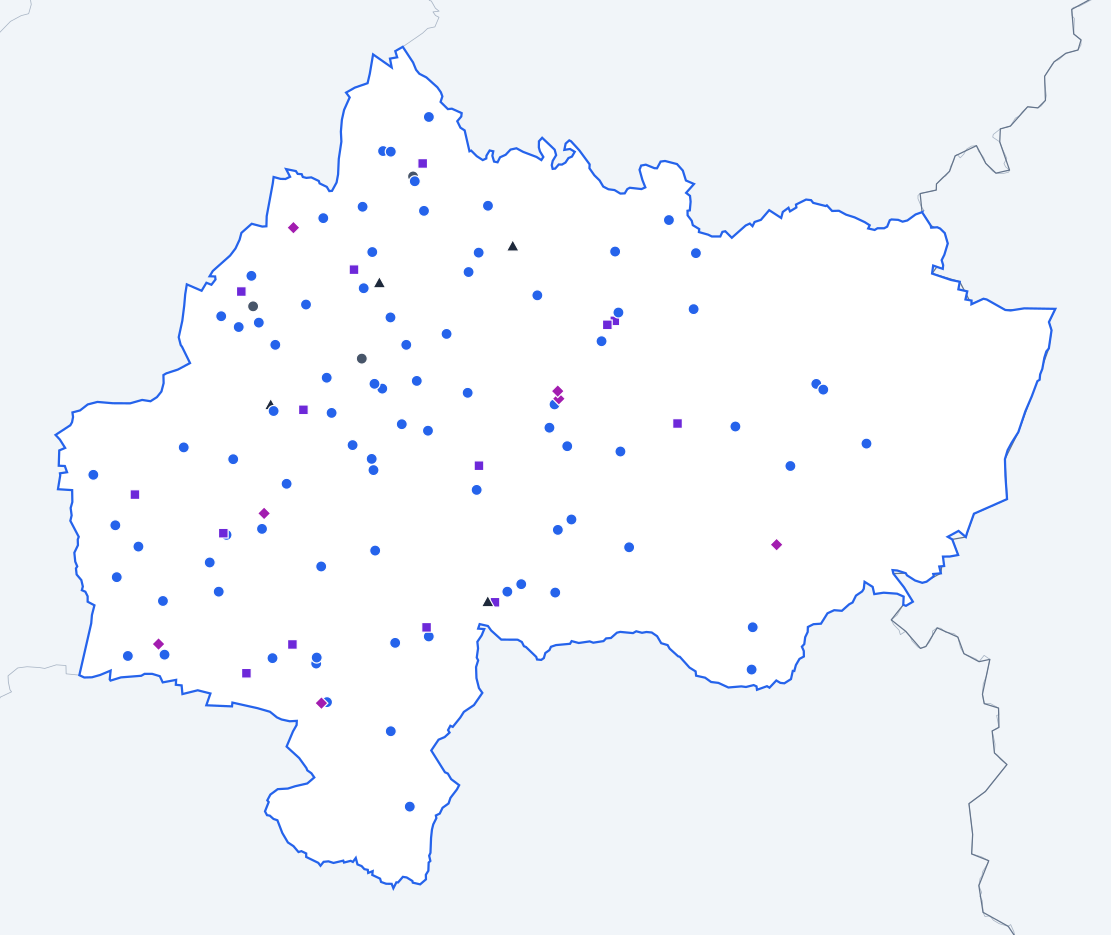
ONS, OS © Crown copyright 2025 · GIAS · © OpenStreetMap
Stockport against England
Published figures for the authority’s schools, set against the same kind of school across England.
All state-funded schools
Overall absence
2024/256.5%
- England
- 6.8%
0.3 percentage points lower than England.
Show the figures as a table
| Year | Stockport | England |
|---|---|---|
| 2017/18 | 5.0% | 4.8% |
| 2018/19 | 4.5% | 4.7% |
| 2020/21 | 4.5% | 4.6% |
| 2021/22 | 7.2% | 7.6% |
| 2022/23 | 6.9% | 7.4% |
| 2023/24 | 6.8% | 7.1% |
| 2024/25 | 6.5% | 6.8% |
Sessions missed for any reason, as a share of all possible sessions in the school year. Source: Department for Education, Explore Education Statistics, Pupil absence in schools in England, 2024/25.
Persistent absence
2024/2516.6%
- England
- 18.1%
1.5 percentage points lower than England.
Show the figures as a table
| Year | Stockport | England |
|---|---|---|
| 2017/18 | 11.8% | 11.2% |
| 2018/19 | 10.3% | 10.9% |
| 2020/21 | 11.9% | 12.1% |
| 2021/22 | 20.1% | 22.5% |
| 2022/23 | 19.1% | 21.2% |
| 2023/24 | 18.5% | 20.0% |
| 2024/25 | 16.6% | 18.1% |
Pupils who missed 10% or more of their possible sessions, as a share of pupils. Source: Department for Education, Explore Education Statistics, Pupil absence in schools in England, 2024/25.
Severe absence
2024/252.5%
- England
- 2.4%
0.1 percentage points higher than England.
Show the figures as a table
| Year | Stockport | England |
|---|---|---|
| 2017/18 | 1.0% | 0.8% |
| 2018/19 | 0.9% | 0.8% |
| 2020/21 | 0.9% | 1.1% |
| 2021/22 | 1.7% | 1.7% |
| 2022/23 | 2.0% | 2.0% |
| 2023/24 | 2.2% | 2.3% |
| 2024/25 | 2.5% | 2.4% |
Pupils who missed 50% or more of their possible sessions, as a share of pupils. Source: Department for Education, Explore Education Statistics, Pupil absence in schools in England, 2024/25.
Suspensions per 100 pupils
2024/258.77
- England
- 10.88
2.11 lower than England.
Show the figures as a table
| Year | Stockport | England |
|---|---|---|
| 2017/18 | 4.42 | 5.08 |
| 2018/19 | 5.26 | 5.36 |
| 2019/20 | 3.36 | 3.76 |
| 2020/21 | 4.06 | 4.25 |
| 2021/22 | 7.03 | 6.91 |
| 2022/23 | 9.40 | 9.33 |
| 2023/24 | 8.73 | 11.31 |
| 2024/25 | 8.77 | 10.88 |
Suspensions in the school year for every 100 pupils on roll. One pupil can be suspended more than once. Source: Department for Education, Explore Education Statistics, Suspensions and permanent exclusions in England, 2024/25.
Permanent exclusions per 100 pupils
2024/250.15
- England
- 0.12
0.03 higher than England.
Show the figures as a table
| Year | Stockport | England |
|---|---|---|
| 2017/18 | 0.11 | 0.10 |
| 2018/19 | 0.13 | 0.10 |
| 2019/20 | 0.09 | 0.06 |
| 2020/21 | 0.07 | 0.05 |
| 2021/22 | 0.13 | 0.08 |
| 2022/23 | 0.18 | 0.11 |
| 2023/24 | 0.15 | 0.13 |
| 2024/25 | 0.15 | 0.12 |
Permanent exclusions in the school year for every 100 pupils on roll. Source: Department for Education, Explore Education Statistics, Suspensions and permanent exclusions in England, 2024/25.
Eligible for free school meals
2024/2521.6%
- England
- 25.7%
4.1 percentage points lower than England.
Show the figures as a table
| Year | Stockport | England |
|---|---|---|
| 2021/22 | 18.6% | 22.5% |
| 2022/23 | 19.9% | 23.8% |
| 2023/24 | 20.7% | 24.6% |
| 2024/25 | 21.6% | 25.7% |
Pupils known to be eligible for free school meals on census day in January. Source: Department for Education, Explore Education Statistics, Schools, pupils and their characteristics, 2024/25.
SEN support
2024/2514.2%
- England
- 14.0%
0.2 percentage points higher than England.
Show the figures as a table
| Year | Stockport | England |
|---|---|---|
| 2021/22 | 11.5% | 12.4% |
| 2022/23 | 12.7% | 12.9% |
| 2023/24 | 13.3% | 13.4% |
| 2024/25 | 14.2% | 14.0% |
Pupils receiving special educational needs support without an education, health and care plan. Source: Department for Education, Explore Education Statistics, Schools, pupils and their characteristics, 2024/25.
Education, health and care plan
2024/255.6%
- England
- 5.2%
0.4 percentage points higher than England.
Show the figures as a table
| Year | Stockport | England |
|---|---|---|
| 2021/22 | 4.2% | 3.8% |
| 2022/23 | 4.5% | 4.2% |
| 2023/24 | 4.8% | 4.7% |
| 2024/25 | 5.6% | 5.2% |
Pupils with an education, health and care plan. Source: Department for Education, Explore Education Statistics, Schools, pupils and their characteristics, 2024/25.
First language other than English
2024/2513.8%
- England
- 21.4%
7.6 percentage points lower than England.
Show the figures as a table
| Year | Stockport | England |
|---|---|---|
| 2021/22 | 10.7% | 19.6% |
| 2022/23 | 12.1% | 20.2% |
| 2023/24 | 13.2% | 20.8% |
| 2024/25 | 13.8% | 21.4% |
Pupils whose first language is known or believed to be other than English. Source: Department for Education, Explore Education Statistics, Schools, pupils and their characteristics, 2024/25.
Pupils per qualified teacher
2025/2618.1
- England
- 18.5
0.4 lower than England.
Show the figures as a table
| Year | Stockport | England |
|---|---|---|
| 2017/18 | 18.5 | 18.4 |
| 2018/19 | 18.7 | 18.6 |
| 2019/20 | 19.0 | 18.8 |
| 2020/21 | 18.8 | 18.5 |
| 2021/22 | 18.4 | 18.5 |
| 2022/23 | 18.3 | 18.5 |
| 2023/24 | 18.1 | 18.6 |
| 2024/25 | 17.9 | 18.6 |
| 2025/26 | 18.1 | 18.5 |
Full-time equivalent pupils for each full-time equivalent qualified teacher. Source: Department for Education, Explore Education Statistics, School workforce in England, 2025/26.
Teacher sickness absence
2024/255.3 days
- England
- 5.0 days
0.3 days higher than England.
Show the figures as a table
| Year | Stockport | England |
|---|---|---|
| 2017/18 | 5.0 days | 4.0 days |
| 2018/19 | 4.1 days | 4.0 days |
| 2019/20 | Not published | Not published |
| 2020/21 | 3.1 days | 3.9 days |
| 2021/22 | 5.7 days | 6.3 days |
| 2022/23 | 5.2 days | 5.2 days |
| 2023/24 | 5.7 days | 5.3 days |
| 2024/25 | 5.3 days | 5.0 days |
Days lost to sickness absence in the school year, averaged across all teachers. Source: Department for Education, Explore Education Statistics, School workforce in England, 2024/25.
Primary schools
Overall absence
2024/254.6%
- England
- 5.2%
0.6 percentage points lower than England.
Show the figures as a table
| Year | Stockport | England |
|---|---|---|
| 2017/18 | 4.1% | 4.2% |
| 2018/19 | 3.8% | 4.0% |
| 2020/21 | 3.9% | 3.6% |
| 2021/22 | 5.9% | 6.3% |
| 2022/23 | 5.4% | 5.9% |
| 2023/24 | 5.3% | 5.5% |
| 2024/25 | 4.6% | 5.2% |
Sessions missed for any reason, as a share of all possible sessions in the school year. Source: Department for Education, Explore Education Statistics, Pupil absence in schools in England, 2024/25.
Persistent absence
2024/2511.1%
- England
- 13.0%
1.9 percentage points lower than England.
Show the figures as a table
| Year | Stockport | England |
|---|---|---|
| 2017/18 | 8.5% | 8.7% |
| 2018/19 | 7.7% | 8.2% |
| 2020/21 | 10.3% | 8.8% |
| 2021/22 | 15.9% | 17.7% |
| 2022/23 | 14.5% | 16.2% |
| 2023/24 | 13.7% | 14.6% |
| 2024/25 | 11.1% | 13.0% |
Pupils who missed 10% or more of their possible sessions, as a share of pupils. Source: Department for Education, Explore Education Statistics, Pupil absence in schools in England, 2024/25.
Severe absence
2024/250.5%
- England
- 0.9%
0.4 percentage points lower than England.
Show the figures as a table
| Year | Stockport | England |
|---|---|---|
| 2017/18 | 0.2% | 0.4% |
| 2018/19 | 0.3% | 0.4% |
| 2020/21 | 0.5% | 0.7% |
| 2021/22 | 0.5% | 0.6% |
| 2022/23 | 0.5% | 0.7% |
| 2023/24 | 0.6% | 0.9% |
| 2024/25 | 0.5% | 0.9% |
Pupils who missed 50% or more of their possible sessions, as a share of pupils. Source: Department for Education, Explore Education Statistics, Pupil absence in schools in England, 2024/25.
Suspensions per 100 pupils
2024/251.22
- England
- 2.47
1.25 lower than England.
Show the figures as a table
| Year | Stockport | England |
|---|---|---|
| 2017/18 | 1.39 | 1.40 |
| 2018/19 | 1.24 | 1.41 |
| 2019/20 | 0.77 | 1.00 |
| 2020/21 | 0.87 | 0.99 |
| 2021/22 | 1.06 | 1.42 |
| 2022/23 | 1.02 | 1.81 |
| 2023/24 | 1.27 | 2.27 |
| 2024/25 | 1.22 | 2.47 |
Suspensions in the school year for every 100 pupils on roll. One pupil can be suspended more than once. Source: Department for Education, Explore Education Statistics, Suspensions and permanent exclusions in England, 2024/25.
Permanent exclusions per 100 pupils
2024/250.01
- England
- 0.03
0.02 lower than England.
Show the figures as a table
| Year | Stockport | England |
|---|---|---|
| 2017/18 | 0.02 | 0.03 |
| 2018/19 | 0.01 | 0.02 |
| 2019/20 | 0.02 | 0.02 |
| 2020/21 | 0.00 | 0.01 |
| 2021/22 | 0.00 | 0.02 |
| 2022/23 | 0.02 | 0.03 |
| 2023/24 | 0.01 | 0.03 |
| 2024/25 | 0.01 | 0.03 |
Permanent exclusions in the school year for every 100 pupils on roll. Source: Department for Education, Explore Education Statistics, Suspensions and permanent exclusions in England, 2024/25.
Reading, writing and maths: expected standard
2025/26 (provisional)67%
- England
- 63%
4 percentage points higher than England.
Show the figures as a table
| Year | Stockport | England |
|---|---|---|
| 2021/22 | 62% | 59% |
| 2022/23 | 62% | 60% |
| 2023/24 | 64% | 61% |
| 2024/25 | 66% | 63% |
| 2025/26 (provisional) | 67% | 63% |
Pupils at the end of key stage 2 who met the expected standard in reading, writing and maths combined. Source: Department for Education, Explore Education Statistics, Key stage 2 attainment, 2025/26.
Reading, writing and maths: higher standard
2025/26 (provisional)9%
- England
- 9%
The same as England.
Show the figures as a table
| Year | Stockport | England |
|---|---|---|
| 2021/22 | 8% | 7% |
| 2022/23 | 9% | 8% |
| 2023/24 | 8% | 8% |
| 2024/25 | 10% | 8% |
| 2025/26 (provisional) | 9% | 9% |
Pupils at the end of key stage 2 who met the higher standard in reading, writing and maths combined. Source: Department for Education, Explore Education Statistics, Key stage 2 attainment, 2025/26.
Eligible for free school meals
2024/2519.9%
- England
- 24.7%
4.8 percentage points lower than England.
Show the figures as a table
| Year | Stockport | England |
|---|---|---|
| 2021/22 | 17.6% | 23.1% |
| 2022/23 | 18.6% | 24.0% |
| 2023/24 | 19.2% | 24.3% |
| 2024/25 | 19.9% | 24.7% |
Pupils known to be eligible for free school meals on census day in January. Source: Department for Education, Explore Education Statistics, Schools, pupils and their characteristics, 2024/25.
SEN support
2024/2513.2%
- England
- 15.0%
1.8 percentage points lower than England.
Show the figures as a table
| Year | Stockport | England |
|---|---|---|
| 2021/22 | 10.9% | 13.0% |
| 2022/23 | 11.9% | 13.5% |
| 2023/24 | 12.5% | 14.1% |
| 2024/25 | 13.2% | 15.0% |
Pupils receiving special educational needs support without an education, health and care plan. Source: Department for Education, Explore Education Statistics, Schools, pupils and their characteristics, 2024/25.
Education, health and care plan
2024/253.5%
- England
- 3.5%
The same as England.
Show the figures as a table
| Year | Stockport | England |
|---|---|---|
| 2021/22 | 2.5% | 2.3% |
| 2022/23 | 2.7% | 2.5% |
| 2023/24 | 3.0% | 3.0% |
| 2024/25 | 3.5% | 3.5% |
Pupils with an education, health and care plan. Source: Department for Education, Explore Education Statistics, Schools, pupils and their characteristics, 2024/25.
First language other than English
2024/2514.7%
- England
- 23.4%
8.7 percentage points lower than England.
Show the figures as a table
| Year | Stockport | England |
|---|---|---|
| 2021/22 | 11.9% | 21.2% |
| 2022/23 | 13.3% | 22.0% |
| 2023/24 | 14.4% | 22.8% |
| 2024/25 | 14.7% | 23.4% |
Pupils whose first language is known or believed to be other than English. Source: Department for Education, Explore Education Statistics, Schools, pupils and their characteristics, 2024/25.
Pupils per qualified teacher
2025/2621.3
- England
- 21.2
0.1 higher than England.
Show the figures as a table
| Year | Stockport | England |
|---|---|---|
| 2017/18 | 21.7 | 21.3 |
| 2018/19 | 21.9 | 21.4 |
| 2019/20 | 22.3 | 21.4 |
| 2020/21 | 22.0 | 21.1 |
| 2021/22 | 21.3 | 21.0 |
| 2022/23 | 21.2 | 21.1 |
| 2023/24 | 20.9 | 21.2 |
| 2024/25 | 21.0 | 21.3 |
| 2025/26 | 21.3 | 21.2 |
Full-time equivalent pupils for each full-time equivalent qualified teacher. Source: Department for Education, Explore Education Statistics, School workforce in England, 2025/26.
Secondary schools
Overall absence
2024/258.9%
- England
- 8.4%
0.5 percentage points higher than England.
Show the figures as a table
| Year | Stockport | England |
|---|---|---|
| 2017/18 | 6.2% | 5.5% |
| 2018/19 | 5.5% | 5.5% |
| 2020/21 | 4.9% | 5.5% |
| 2021/22 | 8.7% | 9.0% |
| 2022/23 | 8.9% | 9.0% |
| 2023/24 | 8.8% | 8.9% |
| 2024/25 | 8.9% | 8.4% |
Sessions missed for any reason, as a share of all possible sessions in the school year. Source: Department for Education, Explore Education Statistics, Pupil absence in schools in England, 2024/25.
Persistent absence
2024/2522.8%
- England
- 23.4%
0.6 percentage points lower than England.
Show the figures as a table
| Year | Stockport | England |
|---|---|---|
| 2017/18 | 15.7% | 13.9% |
| 2018/19 | 13.4% | 13.7% |
| 2020/21 | 12.9% | 14.8% |
| 2021/22 | 25.0% | 27.7% |
| 2022/23 | 24.6% | 26.5% |
| 2023/24 | 24.1% | 25.6% |
| 2024/25 | 22.8% | 23.4% |
Pupils who missed 10% or more of their possible sessions, as a share of pupils. Source: Department for Education, Explore Education Statistics, Pupil absence in schools in England, 2024/25.
Severe absence
2024/254.8%
- England
- 3.9%
0.9 percentage points higher than England.
Show the figures as a table
| Year | Stockport | England |
|---|---|---|
| 2017/18 | 1.9% | 1.2% |
| 2018/19 | 1.8% | 1.3% |
| 2020/21 | 1.3% | 1.5% |
| 2021/22 | 3.3% | 2.7% |
| 2022/23 | 3.9% | 3.4% |
| 2023/24 | 4.2% | 3.8% |
| 2024/25 | 4.8% | 3.9% |
Pupils who missed 50% or more of their possible sessions, as a share of pupils. Source: Department for Education, Explore Education Statistics, Pupil absence in schools in England, 2024/25.
Suspensions per 100 pupils
2024/2520.45
- England
- 21.24
0.79 lower than England.
Show the figures as a table
| Year | Stockport | England |
|---|---|---|
| 2017/18 | 9.58 | 10.13 |
| 2018/19 | 12.22 | 10.75 |
| 2019/20 | 7.69 | 7.43 |
| 2020/21 | 9.42 | 8.48 |
| 2021/22 | 17.03 | 13.96 |
| 2022/23 | 23.25 | 18.90 |
| 2023/24 | 20.67 | 22.61 |
| 2024/25 | 20.45 | 21.24 |
Suspensions in the school year for every 100 pupils on roll. One pupil can be suspended more than once. Source: Department for Education, Explore Education Statistics, Suspensions and permanent exclusions in England, 2024/25.
Permanent exclusions per 100 pupils
2024/250.38
- England
- 0.23
0.15 higher than England.
Show the figures as a table
| Year | Stockport | England |
|---|---|---|
| 2017/18 | 0.28 | 0.20 |
| 2018/19 | 0.35 | 0.20 |
| 2019/20 | 0.24 | 0.13 |
| 2020/21 | 0.19 | 0.10 |
| 2021/22 | 0.35 | 0.16 |
| 2022/23 | 0.45 | 0.22 |
| 2023/24 | 0.39 | 0.25 |
| 2024/25 | 0.38 | 0.23 |
Permanent exclusions in the school year for every 100 pupils on roll. Source: Department for Education, Explore Education Statistics, Suspensions and permanent exclusions in England, 2024/25.
Attainment 8
2025/26 (provisional)50.1
- England
- 47.4
2.7 higher than England.
Show the figures as a table
| Year | Stockport | England |
|---|---|---|
| 2021/22 | 51.3 | 49.8 |
| 2022/23 | 48.0 | 47.2 |
| 2023/24 | 48.9 | 46.9 |
| 2024/25 | 48.3 | 47.1 |
| 2025/26 (provisional) | 50.1 | 47.4 |
The average of pupils' points across eight GCSE-level qualifications, with English and maths counted twice. Source: Department for Education, Explore Education Statistics, Key stage 4 performance, 2025/26.
English and maths: grade 4 or above
2025/26 (provisional)71%
- England
- 66%
5 percentage points higher than England.
Show the figures as a table
| Year | Stockport | England |
|---|---|---|
| 2021/22 | 74% | 70% |
| 2022/23 | 69% | 67% |
| 2023/24 | 70% | 67% |
| 2024/25 | 69% | 66% |
| 2025/26 (provisional) | 71% | 66% |
Pupils at the end of key stage 4 with grade 4 or above in both English and maths. Source: Department for Education, Explore Education Statistics, Key stage 4 performance, 2025/26.
English and maths: grade 5 or above
2025/26 (provisional)53%
- England
- 48%
5 percentage points higher than England.
Show the figures as a table
| Year | Stockport | England |
|---|---|---|
| 2021/22 | 53% | 51% |
| 2022/23 | 48% | 46% |
| 2023/24 | 51% | 47% |
| 2024/25 | 50% | 47% |
| 2025/26 (provisional) | 53% | 48% |
Pupils at the end of key stage 4 with grade 5 or above in both English and maths. Source: Department for Education, Explore Education Statistics, Key stage 4 performance, 2025/26.
Eligible for free school meals
2024/2522.9%
- England
- 25.8%
2.9 percentage points lower than England.
Show the figures as a table
| Year | Stockport | England |
|---|---|---|
| 2021/22 | 19.2% | 20.9% |
| 2022/23 | 20.9% | 22.7% |
| 2023/24 | 21.8% | 24.1% |
| 2024/25 | 22.9% | 25.8% |
Pupils known to be eligible for free school meals on census day in January. Source: Department for Education, Explore Education Statistics, Schools, pupils and their characteristics, 2024/25.
SEN support
2024/2515.9%
- England
- 13.4%
2.5 percentage points higher than England.
Show the figures as a table
| Year | Stockport | England |
|---|---|---|
| 2021/22 | 12.9% | 11.9% |
| 2022/23 | 14.1% | 12.4% |
| 2023/24 | 14.4% | 12.9% |
| 2024/25 | 15.9% | 13.4% |
Pupils receiving special educational needs support without an education, health and care plan. Source: Department for Education, Explore Education Statistics, Schools, pupils and their characteristics, 2024/25.
Education, health and care plan
2024/253.5%
- England
- 3.1%
0.4 percentage points higher than England.
Show the figures as a table
| Year | Stockport | England |
|---|---|---|
| 2021/22 | 2.7% | 2.2% |
| 2022/23 | 2.9% | 2.4% |
| 2023/24 | 3.0% | 2.7% |
| 2024/25 | 3.5% | 3.1% |
Pupils with an education, health and care plan. Source: Department for Education, Explore Education Statistics, Schools, pupils and their characteristics, 2024/25.
First language other than English
2024/2512.8%
- England
- 19.2%
6.4 percentage points lower than England.
Show the figures as a table
| Year | Stockport | England |
|---|---|---|
| 2021/22 | 8.9% | 17.5% |
| 2022/23 | 10.3% | 18.1% |
| 2023/24 | 11.7% | 18.6% |
| 2024/25 | 12.8% | 19.2% |
Pupils whose first language is known or believed to be other than English. Source: Department for Education, Explore Education Statistics, Schools, pupils and their characteristics, 2024/25.
Pupils per qualified teacher
2025/2616.3
- England
- 17.3
1.0 lower than England.
Show the figures as a table
| Year | Stockport | England |
|---|---|---|
| 2017/18 | 16.3 | 16.5 |
| 2018/19 | 16.5 | 16.8 |
| 2019/20 | 16.7 | 17.2 |
| 2020/21 | 16.6 | 17.1 |
| 2021/22 | 16.5 | 17.1 |
| 2022/23 | 16.4 | 17.2 |
| 2023/24 | 16.4 | 17.4 |
| 2024/25 | 16.1 | 17.3 |
| 2025/26 | 16.3 | 17.3 |
Full-time equivalent pupils for each full-time equivalent qualified teacher. Source: Department for Education, Explore Education Statistics, School workforce in England, 2025/26.
Special schools
Overall absence
2024/2512.8%
- England
- 12.8%
The same as England.
Show the figures as a table
| Year | Stockport | England |
|---|---|---|
| 2017/18 | 11.3% | 10.2% |
| 2018/19 | 9.5% | 10.1% |
| 2020/21 | 12.2% | 15.2% |
| 2021/22 | 11.9% | 13.2% |
| 2022/23 | 11.1% | 13.0% |
| 2023/24 | 12.2% | 13.0% |
| 2024/25 | 12.8% | 12.8% |
Sessions missed for any reason, as a share of all possible sessions in the school year. Source: Department for Education, Explore Education Statistics, Pupil absence in schools in England, 2024/25.
Persistent absence
2024/2534.4%
- England
- 35.3%
0.9 percentage points lower than England.
Show the figures as a table
| Year | Stockport | England |
|---|---|---|
| 2017/18 | 34.2% | 29.6% |
| 2018/19 | 27.1% | 28.8% |
| 2020/21 | 38.2% | 48.9% |
| 2021/22 | 37.8% | 40.4% |
| 2022/23 | 35.1% | 38.3% |
| 2023/24 | 35.7% | 37.2% |
| 2024/25 | 34.4% | 35.3% |
Pupils who missed 10% or more of their possible sessions, as a share of pupils. Source: Department for Education, Explore Education Statistics, Pupil absence in schools in England, 2024/25.
Severe absence
2024/257.4%
- England
- 6.9%
0.5 percentage points higher than England.
Show the figures as a table
| Year | Stockport | England |
|---|---|---|
| 2017/18 | 6.4% | 4.4% |
| 2018/19 | 4.1% | 4.6% |
| 2020/21 | 4.1% | 5.6% |
| 2021/22 | 4.8% | 5.8% |
| 2022/23 | 4.4% | 6.2% |
| 2023/24 | 6.1% | 6.7% |
| 2024/25 | 7.4% | 6.9% |
Pupils who missed 50% or more of their possible sessions, as a share of pupils. Source: Department for Education, Explore Education Statistics, Pupil absence in schools in England, 2024/25.
Suspensions per 100 pupils
2024/2512.93
- England
- 12.32
0.61 higher than England.
Show the figures as a table
| Year | Stockport | England |
|---|---|---|
| 2017/18 | 12.62 | 12.34 |
| 2018/19 | 9.69 | 11.32 |
| 2019/20 | 6.67 | 7.76 |
| 2020/21 | 3.80 | 7.29 |
| 2021/22 | 5.23 | 9.60 |
| 2022/23 | 7.17 | 10.99 |
| 2023/24 | 10.59 | 12.62 |
| 2024/25 | 12.93 | 12.32 |
Suspensions in the school year for every 100 pupils on roll. One pupil can be suspended more than once. Source: Department for Education, Explore Education Statistics, Suspensions and permanent exclusions in England, 2024/25.
Permanent exclusions per 100 pupils
2024/250.10
- England
- 0.08
0.02 higher than England.
Show the figures as a table
| Year | Stockport | England |
|---|---|---|
| 2017/18 | 0.00 | 0.07 |
| 2018/19 | 0.00 | 0.06 |
| 2019/20 | 0.00 | 0.04 |
| 2020/21 | 0.00 | 0.03 |
| 2021/22 | 0.00 | 0.05 |
| 2022/23 | 0.00 | 0.08 |
| 2023/24 | 0.00 | 0.08 |
| 2024/25 | 0.10 | 0.08 |
Permanent exclusions in the school year for every 100 pupils on roll. Source: Department for Education, Explore Education Statistics, Suspensions and permanent exclusions in England, 2024/25.
Eligible for free school meals
2024/2543.0%
- England
- 48.8%
5.8 percentage points lower than England.
Show the figures as a table
| Year | Stockport | England |
|---|---|---|
| 2021/22 | 41.0% | 44.4% |
| 2022/23 | 40.6% | 45.6% |
| 2023/24 | 41.1% | 47.1% |
| 2024/25 | 43.0% | 48.8% |
Pupils known to be eligible for free school meals on census day in January. Source: Department for Education, Explore Education Statistics, Schools, pupils and their characteristics, 2024/25.
SEN support
2024/250.2%
- England
- 0.5%
0.3 percentage points lower than England.
Show the figures as a table
| Year | Stockport | England |
|---|---|---|
| 2021/22 | 0.8% | 0.9% |
| 2022/23 | 0.4% | 0.8% |
| 2023/24 | 0.5% | 0.7% |
| 2024/25 | 0.2% | 0.5% |
Pupils receiving special educational needs support without an education, health and care plan. Source: Department for Education, Explore Education Statistics, Schools, pupils and their characteristics, 2024/25.
Education, health and care plan
2024/2599.8%
- England
- 99.5%
0.3 percentage points higher than England.
Show the figures as a table
| Year | Stockport | England |
|---|---|---|
| 2021/22 | 99.2% | 99.1% |
| 2022/23 | 99.6% | 99.2% |
| 2023/24 | 99.5% | 99.3% |
| 2024/25 | 99.8% | 99.5% |
Pupils with an education, health and care plan. Source: Department for Education, Explore Education Statistics, Schools, pupils and their characteristics, 2024/25.
First language other than English
2024/258.4%
- England
- 14.4%
6.0 percentage points lower than England.
Show the figures as a table
| Year | Stockport | England |
|---|---|---|
| 2021/22 | 8.4% | 14.5% |
| 2022/23 | 8.0% | 14.4% |
| 2023/24 | 8.5% | 14.4% |
| 2024/25 | 8.4% | 14.4% |
Pupils whose first language is known or believed to be other than English. Source: Department for Education, Explore Education Statistics, Schools, pupils and their characteristics, 2024/25.
Pupils per qualified teacher
2025/266.9
- England
- 7.3
0.4 lower than England.
Show the figures as a table
| Year | Stockport | England |
|---|---|---|
| 2017/18 | 5.5 | 6.7 |
| 2018/19 | 5.7 | 6.8 |
| 2019/20 | 5.9 | 7.0 |
| 2020/21 | 6.0 | 6.8 |
| 2021/22 | 6.4 | 6.9 |
| 2022/23 | 6.0 | 7.0 |
| 2023/24 | 6.3 | 7.1 |
| 2024/25 | 6.3 | 7.3 |
| 2025/26 | 6.9 | 7.3 |
Full-time equivalent pupils for each full-time equivalent qualified teacher. Source: Department for Education, Explore Education Statistics, School workforce in England, 2025/26.
Schools in Stockport
Listed by name. Filter by phase or type; sort by name or size. Nothing here is sorted by results.
Showing 113 of 113 schools in Stockport.
| School | Phase | Type | Town | Pupils |
|---|---|---|---|---|
| Abingdon Primary School | Primary | Maintained | Stockport | 231 |
| Adswood Primary School | Primary | Academy | Stockport | Not published |
| Alexandra Park Primary School | Primary | Academy | Stockport | 458 |
| All Saints Church of England Primary School Marple | Primary | Maintained | Stockport | 207 |
| All Saints Church of England Primary School Stockport | Primary | Maintained | Stockport | 174 |
| Arden Primary School | Primary | Maintained | Stockport | 472 |
| Banks Lane Infant School | Primary | Maintained | Stockport | 274 |
| Banks Lane Junior School | Primary | Maintained | Stockport | 358 |
| Bolshaw Primary School | Primary | Academy | Cheadle | 203 |
| Bradshaw Hall Primary School | Primary | Maintained | Cheadle | 472 |
| Bramhall High School | Secondary | Maintained | Stockport | 1,295 |
| Bramhall Park Primary School | Primary | Maintained | Stockport | 228 |
| Bredbury Green Primary School | Primary | Academy | Stockport | 237 |
| Bredbury St. Marks CofE Primary School | Primary | Academy | Stockport | 164 |
| Bridge Hall Primary School | Primary | Maintained | Stockport | 167 |
| Broadstone Hall Primary School | Primary | Maintained | Stockport | 503 |
| Brookside Primary School | Primary | Maintained | Stockport | 130 |
| Cale Green Primary School | Primary | Maintained | Stockport | 329 |
| Castle Hill High School | Special | Maintained special | Stockport | 350 |
| Cheadle Catholic Infant School | Primary | Maintained | Cheadle | 248 |
| Cheadle Catholic Junior School | Primary | Maintained | Cheadle | 355 |
| Cheadle Heath Primary School | Primary | Maintained | Stockport | 349 |
| Cheadle Hulme High School | Secondary | Academy | Cheadle | 1,690 |
| Cheadle Hulme Primary School | Primary | Free school | Stockport | 458 |
| Cheadle Village Primary School | Primary | Maintained | Cheadle | 236 |
| Dial Park Primary School | Primary | Academy | Stockport | 350 |
| Didsbury Road Primary School | Primary | Maintained | Stockport | 454 |
| Etchells Primary School | Primary | Maintained | Cheadle | 397 |
| Fairway Primary School | Primary | Maintained | Stockport | 236 |
| Freshfield Nursery School | Nursery | Maintained | Stockport | 108 |
| Gatley Primary School | Primary | Academy | Stockport | 659 |
| Great Moor Infant School | Primary | Maintained | Stockport | 266 |
| Great Moor Junior School | Primary | Maintained | Stockport | 311 |
| Greave Primary School | Primary | Maintained | Stockport | 346 |
| Harrytown Catholic High School | Secondary | Maintained | Stockport | 792 |
| Hazel Grove High School | Secondary | Academy | Stockport | 1,452 |
| Hazel Grove Primary School | Primary | Academy | Stockport | 365 |
| Heaton School | Special | Maintained special | Stockport | 94 |
| High Lane Primary School | Primary | Academy | Stockport | 164 |
| Highfields College | Alternative provision | Maintained | Stockport | 182 |
| Hollywood Park Nursery School | Nursery | Maintained | Stockport | 83 |
| Hursthead Infant School | Primary | Maintained | Cheadle | 244 |
| Hursthead Junior School | Primary | Academy | Cheadle | 354 |
| Ladybridge Primary School | Primary | Maintained | Cheadle | 150 |
| Ladybrook Primary School | Primary | Maintained | Stockport | 241 |
| Lane End Primary School | Primary | Maintained | Stockport | 205 |
| Lark Hill Primary School | Primary | Maintained | Stockport | 173 |
| Laurus Cheadle Hulme | Secondary | Free school | Cheadle | 1,054 |
| Laurus Grace | Alternative provision | Free school | Stockport | 22 |
| Lisburne School | Special | Academy | Stockport | 222 |
| Ludworth Primary School | Primary | Maintained | Stockport | 373 |
| Lum Head Primary School | Primary | Maintained | Cheadle | 210 |
| Marple Hall School | Secondary | Academy | Stockport | 1,590 |
| Meadowbank Primary School | Primary | Academy | Cheadle | 424 |
| Mellor Primary School | Primary | Academy | Stockport | 231 |
| Mersey Vale Primary School | Primary | Maintained | Stockport | 158 |
| Moat House | Alternative provision | Maintained | Stockport | 14 |
| Moorfield Primary School | Primary | Maintained | Stockport | 367 |
| Moss Hey Primary School | Primary | Maintained | Stockport | 186 |
| Norbury Hall Primary School | Primary | Academy | Stockport | 457 |
| Norris Bank Primary School | Primary | Academy | Stockport | 403 |
| North Cheshire Jewish Primary School | Primary | Maintained | Cheadle | 173 |
| Oak Tree Primary School | Primary | Maintained | Stockport | 638 |
| Oakgrove School | Special | Academy | Cheadle | 40 |
| Our Lady's Catholic Primary School | Primary | Maintained | Stockport | 157 |
| Outwood Primary School | Primary | Maintained | Cheadle | 202 |
| Pear Tree Specialist Support High School | Special | Free school | Stockport | 96 |
| Pownall Green Primary School | Primary | Maintained | Stockport | 415 |
| Priestnall School | Secondary | Academy | Stockport | 1,312 |
| Prospect Vale Primary School | Primary | Maintained | Cheadle | 230 |
| Queensgate Primary School | Primary | Academy | Stockport | Not published |
| Reddish Vale High School | Secondary | Academy | Stockport | 999 |
| Reddish Vale Nursery School | Nursery | Maintained | Stockport | 113 |
| Romiley Primary School | Primary | Academy | Stockport | 454 |
| Rose Hill Primary School | Primary | Maintained | Stockport | 538 |
| St Ambrose Catholic Primary School | Primary | Maintained | Stockport | 178 |
| St Anne's RC Voluntary Academy | Secondary | Academy | Stockport | 666 |
| St Bernadette's Catholic Primary School | Primary | Maintained | Stockport | 212 |
| St Christopher's Catholic Primary School, a Voluntary Academy | Primary | Academy | Stockport | 201 |
| St Elisabeth's Church of England Primary | Primary | Academy | Stockport | 227 |
| St George's Church of England Primary School | Primary | Maintained | Stockport | 300 |
| St James' Catholic High School | Secondary | Maintained | Cheadle | 824 |
| St John's Church of England Primary School | Primary | Maintained | Stockport | 203 |
| St Joseph's Catholic Primary School, a Voluntary Academy | Primary | Academy | Stockport | 101 |
| St Joseph's Roman Catholic Primary School, Reddish, a Voluntary Academy | Primary | Academy | Stockport | 457 |
| St Mary's Catholic Voluntary Academy | Primary | Academy | Stockport | 222 |
| St Mary's Church of England Primary School | Primary | Maintained | Stockport | 180 |
| St Mary's Roman Catholic Primary School, a Voluntary Academy | Primary | Academy | Stockport | 90 |
| St Matthew's Church of England Primary School | Primary | Academy | Stockport | 201 |
| St Paul's Church of England Primary School Brinnington | Primary | Maintained | Stockport | 363 |
| St Peter's Catholic Primary School | Primary | Maintained | Stockport | 208 |
| St Philip's Catholic Primary School, a Voluntary Academy | Primary | Academy | Stockport | 166 |
| St Simon's Catholic Primary School | Primary | Maintained | Stockport | 190 |
| St Thomas' Church of England Primary School Heaton Chapel | Primary | Maintained | Stockport | 647 |
| St Thomas' Church of England Primary School Stockport | Primary | Maintained | Stockport | 149 |
| St Winifred's RC Primary School, a Voluntary Academy | Primary | Academy | Stockport | 355 |
| Stockport Academy | Secondary | Academy | Stockport | 1,023 |
| Stockport School | Secondary | Maintained | Stockport | 1,341 |
| The Kingsway School | Secondary | Academy | Cheadle | 1,260 |
| The Pendlebury Centre | Alternative provision | Maintained | Stockport | 7 |
| Thorn Grove Primary School | Primary | Maintained | Cheadle | 214 |
| Tithe Barn Primary School | Primary | Maintained | Stockport | 200 |
| Torkington Primary School | Primary | Maintained | Stockport | 233 |
| Vale View Primary School | Primary | Maintained | Stockport | 408 |
| Valley School | Special | Maintained special | Stockport | 56 |
| Vernon Park Primary School | Primary | Maintained | Stockport | 312 |
| Warren Wood Primary School | Primary | Maintained | Stockport | 411 |
| Werneth School | Secondary | Academy | Stockport | 925 |
| Westmorland Primary School | Primary | Maintained | Stockport | 436 |
| Whitehill Primary School | Primary | Maintained | Stockport | 196 |
| Windlehurst School | Special | Maintained special | Stockport | 65 |
| Woodford Primary School | Primary | Free school | Stockport | 149 |
| Woodley Primary School | Primary | Maintained | Stockport | 384 |