Redbridge
79 state-funded schools with 56,484 pupils on roll, in the London region. Every school’s page has its published figures against Redbridge and England.
- Primary
- 52
- Secondary
- 15
- All-through
- 4
- Special
- 5
- Alternative provision
- 3
- Maintained
- 56
- Academies
- 16
- Free schools
- 4
- Maintained special
- 3
Map
Zoom in to see each school. Open the full map
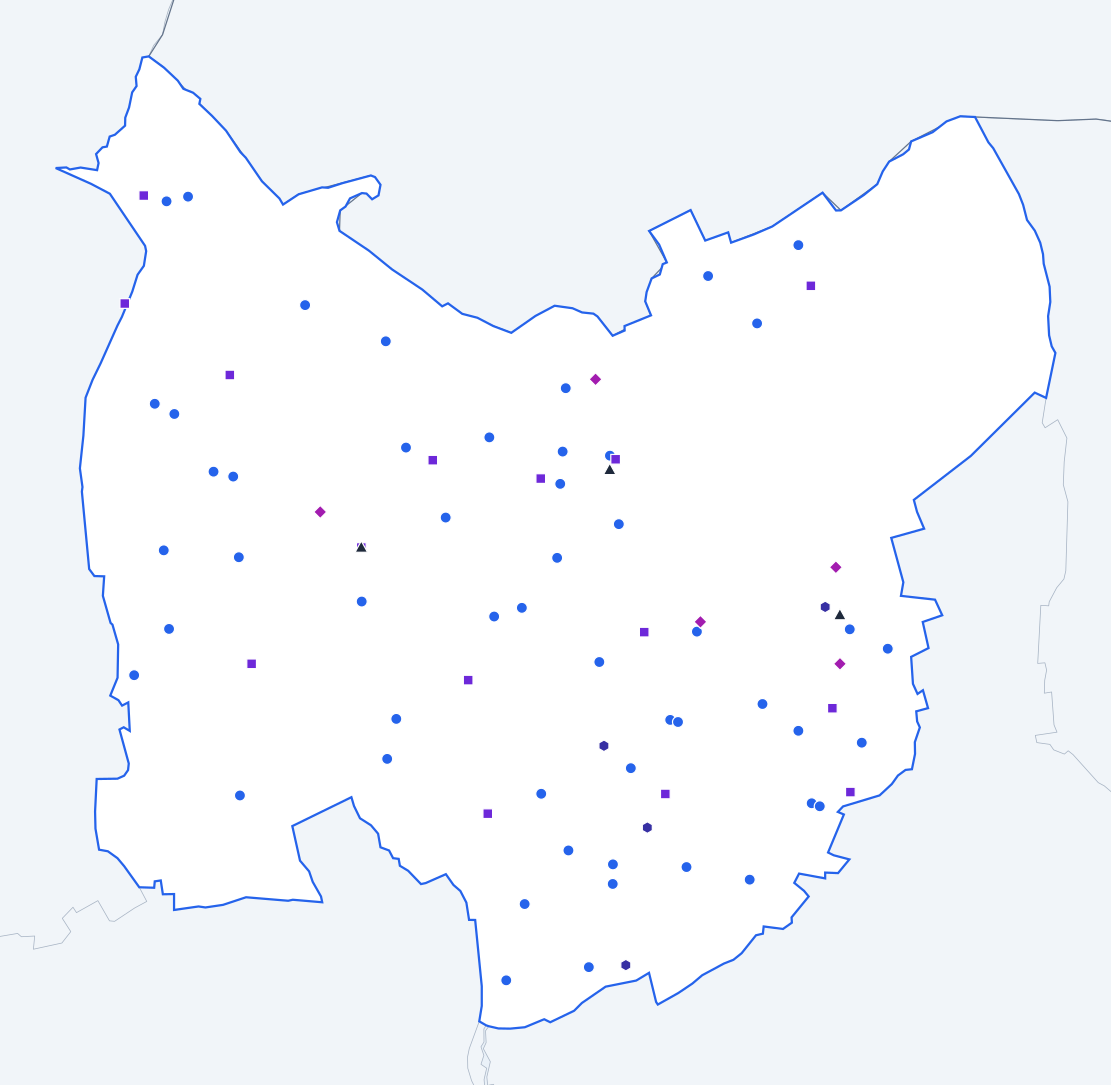
ONS, OS © Crown copyright 2025 · GIAS · © OpenStreetMap
Redbridge against England
Published figures for the authority’s schools, set against the same kind of school across England.
All state-funded schools
Overall absence
2024/256.3%
- England
- 6.8%
0.5 percentage points lower than England.
Show the figures as a table
| Year | Redbridge | England |
|---|---|---|
| 2017/18 | 4.6% | 4.8% |
| 2018/19 | 4.5% | 4.7% |
| 2020/21 | 4.4% | 4.6% |
| 2021/22 | 6.5% | 7.6% |
| 2022/23 | 7.1% | 7.4% |
| 2023/24 | 6.1% | 7.1% |
| 2024/25 | 6.3% | 6.8% |
Sessions missed for any reason, as a share of all possible sessions in the school year. Source: Department for Education, Explore Education Statistics, Pupil absence in schools in England, 2024/25.
Persistent absence
2024/2517.7%
- England
- 18.1%
0.4 percentage points lower than England.
Show the figures as a table
| Year | Redbridge | England |
|---|---|---|
| 2017/18 | 9.9% | 11.2% |
| 2018/19 | 9.9% | 10.9% |
| 2020/21 | 10.6% | 12.1% |
| 2021/22 | 19.4% | 22.5% |
| 2022/23 | 22.0% | 21.2% |
| 2023/24 | 17.0% | 20.0% |
| 2024/25 | 17.7% | 18.1% |
Pupils who missed 10% or more of their possible sessions, as a share of pupils. Source: Department for Education, Explore Education Statistics, Pupil absence in schools in England, 2024/25.
Severe absence
2024/251.2%
- England
- 2.4%
1.2 percentage points lower than England.
Show the figures as a table
| Year | Redbridge | England |
|---|---|---|
| 2017/18 | 0.7% | 0.8% |
| 2018/19 | 0.6% | 0.8% |
| 2020/21 | 1.0% | 1.1% |
| 2021/22 | 1.0% | 1.7% |
| 2022/23 | 1.1% | 2.0% |
| 2023/24 | 1.2% | 2.3% |
| 2024/25 | 1.2% | 2.4% |
Pupils who missed 50% or more of their possible sessions, as a share of pupils. Source: Department for Education, Explore Education Statistics, Pupil absence in schools in England, 2024/25.
Suspensions per 100 pupils
2024/253.65
- England
- 10.88
7.23 lower than England.
Show the figures as a table
| Year | Redbridge | England |
|---|---|---|
| 2017/18 | 2.59 | 5.08 |
| 2018/19 | 3.53 | 5.36 |
| 2019/20 | 1.99 | 3.76 |
| 2020/21 | 2.32 | 4.25 |
| 2021/22 | 3.83 | 6.91 |
| 2022/23 | 3.96 | 9.33 |
| 2023/24 | 4.12 | 11.31 |
| 2024/25 | 3.65 | 10.88 |
Suspensions in the school year for every 100 pupils on roll. One pupil can be suspended more than once. Source: Department for Education, Explore Education Statistics, Suspensions and permanent exclusions in England, 2024/25.
Permanent exclusions per 100 pupils
2024/250.04
- England
- 0.12
0.08 lower than England.
Show the figures as a table
| Year | Redbridge | England |
|---|---|---|
| 2017/18 | 0.07 | 0.10 |
| 2018/19 | 0.09 | 0.10 |
| 2019/20 | 0.04 | 0.06 |
| 2020/21 | 0.03 | 0.05 |
| 2021/22 | 0.06 | 0.08 |
| 2022/23 | 0.06 | 0.11 |
| 2023/24 | 0.05 | 0.13 |
| 2024/25 | 0.04 | 0.12 |
Permanent exclusions in the school year for every 100 pupils on roll. Source: Department for Education, Explore Education Statistics, Suspensions and permanent exclusions in England, 2024/25.
Eligible for free school meals
2024/2520.1%
- England
- 25.7%
5.6 percentage points lower than England.
Show the figures as a table
| Year | Redbridge | England |
|---|---|---|
| 2021/22 | 16.0% | 22.5% |
| 2022/23 | 16.8% | 23.8% |
| 2023/24 | 17.4% | 24.6% |
| 2024/25 | 20.1% | 25.7% |
Pupils known to be eligible for free school meals on census day in January. Source: Department for Education, Explore Education Statistics, Schools, pupils and their characteristics, 2024/25.
SEN support
2024/2511.1%
- England
- 14.0%
2.9 percentage points lower than England.
Show the figures as a table
| Year | Redbridge | England |
|---|---|---|
| 2021/22 | 8.8% | 12.4% |
| 2022/23 | 9.7% | 12.9% |
| 2023/24 | 10.2% | 13.4% |
| 2024/25 | 11.1% | 14.0% |
Pupils receiving special educational needs support without an education, health and care plan. Source: Department for Education, Explore Education Statistics, Schools, pupils and their characteristics, 2024/25.
Education, health and care plan
2024/254.5%
- England
- 5.2%
0.7 percentage points lower than England.
Show the figures as a table
| Year | Redbridge | England |
|---|---|---|
| 2021/22 | 3.5% | 3.8% |
| 2022/23 | 3.8% | 4.2% |
| 2023/24 | 4.2% | 4.7% |
| 2024/25 | 4.5% | 5.2% |
Pupils with an education, health and care plan. Source: Department for Education, Explore Education Statistics, Schools, pupils and their characteristics, 2024/25.
First language other than English
2024/2556.7%
- England
- 21.4%
35.3 percentage points higher than England.
Show the figures as a table
| Year | Redbridge | England |
|---|---|---|
| 2021/22 | 57.4% | 19.6% |
| 2022/23 | 56.8% | 20.2% |
| 2023/24 | 56.1% | 20.8% |
| 2024/25 | 56.7% | 21.4% |
Pupils whose first language is known or believed to be other than English. Source: Department for Education, Explore Education Statistics, Schools, pupils and their characteristics, 2024/25.
Pupils per qualified teacher
2025/2619.4
- England
- 18.5
0.9 higher than England.
Show the figures as a table
| Year | Redbridge | England |
|---|---|---|
| 2017/18 | 18.5 | 18.4 |
| 2018/19 | 19.0 | 18.6 |
| 2019/20 | 19.7 | 18.8 |
| 2020/21 | 19.5 | 18.5 |
| 2021/22 | 19.7 | 18.5 |
| 2022/23 | 19.3 | 18.5 |
| 2023/24 | 19.6 | 18.6 |
| 2024/25 | 19.9 | 18.6 |
| 2025/26 | 19.4 | 18.5 |
Full-time equivalent pupils for each full-time equivalent qualified teacher. Source: Department for Education, Explore Education Statistics, School workforce in England, 2025/26.
Teacher sickness absence
2024/254.9 days
- England
- 5.0 days
0.1 days lower than England.
Show the figures as a table
| Year | Redbridge | England |
|---|---|---|
| 2017/18 | 3.7 days | 4.0 days |
| 2018/19 | 3.5 days | 4.0 days |
| 2019/20 | Not published | Not published |
| 2020/21 | 3.7 days | 3.9 days |
| 2021/22 | 5.6 days | 6.3 days |
| 2022/23 | 5.1 days | 5.2 days |
| 2023/24 | 5.7 days | 5.3 days |
| 2024/25 | 4.9 days | 5.0 days |
Days lost to sickness absence in the school year, averaged across all teachers. Source: Department for Education, Explore Education Statistics, School workforce in England, 2024/25.
Primary schools
Overall absence
2024/255.7%
- England
- 5.2%
0.5 percentage points higher than England.
Show the figures as a table
| Year | Redbridge | England |
|---|---|---|
| 2017/18 | 4.2% | 4.2% |
| 2018/19 | 4.1% | 4.0% |
| 2020/21 | 4.0% | 3.6% |
| 2021/22 | 6.0% | 6.3% |
| 2022/23 | 6.7% | 5.9% |
| 2023/24 | 5.5% | 5.5% |
| 2024/25 | 5.7% | 5.2% |
Sessions missed for any reason, as a share of all possible sessions in the school year. Source: Department for Education, Explore Education Statistics, Pupil absence in schools in England, 2024/25.
Persistent absence
2024/2515.6%
- England
- 13.0%
2.6 percentage points higher than England.
Show the figures as a table
| Year | Redbridge | England |
|---|---|---|
| 2017/18 | 8.9% | 8.7% |
| 2018/19 | 8.5% | 8.2% |
| 2020/21 | 9.9% | 8.8% |
| 2021/22 | 17.8% | 17.7% |
| 2022/23 | 21.3% | 16.2% |
| 2023/24 | 14.9% | 14.6% |
| 2024/25 | 15.6% | 13.0% |
Pupils who missed 10% or more of their possible sessions, as a share of pupils. Source: Department for Education, Explore Education Statistics, Pupil absence in schools in England, 2024/25.
Severe absence
2024/250.8%
- England
- 0.9%
0.1 percentage points lower than England.
Show the figures as a table
| Year | Redbridge | England |
|---|---|---|
| 2017/18 | 0.5% | 0.4% |
| 2018/19 | 0.4% | 0.4% |
| 2020/21 | 1.1% | 0.7% |
| 2021/22 | 0.8% | 0.6% |
| 2022/23 | 0.8% | 0.7% |
| 2023/24 | 0.9% | 0.9% |
| 2024/25 | 0.8% | 0.9% |
Pupils who missed 50% or more of their possible sessions, as a share of pupils. Source: Department for Education, Explore Education Statistics, Pupil absence in schools in England, 2024/25.
Suspensions per 100 pupils
2024/250.89
- England
- 2.47
1.58 lower than England.
Show the figures as a table
| Year | Redbridge | England |
|---|---|---|
| 2017/18 | 0.48 | 1.40 |
| 2018/19 | 0.48 | 1.41 |
| 2019/20 | 0.34 | 1.00 |
| 2020/21 | 0.34 | 0.99 |
| 2021/22 | 0.47 | 1.42 |
| 2022/23 | 0.47 | 1.81 |
| 2023/24 | 0.83 | 2.27 |
| 2024/25 | 0.89 | 2.47 |
Suspensions in the school year for every 100 pupils on roll. One pupil can be suspended more than once. Source: Department for Education, Explore Education Statistics, Suspensions and permanent exclusions in England, 2024/25.
Permanent exclusions per 100 pupils
2024/250.00
- England
- 0.03
0.03 lower than England.
Show the figures as a table
| Year | Redbridge | England |
|---|---|---|
| 2017/18 | 0.00 | 0.03 |
| 2018/19 | 0.00 | 0.02 |
| 2019/20 | 0.00 | 0.02 |
| 2020/21 | 0.00 | 0.01 |
| 2021/22 | 0.00 | 0.02 |
| 2022/23 | 0.00 | 0.03 |
| 2023/24 | 0.00 | 0.03 |
| 2024/25 | 0.00 | 0.03 |
Permanent exclusions in the school year for every 100 pupils on roll. Source: Department for Education, Explore Education Statistics, Suspensions and permanent exclusions in England, 2024/25.
Reading, writing and maths: expected standard
2025/26 (provisional)73%
- England
- 63%
10 percentage points higher than England.
Show the figures as a table
| Year | Redbridge | England |
|---|---|---|
| 2021/22 | 71% | 59% |
| 2022/23 | 70% | 60% |
| 2023/24 | 74% | 61% |
| 2024/25 | 75% | 63% |
| 2025/26 (provisional) | 73% | 63% |
Pupils at the end of key stage 2 who met the expected standard in reading, writing and maths combined. Source: Department for Education, Explore Education Statistics, Key stage 2 attainment, 2025/26.
Reading, writing and maths: higher standard
2025/26 (provisional)14%
- England
- 9%
5 percentage points higher than England.
Show the figures as a table
| Year | Redbridge | England |
|---|---|---|
| 2021/22 | 10% | 7% |
| 2022/23 | 12% | 8% |
| 2023/24 | 12% | 8% |
| 2024/25 | 16% | 8% |
| 2025/26 (provisional) | 14% | 9% |
Pupils at the end of key stage 2 who met the higher standard in reading, writing and maths combined. Source: Department for Education, Explore Education Statistics, Key stage 2 attainment, 2025/26.
Eligible for free school meals
2024/2517.4%
- England
- 24.7%
7.3 percentage points lower than England.
Show the figures as a table
| Year | Redbridge | England |
|---|---|---|
| 2021/22 | 13.8% | 23.1% |
| 2022/23 | 14.3% | 24.0% |
| 2023/24 | 14.8% | 24.3% |
| 2024/25 | 17.4% | 24.7% |
Pupils known to be eligible for free school meals on census day in January. Source: Department for Education, Explore Education Statistics, Schools, pupils and their characteristics, 2024/25.
SEN support
2024/2511.7%
- England
- 15.0%
3.3 percentage points lower than England.
Show the figures as a table
| Year | Redbridge | England |
|---|---|---|
| 2021/22 | 9.3% | 13.0% |
| 2022/23 | 10.1% | 13.5% |
| 2023/24 | 10.4% | 14.1% |
| 2024/25 | 11.7% | 15.0% |
Pupils receiving special educational needs support without an education, health and care plan. Source: Department for Education, Explore Education Statistics, Schools, pupils and their characteristics, 2024/25.
Education, health and care plan
2024/253.8%
- England
- 3.5%
0.3 percentage points higher than England.
Show the figures as a table
| Year | Redbridge | England |
|---|---|---|
| 2021/22 | 2.7% | 2.3% |
| 2022/23 | 3.1% | 2.5% |
| 2023/24 | 3.5% | 3.0% |
| 2024/25 | 3.8% | 3.5% |
Pupils with an education, health and care plan. Source: Department for Education, Explore Education Statistics, Schools, pupils and their characteristics, 2024/25.
First language other than English
2024/2561.7%
- England
- 23.4%
38.3 percentage points higher than England.
Show the figures as a table
| Year | Redbridge | England |
|---|---|---|
| 2021/22 | 63.4% | 21.2% |
| 2022/23 | 62.9% | 22.0% |
| 2023/24 | 63.2% | 22.8% |
| 2024/25 | 61.7% | 23.4% |
Pupils whose first language is known or believed to be other than English. Source: Department for Education, Explore Education Statistics, Schools, pupils and their characteristics, 2024/25.
Pupils per qualified teacher
2025/2622.5
- England
- 21.2
1.3 higher than England.
Show the figures as a table
| Year | Redbridge | England |
|---|---|---|
| 2017/18 | 22.2 | 21.3 |
| 2018/19 | 22.2 | 21.4 |
| 2019/20 | 22.3 | 21.4 |
| 2020/21 | 21.7 | 21.1 |
| 2021/22 | 21.6 | 21.0 |
| 2022/23 | 22.0 | 21.1 |
| 2023/24 | 22.5 | 21.2 |
| 2024/25 | 23.0 | 21.3 |
| 2025/26 | 22.5 | 21.2 |
Full-time equivalent pupils for each full-time equivalent qualified teacher. Source: Department for Education, Explore Education Statistics, School workforce in England, 2025/26.
Secondary schools
Overall absence
2024/256.7%
- England
- 8.4%
1.7 percentage points lower than England.
Show the figures as a table
| Year | Redbridge | England |
|---|---|---|
| 2017/18 | 4.9% | 5.5% |
| 2018/19 | 4.9% | 5.5% |
| 2020/21 | 4.5% | 5.5% |
| 2021/22 | 6.8% | 9.0% |
| 2022/23 | 7.2% | 9.0% |
| 2023/24 | 6.6% | 8.9% |
| 2024/25 | 6.7% | 8.4% |
Sessions missed for any reason, as a share of all possible sessions in the school year. Source: Department for Education, Explore Education Statistics, Pupil absence in schools in England, 2024/25.
Persistent absence
2024/2519.2%
- England
- 23.4%
4.2 percentage points lower than England.
Show the figures as a table
| Year | Redbridge | England |
|---|---|---|
| 2017/18 | 10.6% | 13.9% |
| 2018/19 | 10.9% | 13.7% |
| 2020/21 | 10.5% | 14.8% |
| 2021/22 | 20.6% | 27.7% |
| 2022/23 | 22.1% | 26.5% |
| 2023/24 | 18.7% | 25.6% |
| 2024/25 | 19.2% | 23.4% |
Pupils who missed 10% or more of their possible sessions, as a share of pupils. Source: Department for Education, Explore Education Statistics, Pupil absence in schools in England, 2024/25.
Severe absence
2024/251.5%
- England
- 3.9%
2.4 percentage points lower than England.
Show the figures as a table
| Year | Redbridge | England |
|---|---|---|
| 2017/18 | 0.8% | 1.2% |
| 2018/19 | 0.8% | 1.3% |
| 2020/21 | 0.8% | 1.5% |
| 2021/22 | 1.1% | 2.7% |
| 2022/23 | 1.2% | 3.4% |
| 2023/24 | 1.4% | 3.8% |
| 2024/25 | 1.5% | 3.9% |
Pupils who missed 50% or more of their possible sessions, as a share of pupils. Source: Department for Education, Explore Education Statistics, Pupil absence in schools in England, 2024/25.
Suspensions per 100 pupils
2024/256.39
- England
- 21.24
14.85 lower than England.
Show the figures as a table
| Year | Redbridge | England |
|---|---|---|
| 2017/18 | 4.65 | 10.13 |
| 2018/19 | 6.67 | 10.75 |
| 2019/20 | 3.62 | 7.43 |
| 2020/21 | 4.42 | 8.48 |
| 2021/22 | 7.30 | 13.96 |
| 2022/23 | 7.51 | 18.90 |
| 2023/24 | 7.44 | 22.61 |
| 2024/25 | 6.39 | 21.24 |
Suspensions in the school year for every 100 pupils on roll. One pupil can be suspended more than once. Source: Department for Education, Explore Education Statistics, Suspensions and permanent exclusions in England, 2024/25.
Permanent exclusions per 100 pupils
2024/250.08
- England
- 0.23
0.15 lower than England.
Show the figures as a table
| Year | Redbridge | England |
|---|---|---|
| 2017/18 | 0.16 | 0.20 |
| 2018/19 | 0.19 | 0.20 |
| 2019/20 | 0.09 | 0.13 |
| 2020/21 | 0.07 | 0.10 |
| 2021/22 | 0.12 | 0.16 |
| 2022/23 | 0.11 | 0.22 |
| 2023/24 | 0.10 | 0.25 |
| 2024/25 | 0.08 | 0.23 |
Permanent exclusions in the school year for every 100 pupils on roll. Source: Department for Education, Explore Education Statistics, Suspensions and permanent exclusions in England, 2024/25.
Attainment 8
2025/26 (provisional)55.6
- England
- 47.4
8.2 higher than England.
Show the figures as a table
| Year | Redbridge | England |
|---|---|---|
| 2021/22 | 57.0 | 49.8 |
| 2022/23 | 55.2 | 47.2 |
| 2023/24 | 55.9 | 46.9 |
| 2024/25 | 54.6 | 47.1 |
| 2025/26 (provisional) | 55.6 | 47.4 |
The average of pupils' points across eight GCSE-level qualifications, with English and maths counted twice. Source: Department for Education, Explore Education Statistics, Key stage 4 performance, 2025/26.
English and maths: grade 4 or above
2025/26 (provisional)79%
- England
- 66%
13 percentage points higher than England.
Show the figures as a table
| Year | Redbridge | England |
|---|---|---|
| 2021/22 | 80% | 70% |
| 2022/23 | 79% | 67% |
| 2023/24 | 80% | 67% |
| 2024/25 | 78% | 66% |
| 2025/26 (provisional) | 79% | 66% |
Pupils at the end of key stage 4 with grade 4 or above in both English and maths. Source: Department for Education, Explore Education Statistics, Key stage 4 performance, 2025/26.
English and maths: grade 5 or above
2025/26 (provisional)63%
- England
- 48%
15 percentage points higher than England.
Show the figures as a table
| Year | Redbridge | England |
|---|---|---|
| 2021/22 | 66% | 51% |
| 2022/23 | 64% | 46% |
| 2023/24 | 65% | 47% |
| 2024/25 | 60% | 47% |
| 2025/26 (provisional) | 63% | 48% |
Pupils at the end of key stage 4 with grade 5 or above in both English and maths. Source: Department for Education, Explore Education Statistics, Key stage 4 performance, 2025/26.
Eligible for free school meals
2024/2522.0%
- England
- 25.8%
3.8 percentage points lower than England.
Show the figures as a table
| Year | Redbridge | England |
|---|---|---|
| 2021/22 | 17.7% | 20.9% |
| 2022/23 | 18.6% | 22.7% |
| 2023/24 | 19.3% | 24.1% |
| 2024/25 | 22.0% | 25.8% |
Pupils known to be eligible for free school meals on census day in January. Source: Department for Education, Explore Education Statistics, Schools, pupils and their characteristics, 2024/25.
SEN support
2024/2510.7%
- England
- 13.4%
2.7 percentage points lower than England.
Show the figures as a table
| Year | Redbridge | England |
|---|---|---|
| 2021/22 | 8.5% | 11.9% |
| 2022/23 | 9.4% | 12.4% |
| 2023/24 | 10.0% | 12.9% |
| 2024/25 | 10.7% | 13.4% |
Pupils receiving special educational needs support without an education, health and care plan. Source: Department for Education, Explore Education Statistics, Schools, pupils and their characteristics, 2024/25.
Education, health and care plan
2024/252.7%
- England
- 3.1%
0.4 percentage points lower than England.
Show the figures as a table
| Year | Redbridge | England |
|---|---|---|
| 2021/22 | 2.2% | 2.2% |
| 2022/23 | 2.3% | 2.4% |
| 2023/24 | 2.5% | 2.7% |
| 2024/25 | 2.7% | 3.1% |
Pupils with an education, health and care plan. Source: Department for Education, Explore Education Statistics, Schools, pupils and their characteristics, 2024/25.
First language other than English
2024/2552.4%
- England
- 19.2%
33.2 percentage points higher than England.
Show the figures as a table
| Year | Redbridge | England |
|---|---|---|
| 2021/22 | 51.4% | 17.5% |
| 2022/23 | 51.0% | 18.1% |
| 2023/24 | 49.5% | 18.6% |
| 2024/25 | 52.4% | 19.2% |
Pupils whose first language is known or believed to be other than English. Source: Department for Education, Explore Education Statistics, Schools, pupils and their characteristics, 2024/25.
Pupils per qualified teacher
2025/2618.1
- England
- 17.3
0.8 higher than England.
Show the figures as a table
| Year | Redbridge | England |
|---|---|---|
| 2017/18 | 16.7 | 16.5 |
| 2018/19 | 17.5 | 16.8 |
| 2019/20 | 18.4 | 17.2 |
| 2020/21 | 18.6 | 17.1 |
| 2021/22 | 19.1 | 17.1 |
| 2022/23 | 18.2 | 17.2 |
| 2023/24 | 18.3 | 17.4 |
| 2024/25 | 18.5 | 17.3 |
| 2025/26 | 18.1 | 17.3 |
Full-time equivalent pupils for each full-time equivalent qualified teacher. Source: Department for Education, Explore Education Statistics, School workforce in England, 2025/26.
Special schools
Overall absence
2024/2513.5%
- England
- 12.8%
0.7 percentage points higher than England.
Show the figures as a table
| Year | Redbridge | England |
|---|---|---|
| 2017/18 | 12.0% | 10.2% |
| 2018/19 | 12.2% | 10.1% |
| 2020/21 | 16.7% | 15.2% |
| 2021/22 | 13.7% | 13.2% |
| 2022/23 | 15.5% | 13.0% |
| 2023/24 | 14.1% | 13.0% |
| 2024/25 | 13.5% | 12.8% |
Sessions missed for any reason, as a share of all possible sessions in the school year. Source: Department for Education, Explore Education Statistics, Pupil absence in schools in England, 2024/25.
Persistent absence
2024/2542.4%
- England
- 35.3%
7.1 percentage points higher than England.
Show the figures as a table
| Year | Redbridge | England |
|---|---|---|
| 2017/18 | 36.1% | 29.6% |
| 2018/19 | 37.5% | 28.8% |
| 2020/21 | 55.1% | 48.9% |
| 2021/22 | 43.0% | 40.4% |
| 2022/23 | 50.6% | 38.3% |
| 2023/24 | 40.8% | 37.2% |
| 2024/25 | 42.4% | 35.3% |
Pupils who missed 10% or more of their possible sessions, as a share of pupils. Source: Department for Education, Explore Education Statistics, Pupil absence in schools in England, 2024/25.
Severe absence
2024/256.1%
- England
- 6.9%
0.8 percentage points lower than England.
Show the figures as a table
| Year | Redbridge | England |
|---|---|---|
| 2017/18 | 5.4% | 4.4% |
| 2018/19 | 5.2% | 4.6% |
| 2020/21 | 4.9% | 5.6% |
| 2021/22 | 6.6% | 5.8% |
| 2022/23 | 6.8% | 6.2% |
| 2023/24 | 5.4% | 6.7% |
| 2024/25 | 6.1% | 6.9% |
Pupils who missed 50% or more of their possible sessions, as a share of pupils. Source: Department for Education, Explore Education Statistics, Pupil absence in schools in England, 2024/25.
Suspensions per 100 pupils
2024/252.45
- England
- 12.32
9.87 lower than England.
Show the figures as a table
| Year | Redbridge | England |
|---|---|---|
| 2017/18 | 19.85 | 12.34 |
| 2018/19 | 16.12 | 11.32 |
| 2019/20 | 9.51 | 7.76 |
| 2020/21 | 1.16 | 7.29 |
| 2021/22 | 1.25 | 9.60 |
| 2022/23 | 1.53 | 10.99 |
| 2023/24 | 2.09 | 12.62 |
| 2024/25 | 2.45 | 12.32 |
Suspensions in the school year for every 100 pupils on roll. One pupil can be suspended more than once. Source: Department for Education, Explore Education Statistics, Suspensions and permanent exclusions in England, 2024/25.
Permanent exclusions per 100 pupils
2024/250.00
- England
- 0.08
0.08 lower than England.
Show the figures as a table
| Year | Redbridge | England |
|---|---|---|
| 2017/18 | 0.00 | 0.07 |
| 2018/19 | 0.00 | 0.06 |
| 2019/20 | 0.00 | 0.04 |
| 2020/21 | 0.00 | 0.03 |
| 2021/22 | 0.16 | 0.05 |
| 2022/23 | 0.00 | 0.08 |
| 2023/24 | 0.00 | 0.08 |
| 2024/25 | 0.00 | 0.08 |
Permanent exclusions in the school year for every 100 pupils on roll. Source: Department for Education, Explore Education Statistics, Suspensions and permanent exclusions in England, 2024/25.
Eligible for free school meals
2024/2544.7%
- England
- 48.8%
4.1 percentage points lower than England.
Show the figures as a table
| Year | Redbridge | England |
|---|---|---|
| 2021/22 | 39.1% | 44.4% |
| 2022/23 | 42.0% | 45.6% |
| 2023/24 | 41.3% | 47.1% |
| 2024/25 | 44.7% | 48.8% |
Pupils known to be eligible for free school meals on census day in January. Source: Department for Education, Explore Education Statistics, Schools, pupils and their characteristics, 2024/25.
SEN support
2024/251.4%
- England
- 0.5%
0.9 percentage points higher than England.
Show the figures as a table
| Year | Redbridge | England |
|---|---|---|
| 2021/22 | 2.2% | 0.9% |
| 2022/23 | 1.8% | 0.8% |
| 2023/24 | 2.0% | 0.7% |
| 2024/25 | 1.4% | 0.5% |
Pupils receiving special educational needs support without an education, health and care plan. Source: Department for Education, Explore Education Statistics, Schools, pupils and their characteristics, 2024/25.
Education, health and care plan
2024/2598.2%
- England
- 99.5%
1.3 percentage points lower than England.
Show the figures as a table
| Year | Redbridge | England |
|---|---|---|
| 2021/22 | 97.8% | 99.1% |
| 2022/23 | 98.2% | 99.2% |
| 2023/24 | 98.0% | 99.3% |
| 2024/25 | 98.2% | 99.5% |
Pupils with an education, health and care plan. Source: Department for Education, Explore Education Statistics, Schools, pupils and their characteristics, 2024/25.
First language other than English
2024/2538.9%
- England
- 14.4%
24.5 percentage points higher than England.
Show the figures as a table
| Year | Redbridge | England |
|---|---|---|
| 2021/22 | 46.8% | 14.5% |
| 2022/23 | 45.2% | 14.4% |
| 2023/24 | 42.0% | 14.4% |
| 2024/25 | 38.9% | 14.4% |
Pupils whose first language is known or believed to be other than English. Source: Department for Education, Explore Education Statistics, Schools, pupils and their characteristics, 2024/25.
Pupils per qualified teacher
2025/267.2
- England
- 7.3
0.1 lower than England.
Show the figures as a table
| Year | Redbridge | England |
|---|---|---|
| 2017/18 | 4.8 | 6.7 |
| 2018/19 | 5.0 | 6.8 |
| 2019/20 | 5.9 | 7.0 |
| 2020/21 | 6.3 | 6.8 |
| 2021/22 | 6.5 | 6.9 |
| 2022/23 | 6.3 | 7.0 |
| 2023/24 | 7.0 | 7.1 |
| 2024/25 | 7.3 | 7.3 |
| 2025/26 | 7.2 | 7.3 |
Full-time equivalent pupils for each full-time equivalent qualified teacher. Source: Department for Education, Explore Education Statistics, School workforce in England, 2025/26.
Schools in Redbridge
Listed by name. Filter by phase or type; sort by name or size. Nothing here is sorted by results.
Showing 79 of 79 schools in Redbridge.
| School | Phase | Type | Town | Pupils |
|---|---|---|---|---|
| Al-Noor Voluntary Aided Muslim Primary School | Primary | Maintained | Ilford | 420 |
| Aldborough Primary School | Primary | Free school | Ilford | 347 |
| Aldersbrook Primary School | Primary | Maintained | London | 667 |
| Ark Isaac Newton Academy | All-through | Academy | Ilford | 1,777 |
| Atam Academy | All-through | Free school | Romford | 1,083 |
| Avanti Court Primary School | Primary | Academy | Barkingside | 598 |
| Barley Lane Primary School | Primary | Maintained | Romford | 840 |
| Beacon Business Innovation Hub | Alternative provision | Free school | Ilford | 35 |
| Beal High School | Secondary | Academy | Ilford | 2,615 |
| Caterham High School | Secondary | Maintained | Ilford | 953 |
| Chadwell Heath Academy | Secondary | Academy | Romford | 1,229 |
| Chadwell Primary School | Primary | Maintained | Romford | 675 |
| Christchurch Primary School | Primary | Maintained | Ilford | 1,084 |
| Churchfields Infants' School | Primary | Maintained | London | 429 |
| Churchfields Junior School | Primary | Maintained | London | 477 |
| Cleveland Road Primary School | Primary | Maintained | Ilford | 899 |
| Clore Tikva School | Primary | Maintained | Ilford | 294 |
| Coppice Primary School | Primary | Maintained | Chigwell | 432 |
| Cranbrook Primary School | Primary | Maintained | Ilford | 786 |
| Downshall Primary School | Primary | Academy | Ilford | 501 |
| Fairlop Primary School | Primary | Maintained | Ilford | 681 |
| Farnham Green Primary School | Primary | Academy | Ilford | 350 |
| Forest Academy | Secondary | Academy | Ilford | 749 |
| Fullwood Primary School | Primary | Maintained | Ilford | 458 |
| Gearies Primary School | Primary | Maintained | Ilford | 884 |
| Gilbert Colvin Primary School | Primary | Maintained | Ilford | 344 |
| Glade Primary School | Primary | Maintained | Ilford | 428 |
| Goodmayes Primary School | Primary | Maintained | Ilford | 643 |
| Gordon Primary School | Primary | Maintained | Ilford | 398 |
| Grove Primary School | Primary | Maintained | Romford | 666 |
| Hatchside School | Special | Free school | Ilford | 102 |
| Hatton Special School | Special | Maintained special | Woodford Green | 197 |
| Highlands Primary School | Primary | Maintained | Ilford | 676 |
| Ilford County High School | Secondary | Maintained | Ilford | 1,115 |
| John Bramston Primary School | Primary | Maintained | Hainault | 438 |
| King Solomon High School | Secondary | Maintained | Ilford | 636 |
| Little Heath School | Special | Maintained special | Romford | 264 |
| Loxford School | All-through | Academy | Ilford | 2,799 |
| Manford Primary School | Primary | Maintained | Chigwell | 460 |
| Mayespark Primary School | Primary | Maintained | Ilford | 555 |
| Mayfield School | Secondary | Maintained | Dagenham | 1,790 |
| Mossford Green Primary School | Primary | Maintained | Ilford | 451 |
| New Rush Hall School | Special | Maintained special | Ilford | 94 |
| Newbridge School | Special | Academy | Romford | 198 |
| Newbury Park Primary School | Primary | Maintained | Ilford | 752 |
| Nightingale Primary School | Primary | Maintained | London | 685 |
| Oakdale Infants' School | Primary | Maintained | London | 299 |
| Oakdale Junior School | Primary | Maintained | London | 357 |
| Oaks Park High School | Secondary | Maintained | Ilford | 1,783 |
| Our Lady of Lourdes RC Primary School | Primary | Academy | London | 450 |
| Parkhill Infants' School | Primary | Maintained | Ilford | 381 |
| Parkhill Junior School | Primary | Maintained | Ilford | 442 |
| Ray Lodge Primary School | Primary | Academy | Woodford Green | 674 |
| Redbridge Alternative Provision | Alternative provision | Maintained | Ilford | 15 |
| Redbridge Primary School | Primary | Maintained | Ilford | 808 |
| Roding Primary School | Primary | Maintained | Woodford Green | 438 |
| Seven Kings School | All-through | Maintained | Ilford | 2,189 |
| Snaresbrook Primary School | Primary | Maintained | London | 461 |
| South Park Primary School | Primary | Maintained | Ilford | 592 |
| SS Peter and Paul's Catholic Primary School | Primary | Academy | Ilford | 338 |
| St Aidan's Catholic Primary Academy | Primary | Academy | Ilford | 213 |
| St Antony's Catholic Primary School | Primary | Maintained | Woodford Green | 438 |
| St Augustine's Catholic Primary School | Primary | Maintained | Ilford | 406 |
| St Bede's Catholic Primary School | Primary | Maintained | Romford | 426 |
| The Constance Bridgeman Centre | Alternative provision | Maintained | Ilford | 21 |
| The Palmer Catholic Academy | Secondary | Academy | Ilford | 1,132 |
| The Ursuline Academy Ilford | Secondary | Academy | Ilford | 743 |
| Trinity Catholic High School | Secondary | Maintained | Woodford Green | 1,603 |
| Uphall Primary School | Primary | Maintained | Ilford | 865 |
| Valentines High School | Secondary | Maintained | Ilford | 1,357 |
| Wanstead Church School | Primary | Maintained | London | 197 |
| Wanstead High School | Secondary | Maintained | London | 1,434 |
| Wells Primary School | Primary | Maintained | Woodford Green | 341 |
| William Torbitt Primary School | Primary | Maintained | Ilford | 491 |
| Winston Way Academy | Primary | Academy | Ilford | 616 |
| Wohl Ilford Jewish Primary School | Primary | Maintained | Ilford | 245 |
| Woodbridge High School | Secondary | Maintained | Woodford Green | 1,980 |
| Woodford County High School | Secondary | Maintained | Woodford Green | 1,237 |
| Woodlands Primary School | Primary | Maintained | Ilford | 558 |