Peterborough
83 state-funded schools with 40,338 pupils on roll, in the East of England region. Every school’s page has its published figures against Peterborough and England.
- Primary
- 61
- Secondary
- 12
- All-through
- 3
- Special
- 5
- Alternative provision
- 1
- Nursery
- 1
- Academies
- 52
- Maintained
- 21
- Free schools
- 8
- Maintained special
- 2
Map
Zoom in to see each school. Open the full map
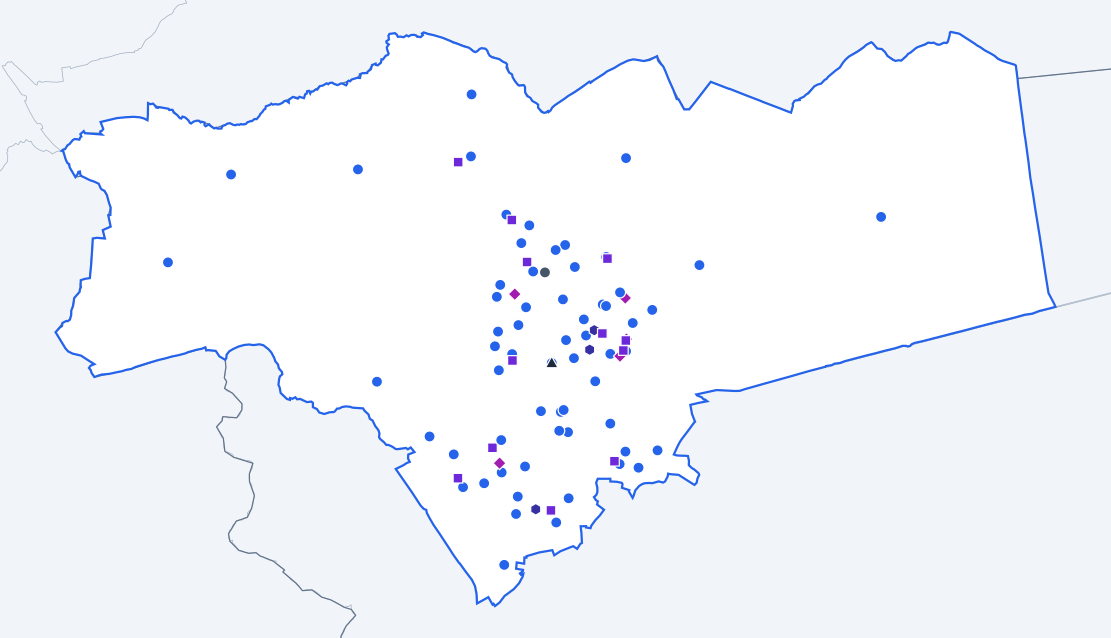
ONS, OS © Crown copyright 2025 · GIAS · © OpenStreetMap
Peterborough against England
Published figures for the authority’s schools, set against the same kind of school across England.
All state-funded schools
Overall absence
2024/256.7%
- England
- 6.8%
0.1 percentage points lower than England.
Show the figures as a table
| Year | Peterborough | England |
|---|---|---|
| 2017/18 | 4.8% | 4.8% |
| 2018/19 | 4.8% | 4.7% |
| 2020/21 | 4.7% | 4.6% |
| 2021/22 | 7.9% | 7.6% |
| 2022/23 | 7.5% | 7.4% |
| 2023/24 | 7.0% | 7.1% |
| 2024/25 | 6.7% | 6.8% |
Sessions missed for any reason, as a share of all possible sessions in the school year. Source: Department for Education, Explore Education Statistics, Pupil absence in schools in England, 2024/25.
Persistent absence
2024/2518.9%
- England
- 18.1%
0.8 percentage points higher than England.
Show the figures as a table
| Year | Peterborough | England |
|---|---|---|
| 2017/18 | 11.6% | 11.2% |
| 2018/19 | 11.4% | 10.9% |
| 2020/21 | 12.5% | 12.1% |
| 2021/22 | 24.8% | 22.5% |
| 2022/23 | 22.7% | 21.2% |
| 2023/24 | 19.9% | 20.0% |
| 2024/25 | 18.9% | 18.1% |
Pupils who missed 10% or more of their possible sessions, as a share of pupils. Source: Department for Education, Explore Education Statistics, Pupil absence in schools in England, 2024/25.
Severe absence
2024/252.1%
- England
- 2.4%
0.3 percentage points lower than England.
Show the figures as a table
| Year | Peterborough | England |
|---|---|---|
| 2017/18 | 0.7% | 0.8% |
| 2018/19 | 0.8% | 0.8% |
| 2020/21 | 1.1% | 1.1% |
| 2021/22 | 1.6% | 1.7% |
| 2022/23 | 1.8% | 2.0% |
| 2023/24 | 1.9% | 2.3% |
| 2024/25 | 2.1% | 2.4% |
Pupils who missed 50% or more of their possible sessions, as a share of pupils. Source: Department for Education, Explore Education Statistics, Pupil absence in schools in England, 2024/25.
Suspensions per 100 pupils
2024/2516.83
- England
- 10.88
5.95 higher than England.
Show the figures as a table
| Year | Peterborough | England |
|---|---|---|
| 2017/18 | 5.64 | 5.08 |
| 2018/19 | 6.01 | 5.36 |
| 2019/20 | 4.27 | 3.76 |
| 2020/21 | 5.19 | 4.25 |
| 2021/22 | 9.21 | 6.91 |
| 2022/23 | 12.08 | 9.33 |
| 2023/24 | 17.55 | 11.31 |
| 2024/25 | 16.83 | 10.88 |
Suspensions in the school year for every 100 pupils on roll. One pupil can be suspended more than once. Source: Department for Education, Explore Education Statistics, Suspensions and permanent exclusions in England, 2024/25.
Permanent exclusions per 100 pupils
2024/250.15
- England
- 0.12
0.03 higher than England.
Show the figures as a table
| Year | Peterborough | England |
|---|---|---|
| 2017/18 | 0.10 | 0.10 |
| 2018/19 | 0.19 | 0.10 |
| 2019/20 | 0.10 | 0.06 |
| 2020/21 | 0.05 | 0.05 |
| 2021/22 | 0.12 | 0.08 |
| 2022/23 | 0.14 | 0.11 |
| 2023/24 | 0.12 | 0.13 |
| 2024/25 | 0.15 | 0.12 |
Permanent exclusions in the school year for every 100 pupils on roll. Source: Department for Education, Explore Education Statistics, Suspensions and permanent exclusions in England, 2024/25.
Eligible for free school meals
2024/2530.5%
- England
- 25.7%
4.8 percentage points higher than England.
Show the figures as a table
| Year | Peterborough | England |
|---|---|---|
| 2021/22 | 25.8% | 22.5% |
| 2022/23 | 27.6% | 23.8% |
| 2023/24 | 29.0% | 24.6% |
| 2024/25 | 30.5% | 25.7% |
Pupils known to be eligible for free school meals on census day in January. Source: Department for Education, Explore Education Statistics, Schools, pupils and their characteristics, 2024/25.
SEN support
2024/2512.2%
- England
- 14.0%
1.8 percentage points lower than England.
Show the figures as a table
| Year | Peterborough | England |
|---|---|---|
| 2021/22 | 10.2% | 12.4% |
| 2022/23 | 10.7% | 12.9% |
| 2023/24 | 11.3% | 13.4% |
| 2024/25 | 12.2% | 14.0% |
Pupils receiving special educational needs support without an education, health and care plan. Source: Department for Education, Explore Education Statistics, Schools, pupils and their characteristics, 2024/25.
Education, health and care plan
2024/254.9%
- England
- 5.2%
0.3 percentage points lower than England.
Show the figures as a table
| Year | Peterborough | England |
|---|---|---|
| 2021/22 | 3.6% | 3.8% |
| 2022/23 | 3.8% | 4.2% |
| 2023/24 | 4.3% | 4.7% |
| 2024/25 | 4.9% | 5.2% |
Pupils with an education, health and care plan. Source: Department for Education, Explore Education Statistics, Schools, pupils and their characteristics, 2024/25.
First language other than English
2024/2535.1%
- England
- 21.4%
13.7 percentage points higher than England.
Show the figures as a table
| Year | Peterborough | England |
|---|---|---|
| 2021/22 | 34.0% | 19.6% |
| 2022/23 | 34.3% | 20.2% |
| 2023/24 | 34.6% | 20.8% |
| 2024/25 | 35.1% | 21.4% |
Pupils whose first language is known or believed to be other than English. Source: Department for Education, Explore Education Statistics, Schools, pupils and their characteristics, 2024/25.
Pupils per qualified teacher
2025/2618.7
- England
- 18.5
0.2 higher than England.
Show the figures as a table
| Year | Peterborough | England |
|---|---|---|
| 2017/18 | 19.2 | 18.4 |
| 2018/19 | 18.5 | 18.6 |
| 2019/20 | 19.1 | 18.8 |
| 2020/21 | 19.2 | 18.5 |
| 2021/22 | 19.1 | 18.5 |
| 2022/23 | 19.3 | 18.5 |
| 2023/24 | 19.6 | 18.6 |
| 2024/25 | 19.4 | 18.6 |
| 2025/26 | 18.7 | 18.5 |
Full-time equivalent pupils for each full-time equivalent qualified teacher. Source: Department for Education, Explore Education Statistics, School workforce in England, 2025/26.
Teacher sickness absence
2024/255.4 days
- England
- 5.0 days
0.4 days higher than England.
Show the figures as a table
| Year | Peterborough | England |
|---|---|---|
| 2017/18 | 5.5 days | 4.0 days |
| 2018/19 | 5.0 days | 4.0 days |
| 2019/20 | Not published | Not published |
| 2020/21 | 4.8 days | 3.9 days |
| 2021/22 | 7.1 days | 6.3 days |
| 2022/23 | 6.1 days | 5.2 days |
| 2023/24 | 5.9 days | 5.3 days |
| 2024/25 | 5.4 days | 5.0 days |
Days lost to sickness absence in the school year, averaged across all teachers. Source: Department for Education, Explore Education Statistics, School workforce in England, 2024/25.
Primary schools
Overall absence
2024/255.2%
- England
- 5.2%
The same as England.
Show the figures as a table
| Year | Peterborough | England |
|---|---|---|
| 2017/18 | 4.2% | 4.2% |
| 2018/19 | 4.2% | 4.0% |
| 2020/21 | 3.9% | 3.6% |
| 2021/22 | 6.6% | 6.3% |
| 2022/23 | 6.1% | 5.9% |
| 2023/24 | 5.4% | 5.5% |
| 2024/25 | 5.2% | 5.2% |
Sessions missed for any reason, as a share of all possible sessions in the school year. Source: Department for Education, Explore Education Statistics, Pupil absence in schools in England, 2024/25.
Persistent absence
2024/2513.6%
- England
- 13.0%
0.6 percentage points higher than England.
Show the figures as a table
| Year | Peterborough | England |
|---|---|---|
| 2017/18 | 9.0% | 8.7% |
| 2018/19 | 9.1% | 8.2% |
| 2020/21 | 10.0% | 8.8% |
| 2021/22 | 19.4% | 17.7% |
| 2022/23 | 17.6% | 16.2% |
| 2023/24 | 14.6% | 14.6% |
| 2024/25 | 13.6% | 13.0% |
Pupils who missed 10% or more of their possible sessions, as a share of pupils. Source: Department for Education, Explore Education Statistics, Pupil absence in schools in England, 2024/25.
Severe absence
2024/250.9%
- England
- 0.9%
The same as England.
Show the figures as a table
| Year | Peterborough | England |
|---|---|---|
| 2017/18 | 0.4% | 0.4% |
| 2018/19 | 0.5% | 0.4% |
| 2020/21 | 0.9% | 0.7% |
| 2021/22 | 0.8% | 0.6% |
| 2022/23 | 0.7% | 0.7% |
| 2023/24 | 0.8% | 0.9% |
| 2024/25 | 0.9% | 0.9% |
Pupils who missed 50% or more of their possible sessions, as a share of pupils. Source: Department for Education, Explore Education Statistics, Pupil absence in schools in England, 2024/25.
Suspensions per 100 pupils
2024/254.86
- England
- 2.47
2.39 higher than England.
Show the figures as a table
| Year | Peterborough | England |
|---|---|---|
| 2017/18 | 1.61 | 1.40 |
| 2018/19 | 1.99 | 1.41 |
| 2019/20 | 1.47 | 1.00 |
| 2020/21 | 1.26 | 0.99 |
| 2021/22 | 3.19 | 1.42 |
| 2022/23 | 3.08 | 1.81 |
| 2023/24 | 4.08 | 2.27 |
| 2024/25 | 4.86 | 2.47 |
Suspensions in the school year for every 100 pupils on roll. One pupil can be suspended more than once. Source: Department for Education, Explore Education Statistics, Suspensions and permanent exclusions in England, 2024/25.
Permanent exclusions per 100 pupils
2024/250.04
- England
- 0.03
0.01 higher than England.
Show the figures as a table
| Year | Peterborough | England |
|---|---|---|
| 2017/18 | 0.02 | 0.03 |
| 2018/19 | 0.05 | 0.02 |
| 2019/20 | 0.02 | 0.02 |
| 2020/21 | 0.02 | 0.01 |
| 2021/22 | 0.03 | 0.02 |
| 2022/23 | 0.04 | 0.03 |
| 2023/24 | 0.01 | 0.03 |
| 2024/25 | 0.04 | 0.03 |
Permanent exclusions in the school year for every 100 pupils on roll. Source: Department for Education, Explore Education Statistics, Suspensions and permanent exclusions in England, 2024/25.
Reading, writing and maths: expected standard
2025/26 (provisional)61%
- England
- 63%
2 percentage points lower than England.
Show the figures as a table
| Year | Peterborough | England |
|---|---|---|
| 2021/22 | 55% | 59% |
| 2022/23 | 54% | 60% |
| 2023/24 | 55% | 61% |
| 2024/25 | 61% | 63% |
| 2025/26 (provisional) | 61% | 63% |
Pupils at the end of key stage 2 who met the expected standard in reading, writing and maths combined. Source: Department for Education, Explore Education Statistics, Key stage 2 attainment, 2025/26.
Reading, writing and maths: higher standard
2025/26 (provisional)5%
- England
- 9%
4 percentage points lower than England.
Show the figures as a table
| Year | Peterborough | England |
|---|---|---|
| 2021/22 | 4% | 7% |
| 2022/23 | 4% | 8% |
| 2023/24 | 4% | 8% |
| 2024/25 | 5% | 8% |
| 2025/26 (provisional) | 5% | 9% |
Pupils at the end of key stage 2 who met the higher standard in reading, writing and maths combined. Source: Department for Education, Explore Education Statistics, Key stage 2 attainment, 2025/26.
Eligible for free school meals
2024/2530.5%
- England
- 24.7%
5.8 percentage points higher than England.
Show the figures as a table
| Year | Peterborough | England |
|---|---|---|
| 2021/22 | 28.1% | 23.1% |
| 2022/23 | 29.4% | 24.0% |
| 2023/24 | 29.9% | 24.3% |
| 2024/25 | 30.5% | 24.7% |
Pupils known to be eligible for free school meals on census day in January. Source: Department for Education, Explore Education Statistics, Schools, pupils and their characteristics, 2024/25.
SEN support
2024/2514.8%
- England
- 15.0%
0.2 percentage points lower than England.
Show the figures as a table
| Year | Peterborough | England |
|---|---|---|
| 2021/22 | 12.1% | 13.0% |
| 2022/23 | 12.6% | 13.5% |
| 2023/24 | 13.4% | 14.1% |
| 2024/25 | 14.8% | 15.0% |
Pupils receiving special educational needs support without an education, health and care plan. Source: Department for Education, Explore Education Statistics, Schools, pupils and their characteristics, 2024/25.
Education, health and care plan
2024/253.7%
- England
- 3.5%
0.2 percentage points higher than England.
Show the figures as a table
| Year | Peterborough | England |
|---|---|---|
| 2021/22 | 2.1% | 2.3% |
| 2022/23 | 2.4% | 2.5% |
| 2023/24 | 3.0% | 3.0% |
| 2024/25 | 3.7% | 3.5% |
Pupils with an education, health and care plan. Source: Department for Education, Explore Education Statistics, Schools, pupils and their characteristics, 2024/25.
First language other than English
2024/2541.9%
- England
- 23.4%
18.5 percentage points higher than England.
Show the figures as a table
| Year | Peterborough | England |
|---|---|---|
| 2021/22 | 39.3% | 21.2% |
| 2022/23 | 39.8% | 22.0% |
| 2023/24 | 40.7% | 22.8% |
| 2024/25 | 41.9% | 23.4% |
Pupils whose first language is known or believed to be other than English. Source: Department for Education, Explore Education Statistics, Schools, pupils and their characteristics, 2024/25.
Pupils per qualified teacher
2025/2621.0
- England
- 21.2
0.2 lower than England.
Show the figures as a table
| Year | Peterborough | England |
|---|---|---|
| 2017/18 | 22.0 | 21.3 |
| 2018/19 | 21.2 | 21.4 |
| 2019/20 | 21.4 | 21.4 |
| 2020/21 | 21.4 | 21.1 |
| 2021/22 | 21.4 | 21.0 |
| 2022/23 | 21.6 | 21.1 |
| 2023/24 | 22.1 | 21.2 |
| 2024/25 | 21.8 | 21.3 |
| 2025/26 | 21.0 | 21.2 |
Full-time equivalent pupils for each full-time equivalent qualified teacher. Source: Department for Education, Explore Education Statistics, School workforce in England, 2025/26.
Secondary schools
Overall absence
2024/258.2%
- England
- 8.4%
0.2 percentage points lower than England.
Show the figures as a table
| Year | Peterborough | England |
|---|---|---|
| 2017/18 | 5.5% | 5.5% |
| 2018/19 | 5.4% | 5.5% |
| 2020/21 | 5.4% | 5.5% |
| 2021/22 | 9.3% | 9.0% |
| 2022/23 | 9.0% | 9.0% |
| 2023/24 | 8.5% | 8.9% |
| 2024/25 | 8.2% | 8.4% |
Sessions missed for any reason, as a share of all possible sessions in the school year. Source: Department for Education, Explore Education Statistics, Pupil absence in schools in England, 2024/25.
Persistent absence
2024/2524.1%
- England
- 23.4%
0.7 percentage points higher than England.
Show the figures as a table
| Year | Peterborough | England |
|---|---|---|
| 2017/18 | 14.6% | 13.9% |
| 2018/19 | 13.8% | 13.7% |
| 2020/21 | 14.8% | 14.8% |
| 2021/22 | 30.4% | 27.7% |
| 2022/23 | 28.0% | 26.5% |
| 2023/24 | 25.2% | 25.6% |
| 2024/25 | 24.1% | 23.4% |
Pupils who missed 10% or more of their possible sessions, as a share of pupils. Source: Department for Education, Explore Education Statistics, Pupil absence in schools in England, 2024/25.
Severe absence
2024/253.4%
- England
- 3.9%
0.5 percentage points lower than England.
Show the figures as a table
| Year | Peterborough | England |
|---|---|---|
| 2017/18 | 0.9% | 1.2% |
| 2018/19 | 0.9% | 1.3% |
| 2020/21 | 1.2% | 1.5% |
| 2021/22 | 2.4% | 2.7% |
| 2022/23 | 2.9% | 3.4% |
| 2023/24 | 3.1% | 3.8% |
| 2024/25 | 3.4% | 3.9% |
Pupils who missed 50% or more of their possible sessions, as a share of pupils. Source: Department for Education, Explore Education Statistics, Pupil absence in schools in England, 2024/25.
Suspensions per 100 pupils
2024/2529.56
- England
- 21.24
8.32 higher than England.
Show the figures as a table
| Year | Peterborough | England |
|---|---|---|
| 2017/18 | 10.39 | 10.13 |
| 2018/19 | 10.79 | 10.75 |
| 2019/20 | 7.08 | 7.43 |
| 2020/21 | 9.66 | 8.48 |
| 2021/22 | 15.58 | 13.96 |
| 2022/23 | 21.62 | 18.90 |
| 2023/24 | 31.59 | 22.61 |
| 2024/25 | 29.56 | 21.24 |
Suspensions in the school year for every 100 pupils on roll. One pupil can be suspended more than once. Source: Department for Education, Explore Education Statistics, Suspensions and permanent exclusions in England, 2024/25.
Permanent exclusions per 100 pupils
2024/250.29
- England
- 0.23
0.06 higher than England.
Show the figures as a table
| Year | Peterborough | England |
|---|---|---|
| 2017/18 | 0.21 | 0.20 |
| 2018/19 | 0.39 | 0.20 |
| 2019/20 | 0.21 | 0.13 |
| 2020/21 | 0.10 | 0.10 |
| 2021/22 | 0.21 | 0.16 |
| 2022/23 | 0.24 | 0.22 |
| 2023/24 | 0.24 | 0.25 |
| 2024/25 | 0.29 | 0.23 |
Permanent exclusions in the school year for every 100 pupils on roll. Source: Department for Education, Explore Education Statistics, Suspensions and permanent exclusions in England, 2024/25.
Attainment 8
2025/26 (provisional)44.5
- England
- 47.4
2.9 lower than England.
Show the figures as a table
| Year | Peterborough | England |
|---|---|---|
| 2021/22 | 47.5 | 49.8 |
| 2022/23 | 43.9 | 47.2 |
| 2023/24 | 43.7 | 46.9 |
| 2024/25 | 44.0 | 47.1 |
| 2025/26 (provisional) | 44.5 | 47.4 |
The average of pupils' points across eight GCSE-level qualifications, with English and maths counted twice. Source: Department for Education, Explore Education Statistics, Key stage 4 performance, 2025/26.
English and maths: grade 4 or above
2025/26 (provisional)61%
- England
- 66%
5 percentage points lower than England.
Show the figures as a table
| Year | Peterborough | England |
|---|---|---|
| 2021/22 | 67% | 70% |
| 2022/23 | 61% | 67% |
| 2023/24 | 60% | 67% |
| 2024/25 | 61% | 66% |
| 2025/26 (provisional) | 61% | 66% |
Pupils at the end of key stage 4 with grade 4 or above in both English and maths. Source: Department for Education, Explore Education Statistics, Key stage 4 performance, 2025/26.
English and maths: grade 5 or above
2025/26 (provisional)41%
- England
- 48%
7 percentage points lower than England.
Show the figures as a table
| Year | Peterborough | England |
|---|---|---|
| 2021/22 | 44% | 51% |
| 2022/23 | 37% | 46% |
| 2023/24 | 39% | 47% |
| 2024/25 | 40% | 47% |
| 2025/26 (provisional) | 41% | 48% |
Pupils at the end of key stage 4 with grade 5 or above in both English and maths. Source: Department for Education, Explore Education Statistics, Key stage 4 performance, 2025/26.
Eligible for free school meals
2024/2529.7%
- England
- 25.8%
3.9 percentage points higher than England.
Show the figures as a table
| Year | Peterborough | England |
|---|---|---|
| 2021/22 | 22.5% | 20.9% |
| 2022/23 | 24.8% | 22.7% |
| 2023/24 | 27.3% | 24.1% |
| 2024/25 | 29.7% | 25.8% |
Pupils known to be eligible for free school meals on census day in January. Source: Department for Education, Explore Education Statistics, Schools, pupils and their characteristics, 2024/25.
SEN support
2024/259.9%
- England
- 13.4%
3.5 percentage points lower than England.
Show the figures as a table
| Year | Peterborough | England |
|---|---|---|
| 2021/22 | 8.4% | 11.9% |
| 2022/23 | 8.9% | 12.4% |
| 2023/24 | 9.3% | 12.9% |
| 2024/25 | 9.9% | 13.4% |
Pupils receiving special educational needs support without an education, health and care plan. Source: Department for Education, Explore Education Statistics, Schools, pupils and their characteristics, 2024/25.
Education, health and care plan
2024/252.6%
- England
- 3.1%
0.5 percentage points lower than England.
Show the figures as a table
| Year | Peterborough | England |
|---|---|---|
| 2021/22 | 1.6% | 2.2% |
| 2022/23 | 1.9% | 2.4% |
| 2023/24 | 2.2% | 2.7% |
| 2024/25 | 2.6% | 3.1% |
Pupils with an education, health and care plan. Source: Department for Education, Explore Education Statistics, Schools, pupils and their characteristics, 2024/25.
First language other than English
2024/2528.3%
- England
- 19.2%
9.1 percentage points higher than England.
Show the figures as a table
| Year | Peterborough | England |
|---|---|---|
| 2021/22 | 28.3% | 17.5% |
| 2022/23 | 28.4% | 18.1% |
| 2023/24 | 28.4% | 18.6% |
| 2024/25 | 28.3% | 19.2% |
Pupils whose first language is known or believed to be other than English. Source: Department for Education, Explore Education Statistics, Schools, pupils and their characteristics, 2024/25.
Pupils per qualified teacher
2025/2617.8
- England
- 17.3
0.5 higher than England.
Show the figures as a table
| Year | Peterborough | England |
|---|---|---|
| 2017/18 | 17.4 | 16.5 |
| 2018/19 | 16.8 | 16.8 |
| 2019/20 | 17.9 | 17.2 |
| 2020/21 | 18.3 | 17.1 |
| 2021/22 | 18.3 | 17.1 |
| 2022/23 | 18.5 | 17.2 |
| 2023/24 | 18.6 | 17.4 |
| 2024/25 | 18.4 | 17.3 |
| 2025/26 | 17.8 | 17.3 |
Full-time equivalent pupils for each full-time equivalent qualified teacher. Source: Department for Education, Explore Education Statistics, School workforce in England, 2025/26.
Special schools
Overall absence
2024/2511.7%
- England
- 12.8%
1.1 percentage points lower than England.
Show the figures as a table
| Year | Peterborough | England |
|---|---|---|
| 2017/18 | 10.3% | 10.2% |
| 2018/19 | 11.0% | 10.1% |
| 2020/21 | 13.2% | 15.2% |
| 2021/22 | 13.4% | 13.2% |
| 2022/23 | 12.9% | 13.0% |
| 2023/24 | 13.1% | 13.0% |
| 2024/25 | 11.7% | 12.8% |
Sessions missed for any reason, as a share of all possible sessions in the school year. Source: Department for Education, Explore Education Statistics, Pupil absence in schools in England, 2024/25.
Persistent absence
2024/2535.7%
- England
- 35.3%
0.4 percentage points higher than England.
Show the figures as a table
| Year | Peterborough | England |
|---|---|---|
| 2017/18 | 29.8% | 29.6% |
| 2018/19 | 28.3% | 28.8% |
| 2020/21 | 34.2% | 48.9% |
| 2021/22 | 40.5% | 40.4% |
| 2022/23 | 37.4% | 38.3% |
| 2023/24 | 39.2% | 37.2% |
| 2024/25 | 35.7% | 35.3% |
Pupils who missed 10% or more of their possible sessions, as a share of pupils. Source: Department for Education, Explore Education Statistics, Pupil absence in schools in England, 2024/25.
Severe absence
2024/255.8%
- England
- 6.9%
1.1 percentage points lower than England.
Show the figures as a table
| Year | Peterborough | England |
|---|---|---|
| 2017/18 | 5.7% | 4.4% |
| 2018/19 | 6.6% | 4.6% |
| 2020/21 | 7.4% | 5.6% |
| 2021/22 | 6.9% | 5.8% |
| 2022/23 | 5.5% | 6.2% |
| 2023/24 | 5.6% | 6.7% |
| 2024/25 | 5.8% | 6.9% |
Pupils who missed 50% or more of their possible sessions, as a share of pupils. Source: Department for Education, Explore Education Statistics, Pupil absence in schools in England, 2024/25.
Suspensions per 100 pupils
2024/2521.09
- England
- 12.32
8.77 higher than England.
Show the figures as a table
| Year | Peterborough | England |
|---|---|---|
| 2017/18 | 21.94 | 12.34 |
| 2018/19 | 18.32 | 11.32 |
| 2019/20 | 21.98 | 7.76 |
| 2020/21 | 10.17 | 7.29 |
| 2021/22 | 24.40 | 9.60 |
| 2022/23 | 32.23 | 10.99 |
| 2023/24 | 38.53 | 12.62 |
| 2024/25 | 21.09 | 12.32 |
Suspensions in the school year for every 100 pupils on roll. One pupil can be suspended more than once. Source: Department for Education, Explore Education Statistics, Suspensions and permanent exclusions in England, 2024/25.
Permanent exclusions per 100 pupils
2024/250.00
- England
- 0.08
0.08 lower than England.
Show the figures as a table
| Year | Peterborough | England |
|---|---|---|
| 2017/18 | 0.16 | 0.07 |
| 2018/19 | 0.00 | 0.06 |
| 2019/20 | 0.00 | 0.04 |
| 2020/21 | 0.00 | 0.03 |
| 2021/22 | 0.28 | 0.05 |
| 2022/23 | 0.87 | 0.08 |
| 2023/24 | 0.00 | 0.08 |
| 2024/25 | 0.00 | 0.08 |
Permanent exclusions in the school year for every 100 pupils on roll. Source: Department for Education, Explore Education Statistics, Suspensions and permanent exclusions in England, 2024/25.
Eligible for free school meals
2024/2552.7%
- England
- 48.8%
3.9 percentage points higher than England.
Show the figures as a table
| Year | Peterborough | England |
|---|---|---|
| 2021/22 | 44.3% | 44.4% |
| 2022/23 | 46.0% | 45.6% |
| 2023/24 | 49.1% | 47.1% |
| 2024/25 | 52.7% | 48.8% |
Pupils known to be eligible for free school meals on census day in January. Source: Department for Education, Explore Education Statistics, Schools, pupils and their characteristics, 2024/25.
SEN support
2024/250.0%
- England
- 0.5%
0.5 percentage points lower than England.
Show the figures as a table
| Year | Peterborough | England |
|---|---|---|
| 2021/22 | 0.0% | 0.9% |
| 2022/23 | 0.0% | 0.8% |
| 2023/24 | 0.3% | 0.7% |
| 2024/25 | 0.0% | 0.5% |
Pupils receiving special educational needs support without an education, health and care plan. Source: Department for Education, Explore Education Statistics, Schools, pupils and their characteristics, 2024/25.
Education, health and care plan
2024/25100.0%
- England
- 99.5%
0.5 percentage points higher than England.
Show the figures as a table
| Year | Peterborough | England |
|---|---|---|
| 2021/22 | 99.9% | 99.1% |
| 2022/23 | 100.0% | 99.2% |
| 2023/24 | 99.7% | 99.3% |
| 2024/25 | 100.0% | 99.5% |
Pupils with an education, health and care plan. Source: Department for Education, Explore Education Statistics, Schools, pupils and their characteristics, 2024/25.
First language other than English
2024/2526.0%
- England
- 14.4%
11.6 percentage points higher than England.
Show the figures as a table
| Year | Peterborough | England |
|---|---|---|
| 2021/22 | 26.0% | 14.5% |
| 2022/23 | 27.0% | 14.4% |
| 2023/24 | 26.4% | 14.4% |
| 2024/25 | 26.0% | 14.4% |
Pupils whose first language is known or believed to be other than English. Source: Department for Education, Explore Education Statistics, Schools, pupils and their characteristics, 2024/25.
Pupils per qualified teacher
2025/268.0
- England
- 7.3
0.7 higher than England.
Show the figures as a table
| Year | Peterborough | England |
|---|---|---|
| 2017/18 | 8.6 | 6.7 |
| 2018/19 | 8.6 | 6.8 |
| 2019/20 | 8.0 | 7.0 |
| 2020/21 | 7.6 | 6.8 |
| 2021/22 | 7.4 | 6.9 |
| 2022/23 | 7.0 | 7.0 |
| 2023/24 | 7.6 | 7.1 |
| 2024/25 | 8.1 | 7.3 |
| 2025/26 | 8.0 | 7.3 |
Full-time equivalent pupils for each full-time equivalent qualified teacher. Source: Department for Education, Explore Education Statistics, School workforce in England, 2025/26.
Schools in Peterborough
Listed by name. Filter by phase or type; sort by name or size. Nothing here is sorted by results.
Showing 83 of 83 schools in Peterborough.
| School | Phase | Type | Town | Pupils |
|---|---|---|---|---|
| All Saints' CofE (Aided) Primary School | Primary | Maintained | Peterborough | 418 |
| Arthur Mellows Village College | Secondary | Academy | Peterborough | 1,672 |
| Barnack CofE (Controlled) Primary School | Primary | Maintained | Stamford | 180 |
| Bishop Creighton Academy | Primary | Academy | Peterborough | 203 |
| Braybrook Primary Academy | Primary | Academy | Peterborough | 206 |
| Brewster Avenue Infant School | Primary | Maintained | Peterborough | 154 |
| Castor CofE Primary School | Primary | Maintained | Peterborough | 185 |
| Caverstede Nursery School | Nursery | Maintained | Peterborough | 113 |
| City of Peterborough Academy | Secondary | Free school | Peterborough | 853 |
| Discovery Primary Academy | Primary | Academy | Peterborough | 419 |
| Dogsthorpe Academy | Primary | Academy | Peterborough | 318 |
| Dogsthorpe Infant School | Primary | Academy | Peterborough | 235 |
| Eye CofE Primary School | Primary | Maintained | Peterborough | 426 |
| Eyrescroft Primary School | Primary | Academy | Peterborough | 222 |
| Fulbridge Academy | Primary | Academy | Peterborough | 939 |
| Gladstone Primary Academy | Primary | Academy | Peterborough | 469 |
| Great Haddon Primary School | Primary | Free school | Peterborough | Not published |
| Greater Peterborough UTC | Secondary | Free school | Peterborough | 464 |
| Gunthorpe Primary School | Primary | Academy | Peterborough | 290 |
| Hampton College | All-through | Academy | Peterborough | 1,608 |
| Hampton Gardens Secondary School | Secondary | Free school | Peterborough | 1,310 |
| Hampton Hargate Primary School | Primary | Maintained | Peterborough | 641 |
| Hampton Lakes Primary School | Primary | Free school | Peterborough | 417 |
| Hampton Vale Primary Academy | Primary | Academy | Peterborough | 702 |
| Heltwate School | Special | Maintained special | Peterborough | 211 |
| Heritage Park Primary School | Primary | Maintained | Peterborough | 202 |
| Highlees Primary School | Primary | Academy | Peterborough | 351 |
| Jack Hunt Academy | Secondary | Academy | Peterborough | 1,939 |
| John Clare Primary School | Primary | Academy | Peterborough | 130 |
| Ken Stimpson Academy | Secondary | Academy | Peterborough | 996 |
| Leighton Primary and Preschool | Primary | Maintained | Peterborough | 298 |
| Lime Academy Abbotsmede | Primary | Academy | Peterborough | 423 |
| Lime Academy Orton | Special | Academy | Peterborough | 152 |
| Lime Academy Parnwell | Primary | Academy | Peterborough | 287 |
| Lime Academy Watergall | Primary | Academy | Peterborough | 298 |
| Longthorpe Primary Academy | Primary | Academy | Peterborough | 401 |
| Manor Drive Primary Academy | Primary | Free school | Peterborough | 319 |
| Manor Drive Secondary Academy | Secondary | Free school | Peterborough | 594 |
| Marshfields School | Special | Maintained special | Peterborough | 205 |
| Medeshamstede Academy | Special | Free school | Peterborough | 114 |
| Nene Park Academy | Secondary | Academy | Peterborough | 1,478 |
| Nene Valley Primary School | Primary | Academy | Peterborough | 311 |
| NeneGate | Special | Academy | Peterborough | 69 |
| Newark Hill Academy | Primary | Academy | Peterborough | 435 |
| Newborough CofE Primary School | Primary | Academy | Peterborough | 162 |
| Northborough Primary School | Primary | Academy | Peterborough | 187 |
| Norwood Primary School | Primary | Maintained | Peterborough | 200 |
| Nova Primary Academy | Primary | Academy | Peterborough | 343 |
| Oakdale Primary School | Primary | Maintained | Peterborough | 400 |
| Old Fletton Primary School | Primary | Maintained | Peterborough | 432 |
| Ormiston Bushfield Academy | Secondary | Academy | Peterborough | 1,212 |
| Ormiston Meadows Academy | Primary | Academy | Peterborough | 181 |
| Orton Wistow Primary School | Primary | Academy | Peterborough | 378 |
| Paston Ridings Primary School | Primary | Maintained | Peterborough | 350 |
| Peakirk-Cum-Glinton Cofe Primary Academy | Primary | Academy | Peterborough | 197 |
| Queen Katharine Academy | Secondary | Academy | Peterborough | 1,619 |
| Queen's Drive Infant School | Primary | Maintained | Peterborough | 208 |
| Ravensthorpe Primary Academy | Primary | Academy | Peterborough | 316 |
| Richard Barnes Academy | Alternative provision | Academy | Peterborough | 112 |
| Sacred Heart Catholic Primary School | Primary | Academy | Peterborough | 209 |
| Saint Michael CofE Primary School | Primary | Academy | Peterborough | 408 |
| Southfields Primary School | Primary | Maintained | Peterborough | 540 |
| St Augustine's CofE (Voluntary Aided) Junior School | Primary | Maintained | Peterborough | 217 |
| St Botolph's Church of England Primary School | Primary | Academy | Peterborough | 346 |
| St John Fisher Catholic High School | Secondary | Academy | Peterborough | Not published |
| St John Henry Newman Catholic VA Primary School | Primary | Maintained | Peterborough | 415 |
| St John's Church School | Primary | Maintained | Peterborough | 433 |
| St Thomas More Catholic Primary School | Primary | Academy | Peterborough | 407 |
| Stanground Academy | Secondary | Academy | Peterborough | 1,654 |
| Stanground St Johns CofE Primary School | Primary | Academy | Peterborough | 183 |
| The Beeches Primary School | Primary | Maintained | Peterborough | 619 |
| The Duke of Bedford Primary School | Primary | Maintained | Peterborough | 221 |
| The King's (The Cathedral) School | All-through | Academy | Peterborough | 1,256 |
| Thomas Deacon Academy | All-through | Academy | Peterborough | 2,256 |
| Thorpe Primary Academy | Primary | Academy | Peterborough | 447 |
| Welbourne Primary Academy | Primary | Academy | Peterborough | 177 |
| Welland Academy | Primary | Academy | Peterborough | 405 |
| Werrington Primary School | Primary | Academy | Peterborough | 382 |
| West Town Primary Academy | Primary | Academy | Peterborough | 412 |
| William Law CofE Primary School | Primary | Academy | Peterborough | 493 |
| Winyates Primary School | Primary | Maintained | Peterborough | 175 |
| Wittering Primary School | Primary | Academy | Peterborough | 234 |
| Woodston Primary School | Primary | Academy | Peterborough | 495 |