Islington
63 state-funded schools with 22,316 pupils on roll, in the London region. Every school’s page has its published figures against Islington and England.
- Primary
- 39
- Secondary
- 9
- All-through
- 1
- Special
- 6
- Alternative provision
- 4
- Nursery
- 3
- 16 to 19
- 1
- Maintained
- 44
- Academies
- 9
- Free schools
- 8
- Maintained special
- 2
Map
Zoom in to see each school. Open the full map
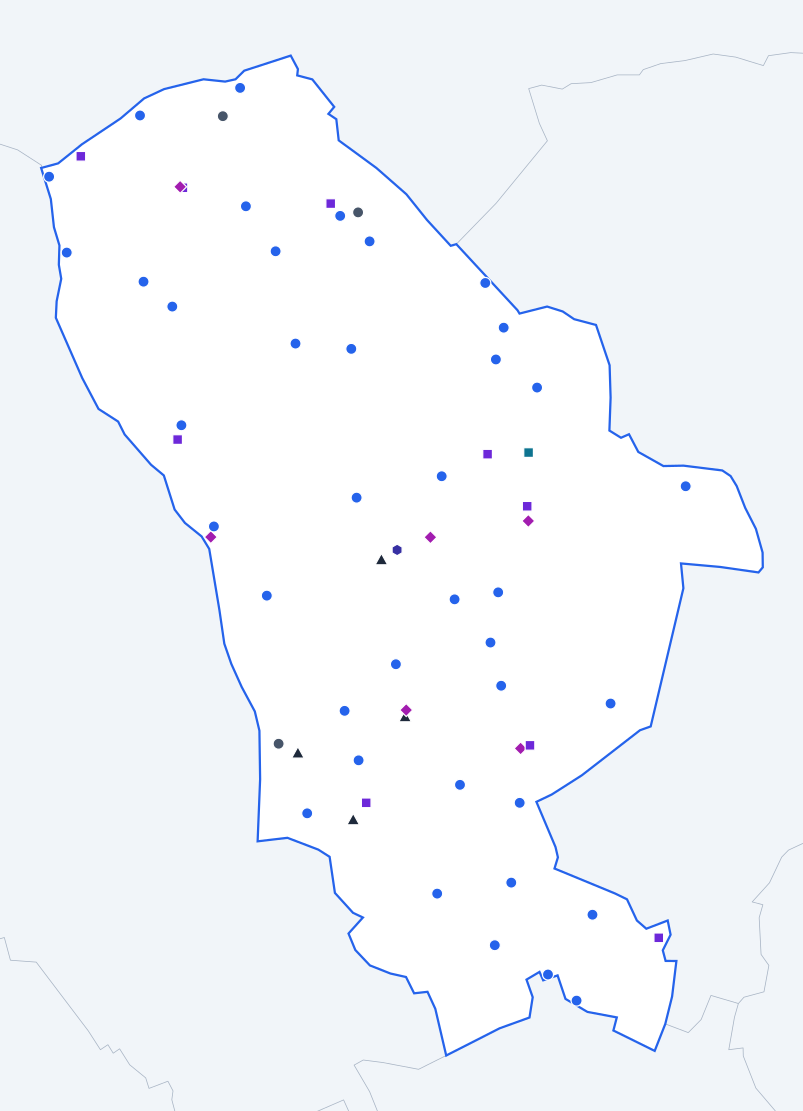
ONS, OS © Crown copyright 2025 · GIAS · © OpenStreetMap
Islington against England
Published figures for the authority’s schools, set against the same kind of school across England.
All state-funded schools
Overall absence
2024/257.7%
- England
- 6.8%
0.9 percentage points higher than England.
Show the figures as a table
| Year | Islington | England |
|---|---|---|
| 2017/18 | 5.0% | 4.8% |
| 2018/19 | 4.9% | 4.7% |
| 2020/21 | 5.1% | 4.6% |
| 2021/22 | 7.3% | 7.6% |
| 2022/23 | 7.9% | 7.4% |
| 2023/24 | 7.4% | 7.1% |
| 2024/25 | 7.7% | 6.8% |
Sessions missed for any reason, as a share of all possible sessions in the school year. Source: Department for Education, Explore Education Statistics, Pupil absence in schools in England, 2024/25.
Persistent absence
2024/2522.4%
- England
- 18.1%
4.3 percentage points higher than England.
Show the figures as a table
| Year | Islington | England |
|---|---|---|
| 2017/18 | 12.4% | 11.2% |
| 2018/19 | 11.8% | 10.9% |
| 2020/21 | 14.1% | 12.1% |
| 2021/22 | 22.2% | 22.5% |
| 2022/23 | 25.2% | 21.2% |
| 2023/24 | 22.1% | 20.0% |
| 2024/25 | 22.4% | 18.1% |
Pupils who missed 10% or more of their possible sessions, as a share of pupils. Source: Department for Education, Explore Education Statistics, Pupil absence in schools in England, 2024/25.
Severe absence
2024/252.5%
- England
- 2.4%
0.1 percentage points higher than England.
Show the figures as a table
| Year | Islington | England |
|---|---|---|
| 2017/18 | 0.6% | 0.8% |
| 2018/19 | 0.6% | 0.8% |
| 2020/21 | 0.9% | 1.1% |
| 2021/22 | 1.4% | 1.7% |
| 2022/23 | 1.8% | 2.0% |
| 2023/24 | 2.0% | 2.3% |
| 2024/25 | 2.5% | 2.4% |
Pupils who missed 50% or more of their possible sessions, as a share of pupils. Source: Department for Education, Explore Education Statistics, Pupil absence in schools in England, 2024/25.
Suspensions per 100 pupils
2024/2511.02
- England
- 10.88
0.14 higher than England.
Show the figures as a table
| Year | Islington | England |
|---|---|---|
| 2017/18 | 7.16 | 5.08 |
| 2018/19 | 7.91 | 5.36 |
| 2019/20 | 5.63 | 3.76 |
| 2020/21 | 6.47 | 4.25 |
| 2021/22 | 9.48 | 6.91 |
| 2022/23 | 7.70 | 9.33 |
| 2023/24 | 9.28 | 11.31 |
| 2024/25 | 11.02 | 10.88 |
Suspensions in the school year for every 100 pupils on roll. One pupil can be suspended more than once. Source: Department for Education, Explore Education Statistics, Suspensions and permanent exclusions in England, 2024/25.
Permanent exclusions per 100 pupils
2024/250.04
- England
- 0.12
0.08 lower than England.
Show the figures as a table
| Year | Islington | England |
|---|---|---|
| 2017/18 | 0.11 | 0.10 |
| 2018/19 | 0.10 | 0.10 |
| 2019/20 | 0.05 | 0.06 |
| 2020/21 | 0.00 | 0.05 |
| 2021/22 | 0.05 | 0.08 |
| 2022/23 | 0.05 | 0.11 |
| 2023/24 | 0.07 | 0.13 |
| 2024/25 | 0.04 | 0.12 |
Permanent exclusions in the school year for every 100 pupils on roll. Source: Department for Education, Explore Education Statistics, Suspensions and permanent exclusions in England, 2024/25.
Eligible for free school meals
2024/2545.8%
- England
- 25.7%
20.1 percentage points higher than England.
Show the figures as a table
| Year | Islington | England |
|---|---|---|
| 2021/22 | 41.0% | 22.5% |
| 2022/23 | 42.9% | 23.8% |
| 2023/24 | 44.0% | 24.6% |
| 2024/25 | 45.8% | 25.7% |
Pupils known to be eligible for free school meals on census day in January. Source: Department for Education, Explore Education Statistics, Schools, pupils and their characteristics, 2024/25.
SEN support
2024/2517.3%
- England
- 14.0%
3.3 percentage points higher than England.
Show the figures as a table
| Year | Islington | England |
|---|---|---|
| 2021/22 | 15.1% | 12.4% |
| 2022/23 | 16.4% | 12.9% |
| 2023/24 | 17.0% | 13.4% |
| 2024/25 | 17.3% | 14.0% |
Pupils receiving special educational needs support without an education, health and care plan. Source: Department for Education, Explore Education Statistics, Schools, pupils and their characteristics, 2024/25.
Education, health and care plan
2024/257.6%
- England
- 5.2%
2.4 percentage points higher than England.
Show the figures as a table
| Year | Islington | England |
|---|---|---|
| 2021/22 | 5.6% | 3.8% |
| 2022/23 | 6.3% | 4.2% |
| 2023/24 | 6.9% | 4.7% |
| 2024/25 | 7.6% | 5.2% |
Pupils with an education, health and care plan. Source: Department for Education, Explore Education Statistics, Schools, pupils and their characteristics, 2024/25.
First language other than English
2024/2537.8%
- England
- 21.4%
16.4 percentage points higher than England.
Show the figures as a table
| Year | Islington | England |
|---|---|---|
| 2021/22 | 38.1% | 19.6% |
| 2022/23 | 37.8% | 20.2% |
| 2023/24 | 37.3% | 20.8% |
| 2024/25 | 37.8% | 21.4% |
Pupils whose first language is known or believed to be other than English. Source: Department for Education, Explore Education Statistics, Schools, pupils and their characteristics, 2024/25.
Pupils per qualified teacher
2025/2616.9
- England
- 18.5
1.6 lower than England.
Show the figures as a table
| Year | Islington | England |
|---|---|---|
| 2017/18 | 16.3 | 18.4 |
| 2018/19 | 16.1 | 18.6 |
| 2019/20 | 16.5 | 18.8 |
| 2020/21 | 16.1 | 18.5 |
| 2021/22 | 16.5 | 18.5 |
| 2022/23 | 16.4 | 18.5 |
| 2023/24 | 16.7 | 18.6 |
| 2024/25 | 17.2 | 18.6 |
| 2025/26 | 16.9 | 18.5 |
Full-time equivalent pupils for each full-time equivalent qualified teacher. Source: Department for Education, Explore Education Statistics, School workforce in England, 2025/26.
Teacher sickness absence
2024/255.6 days
- England
- 5.0 days
0.6 days higher than England.
Show the figures as a table
| Year | Islington | England |
|---|---|---|
| 2017/18 | 4.0 days | 4.0 days |
| 2018/19 | 4.0 days | 4.0 days |
| 2019/20 | Not published | Not published |
| 2020/21 | 3.6 days | 3.9 days |
| 2021/22 | 6.0 days | 6.3 days |
| 2022/23 | 5.7 days | 5.2 days |
| 2023/24 | 6.1 days | 5.3 days |
| 2024/25 | 5.6 days | 5.0 days |
Days lost to sickness absence in the school year, averaged across all teachers. Source: Department for Education, Explore Education Statistics, School workforce in England, 2024/25.
Primary schools
Overall absence
2024/256.3%
- England
- 5.2%
1.1 percentage points higher than England.
Show the figures as a table
| Year | Islington | England |
|---|---|---|
| 2017/18 | 4.5% | 4.2% |
| 2018/19 | 4.3% | 4.0% |
| 2020/21 | 4.0% | 3.6% |
| 2021/22 | 6.2% | 6.3% |
| 2022/23 | 6.7% | 5.9% |
| 2023/24 | 6.1% | 5.5% |
| 2024/25 | 6.3% | 5.2% |
Sessions missed for any reason, as a share of all possible sessions in the school year. Source: Department for Education, Explore Education Statistics, Pupil absence in schools in England, 2024/25.
Persistent absence
2024/2518.7%
- England
- 13.0%
5.7 percentage points higher than England.
Show the figures as a table
| Year | Islington | England |
|---|---|---|
| 2017/18 | 11.0% | 8.7% |
| 2018/19 | 9.7% | 8.2% |
| 2020/21 | 9.6% | 8.8% |
| 2021/22 | 18.4% | 17.7% |
| 2022/23 | 21.6% | 16.2% |
| 2023/24 | 18.4% | 14.6% |
| 2024/25 | 18.7% | 13.0% |
Pupils who missed 10% or more of their possible sessions, as a share of pupils. Source: Department for Education, Explore Education Statistics, Pupil absence in schools in England, 2024/25.
Severe absence
2024/251.0%
- England
- 0.9%
0.1 percentage points higher than England.
Show the figures as a table
| Year | Islington | England |
|---|---|---|
| 2017/18 | 0.4% | 0.4% |
| 2018/19 | 0.3% | 0.4% |
| 2020/21 | 0.6% | 0.7% |
| 2021/22 | 0.6% | 0.6% |
| 2022/23 | 1.0% | 0.7% |
| 2023/24 | 0.8% | 0.9% |
| 2024/25 | 1.0% | 0.9% |
Pupils who missed 50% or more of their possible sessions, as a share of pupils. Source: Department for Education, Explore Education Statistics, Pupil absence in schools in England, 2024/25.
Suspensions per 100 pupils
2024/251.95
- England
- 2.47
0.52 lower than England.
Show the figures as a table
| Year | Islington | England |
|---|---|---|
| 2017/18 | 2.08 | 1.40 |
| 2018/19 | 1.67 | 1.41 |
| 2019/20 | 1.34 | 1.00 |
| 2020/21 | 1.46 | 0.99 |
| 2021/22 | 1.81 | 1.42 |
| 2022/23 | 1.75 | 1.81 |
| 2023/24 | 1.78 | 2.27 |
| 2024/25 | 1.95 | 2.47 |
Suspensions in the school year for every 100 pupils on roll. One pupil can be suspended more than once. Source: Department for Education, Explore Education Statistics, Suspensions and permanent exclusions in England, 2024/25.
Permanent exclusions per 100 pupils
2024/250.01
- England
- 0.03
0.02 lower than England.
Show the figures as a table
| Year | Islington | England |
|---|---|---|
| 2017/18 | 0.04 | 0.03 |
| 2018/19 | 0.02 | 0.02 |
| 2019/20 | 0.01 | 0.02 |
| 2020/21 | 0.00 | 0.01 |
| 2021/22 | 0.03 | 0.02 |
| 2022/23 | 0.01 | 0.03 |
| 2023/24 | 0.01 | 0.03 |
| 2024/25 | 0.01 | 0.03 |
Permanent exclusions in the school year for every 100 pupils on roll. Source: Department for Education, Explore Education Statistics, Suspensions and permanent exclusions in England, 2024/25.
Reading, writing and maths: expected standard
2025/26 (provisional)70%
- England
- 63%
7 percentage points higher than England.
Show the figures as a table
| Year | Islington | England |
|---|---|---|
| 2021/22 | 63% | 59% |
| 2022/23 | 65% | 60% |
| 2023/24 | 67% | 61% |
| 2024/25 | 67% | 63% |
| 2025/26 (provisional) | 70% | 63% |
Pupils at the end of key stage 2 who met the expected standard in reading, writing and maths combined. Source: Department for Education, Explore Education Statistics, Key stage 2 attainment, 2025/26.
Reading, writing and maths: higher standard
2025/26 (provisional)14%
- England
- 9%
5 percentage points higher than England.
Show the figures as a table
| Year | Islington | England |
|---|---|---|
| 2021/22 | 11% | 7% |
| 2022/23 | 11% | 8% |
| 2023/24 | 12% | 8% |
| 2024/25 | 13% | 8% |
| 2025/26 (provisional) | 14% | 9% |
Pupils at the end of key stage 2 who met the higher standard in reading, writing and maths combined. Source: Department for Education, Explore Education Statistics, Key stage 2 attainment, 2025/26.
Eligible for free school meals
2024/2544.1%
- England
- 24.7%
19.4 percentage points higher than England.
Show the figures as a table
| Year | Islington | England |
|---|---|---|
| 2021/22 | 40.2% | 23.1% |
| 2022/23 | 41.6% | 24.0% |
| 2023/24 | 42.5% | 24.3% |
| 2024/25 | 44.1% | 24.7% |
Pupils known to be eligible for free school meals on census day in January. Source: Department for Education, Explore Education Statistics, Schools, pupils and their characteristics, 2024/25.
SEN support
2024/2518.1%
- England
- 15.0%
3.1 percentage points higher than England.
Show the figures as a table
| Year | Islington | England |
|---|---|---|
| 2021/22 | 15.5% | 13.0% |
| 2022/23 | 16.7% | 13.5% |
| 2023/24 | 17.5% | 14.1% |
| 2024/25 | 18.1% | 15.0% |
Pupils receiving special educational needs support without an education, health and care plan. Source: Department for Education, Explore Education Statistics, Schools, pupils and their characteristics, 2024/25.
Education, health and care plan
2024/256.0%
- England
- 3.5%
2.5 percentage points higher than England.
Show the figures as a table
| Year | Islington | England |
|---|---|---|
| 2021/22 | 3.8% | 2.3% |
| 2022/23 | 4.5% | 2.5% |
| 2023/24 | 5.2% | 3.0% |
| 2024/25 | 6.0% | 3.5% |
Pupils with an education, health and care plan. Source: Department for Education, Explore Education Statistics, Schools, pupils and their characteristics, 2024/25.
First language other than English
2024/2541.2%
- England
- 23.4%
17.8 percentage points higher than England.
Show the figures as a table
| Year | Islington | England |
|---|---|---|
| 2021/22 | 39.9% | 21.2% |
| 2022/23 | 40.3% | 22.0% |
| 2023/24 | 40.2% | 22.8% |
| 2024/25 | 41.2% | 23.4% |
Pupils whose first language is known or believed to be other than English. Source: Department for Education, Explore Education Statistics, Schools, pupils and their characteristics, 2024/25.
Pupils per qualified teacher
2025/2620.6
- England
- 21.2
0.6 lower than England.
Show the figures as a table
| Year | Islington | England |
|---|---|---|
| 2017/18 | 19.5 | 21.3 |
| 2018/19 | 19.3 | 21.4 |
| 2019/20 | 19.4 | 21.4 |
| 2020/21 | 18.7 | 21.1 |
| 2021/22 | 19.3 | 21.0 |
| 2022/23 | 19.4 | 21.1 |
| 2023/24 | 20.2 | 21.2 |
| 2024/25 | 20.4 | 21.3 |
| 2025/26 | 20.6 | 21.2 |
Full-time equivalent pupils for each full-time equivalent qualified teacher. Source: Department for Education, Explore Education Statistics, School workforce in England, 2025/26.
Secondary schools
Overall absence
2024/259.4%
- England
- 8.4%
1.0 percentage point higher than England.
Show the figures as a table
| Year | Islington | England |
|---|---|---|
| 2017/18 | 5.5% | 5.5% |
| 2018/19 | 5.6% | 5.5% |
| 2020/21 | 6.2% | 5.5% |
| 2021/22 | 8.6% | 9.0% |
| 2022/23 | 9.4% | 9.0% |
| 2023/24 | 9.0% | 8.9% |
| 2024/25 | 9.4% | 8.4% |
Sessions missed for any reason, as a share of all possible sessions in the school year. Source: Department for Education, Explore Education Statistics, Pupil absence in schools in England, 2024/25.
Persistent absence
2024/2526.3%
- England
- 23.4%
2.9 percentage points higher than England.
Show the figures as a table
| Year | Islington | England |
|---|---|---|
| 2017/18 | 13.9% | 13.9% |
| 2018/19 | 14.2% | 13.7% |
| 2020/21 | 18.6% | 14.8% |
| 2021/22 | 26.5% | 27.7% |
| 2022/23 | 29.2% | 26.5% |
| 2023/24 | 26.1% | 25.6% |
| 2024/25 | 26.3% | 23.4% |
Pupils who missed 10% or more of their possible sessions, as a share of pupils. Source: Department for Education, Explore Education Statistics, Pupil absence in schools in England, 2024/25.
Severe absence
2024/254.3%
- England
- 3.9%
0.4 percentage points higher than England.
Show the figures as a table
| Year | Islington | England |
|---|---|---|
| 2017/18 | 0.8% | 1.2% |
| 2018/19 | 1.0% | 1.3% |
| 2020/21 | 1.2% | 1.5% |
| 2021/22 | 2.3% | 2.7% |
| 2022/23 | 2.7% | 3.4% |
| 2023/24 | 3.5% | 3.8% |
| 2024/25 | 4.3% | 3.9% |
Pupils who missed 50% or more of their possible sessions, as a share of pupils. Source: Department for Education, Explore Education Statistics, Pupil absence in schools in England, 2024/25.
Suspensions per 100 pupils
2024/2524.77
- England
- 21.24
3.53 higher than England.
Show the figures as a table
| Year | Islington | England |
|---|---|---|
| 2017/18 | 16.46 | 10.13 |
| 2018/19 | 19.19 | 10.75 |
| 2019/20 | 13.26 | 7.43 |
| 2020/21 | 14.95 | 8.48 |
| 2021/22 | 21.84 | 13.96 |
| 2022/23 | 16.83 | 18.90 |
| 2023/24 | 20.63 | 22.61 |
| 2024/25 | 24.77 | 21.24 |
Suspensions in the school year for every 100 pupils on roll. One pupil can be suspended more than once. Source: Department for Education, Explore Education Statistics, Suspensions and permanent exclusions in England, 2024/25.
Permanent exclusions per 100 pupils
2024/250.08
- England
- 0.23
0.15 lower than England.
Show the figures as a table
| Year | Islington | England |
|---|---|---|
| 2017/18 | 0.23 | 0.20 |
| 2018/19 | 0.23 | 0.20 |
| 2019/20 | 0.12 | 0.13 |
| 2020/21 | 0.01 | 0.10 |
| 2021/22 | 0.08 | 0.16 |
| 2022/23 | 0.11 | 0.22 |
| 2023/24 | 0.16 | 0.25 |
| 2024/25 | 0.08 | 0.23 |
Permanent exclusions in the school year for every 100 pupils on roll. Source: Department for Education, Explore Education Statistics, Suspensions and permanent exclusions in England, 2024/25.
Attainment 8
2025/26 (provisional)49.7
- England
- 47.4
2.3 higher than England.
Show the figures as a table
| Year | Islington | England |
|---|---|---|
| 2021/22 | 51.4 | 49.8 |
| 2022/23 | 48.4 | 47.2 |
| 2023/24 | 49.7 | 46.9 |
| 2024/25 | 48.7 | 47.1 |
| 2025/26 (provisional) | 49.7 | 47.4 |
The average of pupils' points across eight GCSE-level qualifications, with English and maths counted twice. Source: Department for Education, Explore Education Statistics, Key stage 4 performance, 2025/26.
English and maths: grade 4 or above
2025/26 (provisional)70%
- England
- 66%
4 percentage points higher than England.
Show the figures as a table
| Year | Islington | England |
|---|---|---|
| 2021/22 | 73% | 70% |
| 2022/23 | 68% | 67% |
| 2023/24 | 69% | 67% |
| 2024/25 | 67% | 66% |
| 2025/26 (provisional) | 70% | 66% |
Pupils at the end of key stage 4 with grade 4 or above in both English and maths. Source: Department for Education, Explore Education Statistics, Key stage 4 performance, 2025/26.
English and maths: grade 5 or above
2025/26 (provisional)51%
- England
- 48%
3 percentage points higher than England.
Show the figures as a table
| Year | Islington | England |
|---|---|---|
| 2021/22 | 54% | 51% |
| 2022/23 | 49% | 46% |
| 2023/24 | 53% | 47% |
| 2024/25 | 50% | 47% |
| 2025/26 (provisional) | 51% | 48% |
Pupils at the end of key stage 4 with grade 5 or above in both English and maths. Source: Department for Education, Explore Education Statistics, Key stage 4 performance, 2025/26.
Eligible for free school meals
2024/2547.7%
- England
- 25.8%
21.9 percentage points higher than England.
Show the figures as a table
| Year | Islington | England |
|---|---|---|
| 2021/22 | 41.3% | 20.9% |
| 2022/23 | 44.2% | 22.7% |
| 2023/24 | 45.5% | 24.1% |
| 2024/25 | 47.7% | 25.8% |
Pupils known to be eligible for free school meals on census day in January. Source: Department for Education, Explore Education Statistics, Schools, pupils and their characteristics, 2024/25.
SEN support
2024/2516.8%
- England
- 13.4%
3.4 percentage points higher than England.
Show the figures as a table
| Year | Islington | England |
|---|---|---|
| 2021/22 | 15.5% | 11.9% |
| 2022/23 | 16.4% | 12.4% |
| 2023/24 | 16.8% | 12.9% |
| 2024/25 | 16.8% | 13.4% |
Pupils receiving special educational needs support without an education, health and care plan. Source: Department for Education, Explore Education Statistics, Schools, pupils and their characteristics, 2024/25.
Education, health and care plan
2024/253.6%
- England
- 3.1%
0.5 percentage points higher than England.
Show the figures as a table
| Year | Islington | England |
|---|---|---|
| 2021/22 | 2.8% | 2.2% |
| 2022/23 | 3.1% | 2.4% |
| 2023/24 | 3.5% | 2.7% |
| 2024/25 | 3.6% | 3.1% |
Pupils with an education, health and care plan. Source: Department for Education, Explore Education Statistics, Schools, pupils and their characteristics, 2024/25.
First language other than English
2024/2534.0%
- England
- 19.2%
14.8 percentage points higher than England.
Show the figures as a table
| Year | Islington | England |
|---|---|---|
| 2021/22 | 35.4% | 17.5% |
| 2022/23 | 34.5% | 18.1% |
| 2023/24 | 33.9% | 18.6% |
| 2024/25 | 34.0% | 19.2% |
Pupils whose first language is known or believed to be other than English. Source: Department for Education, Explore Education Statistics, Schools, pupils and their characteristics, 2024/25.
Pupils per qualified teacher
2025/2615.3
- England
- 17.3
2.0 lower than England.
Show the figures as a table
| Year | Islington | England |
|---|---|---|
| 2017/18 | 14.2 | 16.5 |
| 2018/19 | 14.2 | 16.8 |
| 2019/20 | 14.9 | 17.2 |
| 2020/21 | 14.9 | 17.1 |
| 2021/22 | 15.3 | 17.1 |
| 2022/23 | 15.2 | 17.2 |
| 2023/24 | 15.3 | 17.4 |
| 2024/25 | 16.0 | 17.3 |
| 2025/26 | 15.3 | 17.3 |
Full-time equivalent pupils for each full-time equivalent qualified teacher. Source: Department for Education, Explore Education Statistics, School workforce in England, 2025/26.
Special schools
Overall absence
2024/2514.3%
- England
- 12.8%
1.5 percentage points higher than England.
Show the figures as a table
| Year | Islington | England |
|---|---|---|
| 2017/18 | 8.7% | 10.2% |
| 2018/19 | 8.5% | 10.1% |
| 2020/21 | 17.7% | 15.2% |
| 2021/22 | 12.6% | 13.2% |
| 2022/23 | 13.4% | 13.0% |
| 2023/24 | 13.6% | 13.0% |
| 2024/25 | 14.3% | 12.8% |
Sessions missed for any reason, as a share of all possible sessions in the school year. Source: Department for Education, Explore Education Statistics, Pupil absence in schools in England, 2024/25.
Persistent absence
2024/2541.8%
- England
- 35.3%
6.5 percentage points higher than England.
Show the figures as a table
| Year | Islington | England |
|---|---|---|
| 2017/18 | 29.1% | 29.6% |
| 2018/19 | 25.7% | 28.8% |
| 2020/21 | 55.7% | 48.9% |
| 2021/22 | 43.3% | 40.4% |
| 2022/23 | 44.2% | 38.3% |
| 2023/24 | 42.1% | 37.2% |
| 2024/25 | 41.8% | 35.3% |
Pupils who missed 10% or more of their possible sessions, as a share of pupils. Source: Department for Education, Explore Education Statistics, Pupil absence in schools in England, 2024/25.
Severe absence
2024/256.3%
- England
- 6.9%
0.6 percentage points lower than England.
Show the figures as a table
| Year | Islington | England |
|---|---|---|
| 2017/18 | 2.6% | 4.4% |
| 2018/19 | 2.3% | 4.6% |
| 2020/21 | 5.5% | 5.6% |
| 2021/22 | 4.0% | 5.8% |
| 2022/23 | 5.9% | 6.2% |
| 2023/24 | 6.0% | 6.7% |
| 2024/25 | 6.3% | 6.9% |
Pupils who missed 50% or more of their possible sessions, as a share of pupils. Source: Department for Education, Explore Education Statistics, Pupil absence in schools in England, 2024/25.
Suspensions per 100 pupils
2024/250.32
- England
- 12.32
12.00 lower than England.
Show the figures as a table
| Year | Islington | England |
|---|---|---|
| 2017/18 | 2.83 | 12.34 |
| 2018/19 | 3.69 | 11.32 |
| 2019/20 | 1.97 | 7.76 |
| 2020/21 | 0.00 | 7.29 |
| 2021/22 | 0.18 | 9.60 |
| 2022/23 | 0.35 | 10.99 |
| 2023/24 | 0.49 | 12.62 |
| 2024/25 | 0.32 | 12.32 |
Suspensions in the school year for every 100 pupils on roll. One pupil can be suspended more than once. Source: Department for Education, Explore Education Statistics, Suspensions and permanent exclusions in England, 2024/25.
Permanent exclusions per 100 pupils
2024/250.00
- England
- 0.08
0.08 lower than England.
Show the figures as a table
| Year | Islington | England |
|---|---|---|
| 2017/18 | 0.00 | 0.07 |
| 2018/19 | 0.00 | 0.06 |
| 2019/20 | 0.00 | 0.04 |
| 2020/21 | 0.00 | 0.03 |
| 2021/22 | 0.00 | 0.05 |
| 2022/23 | 0.00 | 0.08 |
| 2023/24 | 0.00 | 0.08 |
| 2024/25 | 0.00 | 0.08 |
Permanent exclusions in the school year for every 100 pupils on roll. Source: Department for Education, Explore Education Statistics, Suspensions and permanent exclusions in England, 2024/25.
Eligible for free school meals
2024/2564.4%
- England
- 48.8%
15.6 percentage points higher than England.
Show the figures as a table
| Year | Islington | England |
|---|---|---|
| 2021/22 | 62.7% | 44.4% |
| 2022/23 | 61.5% | 45.6% |
| 2023/24 | 61.2% | 47.1% |
| 2024/25 | 64.4% | 48.8% |
Pupils known to be eligible for free school meals on census day in January. Source: Department for Education, Explore Education Statistics, Schools, pupils and their characteristics, 2024/25.
SEN support
2024/250.0%
- England
- 0.5%
0.5 percentage points lower than England.
Show the figures as a table
| Year | Islington | England |
|---|---|---|
| 2021/22 | 1.3% | 0.9% |
| 2022/23 | 1.9% | 0.8% |
| 2023/24 | 1.8% | 0.7% |
| 2024/25 | 0.0% | 0.5% |
Pupils receiving special educational needs support without an education, health and care plan. Source: Department for Education, Explore Education Statistics, Schools, pupils and their characteristics, 2024/25.
Education, health and care plan
2024/25100.0%
- England
- 99.5%
0.5 percentage points higher than England.
Show the figures as a table
| Year | Islington | England |
|---|---|---|
| 2021/22 | 98.7% | 99.1% |
| 2022/23 | 98.1% | 99.2% |
| 2023/24 | 98.2% | 99.3% |
| 2024/25 | 100.0% | 99.5% |
Pupils with an education, health and care plan. Source: Department for Education, Explore Education Statistics, Schools, pupils and their characteristics, 2024/25.
First language other than English
2024/2534.5%
- England
- 14.4%
20.1 percentage points higher than England.
Show the figures as a table
| Year | Islington | England |
|---|---|---|
| 2021/22 | 35.8% | 14.5% |
| 2022/23 | 35.7% | 14.4% |
| 2023/24 | 35.6% | 14.4% |
| 2024/25 | 34.5% | 14.4% |
Pupils whose first language is known or believed to be other than English. Source: Department for Education, Explore Education Statistics, Schools, pupils and their characteristics, 2024/25.
Pupils per qualified teacher
2025/266.6
- England
- 7.3
0.7 lower than England.
Show the figures as a table
| Year | Islington | England |
|---|---|---|
| 2017/18 | 5.0 | 6.7 |
| 2018/19 | 5.0 | 6.8 |
| 2019/20 | 5.1 | 7.0 |
| 2020/21 | 5.3 | 6.8 |
| 2021/22 | 5.3 | 6.9 |
| 2022/23 | 5.3 | 7.0 |
| 2023/24 | 5.5 | 7.1 |
| 2024/25 | 6.2 | 7.3 |
| 2025/26 | 6.6 | 7.3 |
Full-time equivalent pupils for each full-time equivalent qualified teacher. Source: Department for Education, Explore Education Statistics, School workforce in England, 2025/26.
Schools in Islington
Listed by name. Filter by phase or type; sort by name or size. Nothing here is sorted by results.
Showing 63 of 63 schools in Islington.