Ealing
94 state-funded schools with 50,834 pupils on roll, in the London region. Every school’s page has its published figures against Ealing and England.
- Primary
- 65
- Secondary
- 16
- All-through
- 1
- Special
- 6
- Alternative provision
- 2
- Nursery
- 4
- Maintained
- 63
- Academies
- 19
- Free schools
- 6
- Maintained special
- 6
Map
Zoom in to see each school. Open the full map
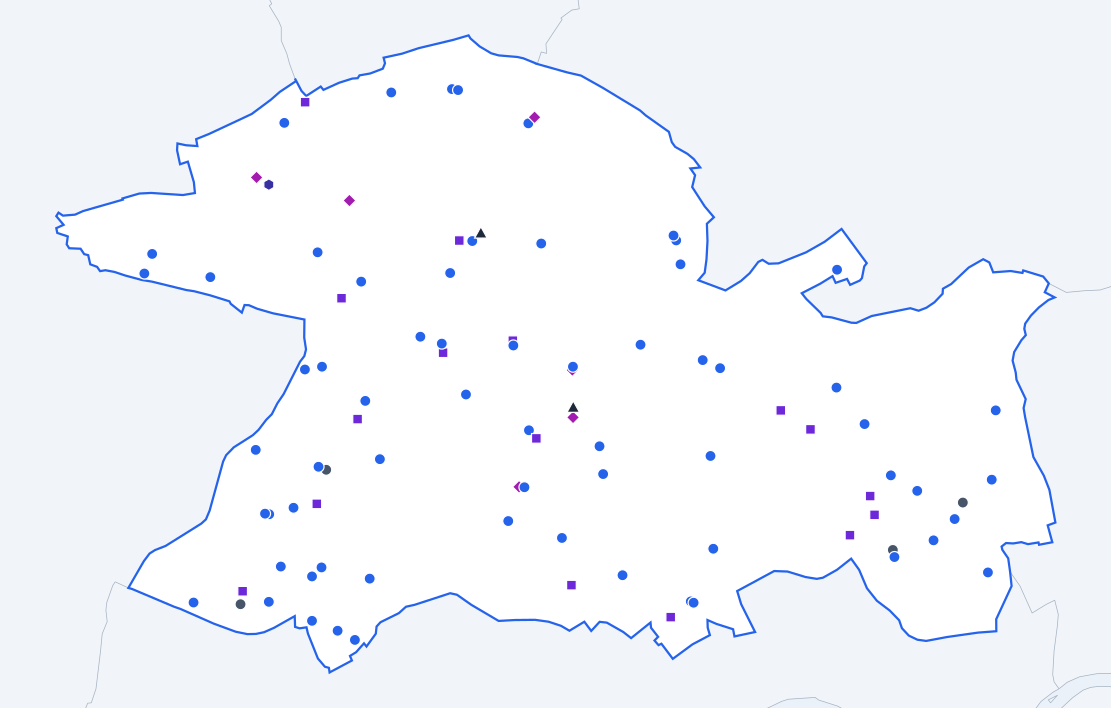
ONS, OS © Crown copyright 2025 · GIAS · © OpenStreetMap
Ealing against England
Published figures for the authority’s schools, set against the same kind of school across England.
All state-funded schools
Overall absence
2024/256.5%
- England
- 6.8%
0.3 percentage points lower than England.
Show the figures as a table
| Year | Ealing | England |
|---|---|---|
| 2017/18 | 4.4% | 4.8% |
| 2018/19 | 4.4% | 4.7% |
| 2020/21 | 4.5% | 4.6% |
| 2021/22 | 6.5% | 7.6% |
| 2022/23 | 6.8% | 7.4% |
| 2023/24 | 6.1% | 7.1% |
| 2024/25 | 6.5% | 6.8% |
Sessions missed for any reason, as a share of all possible sessions in the school year. Source: Department for Education, Explore Education Statistics, Pupil absence in schools in England, 2024/25.
Persistent absence
2024/2518.2%
- England
- 18.1%
0.1 percentage points higher than England.
Show the figures as a table
| Year | Ealing | England |
|---|---|---|
| 2017/18 | 9.2% | 11.2% |
| 2018/19 | 9.9% | 10.9% |
| 2020/21 | 11.6% | 12.1% |
| 2021/22 | 18.9% | 22.5% |
| 2022/23 | 20.2% | 21.2% |
| 2023/24 | 17.0% | 20.0% |
| 2024/25 | 18.2% | 18.1% |
Pupils who missed 10% or more of their possible sessions, as a share of pupils. Source: Department for Education, Explore Education Statistics, Pupil absence in schools in England, 2024/25.
Severe absence
2024/251.8%
- England
- 2.4%
0.6 percentage points lower than England.
Show the figures as a table
| Year | Ealing | England |
|---|---|---|
| 2017/18 | 0.4% | 0.8% |
| 2018/19 | 0.4% | 0.8% |
| 2020/21 | 1.0% | 1.1% |
| 2021/22 | 1.1% | 1.7% |
| 2022/23 | 1.3% | 2.0% |
| 2023/24 | 1.6% | 2.3% |
| 2024/25 | 1.8% | 2.4% |
Pupils who missed 50% or more of their possible sessions, as a share of pupils. Source: Department for Education, Explore Education Statistics, Pupil absence in schools in England, 2024/25.
Suspensions per 100 pupils
2024/253.93
- England
- 10.88
6.95 lower than England.
Show the figures as a table
| Year | Ealing | England |
|---|---|---|
| 2017/18 | 2.57 | 5.08 |
| 2018/19 | 3.47 | 5.36 |
| 2019/20 | 2.37 | 3.76 |
| 2020/21 | 2.00 | 4.25 |
| 2021/22 | 3.10 | 6.91 |
| 2022/23 | 4.25 | 9.33 |
| 2023/24 | 4.10 | 11.31 |
| 2024/25 | 3.93 | 10.88 |
Suspensions in the school year for every 100 pupils on roll. One pupil can be suspended more than once. Source: Department for Education, Explore Education Statistics, Suspensions and permanent exclusions in England, 2024/25.
Permanent exclusions per 100 pupils
2024/250.08
- England
- 0.12
0.04 lower than England.
Show the figures as a table
| Year | Ealing | England |
|---|---|---|
| 2017/18 | 0.11 | 0.10 |
| 2018/19 | 0.11 | 0.10 |
| 2019/20 | 0.03 | 0.06 |
| 2020/21 | 0.04 | 0.05 |
| 2021/22 | 0.07 | 0.08 |
| 2022/23 | 0.10 | 0.11 |
| 2023/24 | 0.11 | 0.13 |
| 2024/25 | 0.08 | 0.12 |
Permanent exclusions in the school year for every 100 pupils on roll. Source: Department for Education, Explore Education Statistics, Suspensions and permanent exclusions in England, 2024/25.
Eligible for free school meals
2024/2527.6%
- England
- 25.7%
1.9 percentage points higher than England.
Show the figures as a table
| Year | Ealing | England |
|---|---|---|
| 2021/22 | 23.6% | 22.5% |
| 2022/23 | 25.1% | 23.8% |
| 2023/24 | 26.4% | 24.6% |
| 2024/25 | 27.6% | 25.7% |
Pupils known to be eligible for free school meals on census day in January. Source: Department for Education, Explore Education Statistics, Schools, pupils and their characteristics, 2024/25.
SEN support
2024/2511.0%
- England
- 14.0%
3.0 percentage points lower than England.
Show the figures as a table
| Year | Ealing | England |
|---|---|---|
| 2021/22 | 10.1% | 12.4% |
| 2022/23 | 10.6% | 12.9% |
| 2023/24 | 10.9% | 13.4% |
| 2024/25 | 11.0% | 14.0% |
Pupils receiving special educational needs support without an education, health and care plan. Source: Department for Education, Explore Education Statistics, Schools, pupils and their characteristics, 2024/25.
Education, health and care plan
2024/255.5%
- England
- 5.2%
0.3 percentage points higher than England.
Show the figures as a table
| Year | Ealing | England |
|---|---|---|
| 2021/22 | 4.3% | 3.8% |
| 2022/23 | 4.6% | 4.2% |
| 2023/24 | 5.0% | 4.7% |
| 2024/25 | 5.5% | 5.2% |
Pupils with an education, health and care plan. Source: Department for Education, Explore Education Statistics, Schools, pupils and their characteristics, 2024/25.
First language other than English
2024/2558.8%
- England
- 21.4%
37.4 percentage points higher than England.
Show the figures as a table
| Year | Ealing | England |
|---|---|---|
| 2021/22 | 59.5% | 19.6% |
| 2022/23 | 59.6% | 20.2% |
| 2023/24 | 59.3% | 20.8% |
| 2024/25 | 58.8% | 21.4% |
Pupils whose first language is known or believed to be other than English. Source: Department for Education, Explore Education Statistics, Schools, pupils and their characteristics, 2024/25.
Pupils per qualified teacher
2025/2618.6
- England
- 18.5
0.1 higher than England.
Show the figures as a table
| Year | Ealing | England |
|---|---|---|
| 2017/18 | 18.7 | 18.4 |
| 2018/19 | 18.7 | 18.6 |
| 2019/20 | 19.1 | 18.8 |
| 2020/21 | 18.8 | 18.5 |
| 2021/22 | 18.7 | 18.5 |
| 2022/23 | 18.7 | 18.5 |
| 2023/24 | 18.7 | 18.6 |
| 2024/25 | 18.3 | 18.6 |
| 2025/26 | 18.6 | 18.5 |
Full-time equivalent pupils for each full-time equivalent qualified teacher. Source: Department for Education, Explore Education Statistics, School workforce in England, 2025/26.
Teacher sickness absence
2024/254.5 days
- England
- 5.0 days
0.5 days lower than England.
Show the figures as a table
| Year | Ealing | England |
|---|---|---|
| 2017/18 | 3.7 days | 4.0 days |
| 2018/19 | 3.7 days | 4.0 days |
| 2019/20 | Not published | Not published |
| 2020/21 | 3.0 days | 3.9 days |
| 2021/22 | 5.5 days | 6.3 days |
| 2022/23 | 4.3 days | 5.2 days |
| 2023/24 | 4.5 days | 5.3 days |
| 2024/25 | 4.5 days | 5.0 days |
Days lost to sickness absence in the school year, averaged across all teachers. Source: Department for Education, Explore Education Statistics, School workforce in England, 2024/25.
Primary schools
Overall absence
2024/255.4%
- England
- 5.2%
0.2 percentage points higher than England.
Show the figures as a table
| Year | Ealing | England |
|---|---|---|
| 2017/18 | 3.9% | 4.2% |
| 2018/19 | 3.9% | 4.0% |
| 2020/21 | 3.9% | 3.6% |
| 2021/22 | 6.0% | 6.3% |
| 2022/23 | 6.3% | 5.9% |
| 2023/24 | 5.3% | 5.5% |
| 2024/25 | 5.4% | 5.2% |
Sessions missed for any reason, as a share of all possible sessions in the school year. Source: Department for Education, Explore Education Statistics, Pupil absence in schools in England, 2024/25.
Persistent absence
2024/2514.1%
- England
- 13.0%
1.1 percentage points higher than England.
Show the figures as a table
| Year | Ealing | England |
|---|---|---|
| 2017/18 | 7.5% | 8.7% |
| 2018/19 | 7.5% | 8.2% |
| 2020/21 | 9.7% | 8.8% |
| 2021/22 | 17.2% | 17.7% |
| 2022/23 | 18.5% | 16.2% |
| 2023/24 | 14.2% | 14.6% |
| 2024/25 | 14.1% | 13.0% |
Pupils who missed 10% or more of their possible sessions, as a share of pupils. Source: Department for Education, Explore Education Statistics, Pupil absence in schools in England, 2024/25.
Severe absence
2024/251.1%
- England
- 0.9%
0.2 percentage points higher than England.
Show the figures as a table
| Year | Ealing | England |
|---|---|---|
| 2017/18 | 0.2% | 0.4% |
| 2018/19 | 0.2% | 0.4% |
| 2020/21 | 1.1% | 0.7% |
| 2021/22 | 0.9% | 0.6% |
| 2022/23 | 1.0% | 0.7% |
| 2023/24 | 1.2% | 0.9% |
| 2024/25 | 1.1% | 0.9% |
Pupils who missed 50% or more of their possible sessions, as a share of pupils. Source: Department for Education, Explore Education Statistics, Pupil absence in schools in England, 2024/25.
Suspensions per 100 pupils
2024/251.07
- England
- 2.47
1.40 lower than England.
Show the figures as a table
| Year | Ealing | England |
|---|---|---|
| 2017/18 | 0.73 | 1.40 |
| 2018/19 | 0.73 | 1.41 |
| 2019/20 | 0.56 | 1.00 |
| 2020/21 | 0.43 | 0.99 |
| 2021/22 | 0.74 | 1.42 |
| 2022/23 | 0.86 | 1.81 |
| 2023/24 | 0.97 | 2.27 |
| 2024/25 | 1.07 | 2.47 |
Suspensions in the school year for every 100 pupils on roll. One pupil can be suspended more than once. Source: Department for Education, Explore Education Statistics, Suspensions and permanent exclusions in England, 2024/25.
Permanent exclusions per 100 pupils
2024/250.01
- England
- 0.03
0.02 lower than England.
Show the figures as a table
| Year | Ealing | England |
|---|---|---|
| 2017/18 | 0.01 | 0.03 |
| 2018/19 | 0.01 | 0.02 |
| 2019/20 | 0.00 | 0.02 |
| 2020/21 | 0.01 | 0.01 |
| 2021/22 | 0.01 | 0.02 |
| 2022/23 | 0.01 | 0.03 |
| 2023/24 | 0.02 | 0.03 |
| 2024/25 | 0.01 | 0.03 |
Permanent exclusions in the school year for every 100 pupils on roll. Source: Department for Education, Explore Education Statistics, Suspensions and permanent exclusions in England, 2024/25.
Reading, writing and maths: expected standard
2025/26 (provisional)69%
- England
- 63%
6 percentage points higher than England.
Show the figures as a table
| Year | Ealing | England |
|---|---|---|
| 2021/22 | 67% | 59% |
| 2022/23 | 68% | 60% |
| 2023/24 | 70% | 61% |
| 2024/25 | 69% | 63% |
| 2025/26 (provisional) | 69% | 63% |
Pupils at the end of key stage 2 who met the expected standard in reading, writing and maths combined. Source: Department for Education, Explore Education Statistics, Key stage 2 attainment, 2025/26.
Reading, writing and maths: higher standard
2025/26 (provisional)14%
- England
- 9%
5 percentage points higher than England.
Show the figures as a table
| Year | Ealing | England |
|---|---|---|
| 2021/22 | 11% | 7% |
| 2022/23 | 13% | 8% |
| 2023/24 | 11% | 8% |
| 2024/25 | 13% | 8% |
| 2025/26 (provisional) | 14% | 9% |
Pupils at the end of key stage 2 who met the higher standard in reading, writing and maths combined. Source: Department for Education, Explore Education Statistics, Key stage 2 attainment, 2025/26.
Eligible for free school meals
2024/2525.2%
- England
- 24.7%
0.5 percentage points higher than England.
Show the figures as a table
| Year | Ealing | England |
|---|---|---|
| 2021/22 | 23.4% | 23.1% |
| 2022/23 | 24.6% | 24.0% |
| 2023/24 | 25.1% | 24.3% |
| 2024/25 | 25.2% | 24.7% |
Pupils known to be eligible for free school meals on census day in January. Source: Department for Education, Explore Education Statistics, Schools, pupils and their characteristics, 2024/25.
SEN support
2024/2512.4%
- England
- 15.0%
2.6 percentage points lower than England.
Show the figures as a table
| Year | Ealing | England |
|---|---|---|
| 2021/22 | 11.1% | 13.0% |
| 2022/23 | 11.4% | 13.5% |
| 2023/24 | 12.3% | 14.1% |
| 2024/25 | 12.4% | 15.0% |
Pupils receiving special educational needs support without an education, health and care plan. Source: Department for Education, Explore Education Statistics, Schools, pupils and their characteristics, 2024/25.
Education, health and care plan
2024/254.1%
- England
- 3.5%
0.6 percentage points higher than England.
Show the figures as a table
| Year | Ealing | England |
|---|---|---|
| 2021/22 | 2.9% | 2.3% |
| 2022/23 | 3.2% | 2.5% |
| 2023/24 | 3.7% | 3.0% |
| 2024/25 | 4.1% | 3.5% |
Pupils with an education, health and care plan. Source: Department for Education, Explore Education Statistics, Schools, pupils and their characteristics, 2024/25.
First language other than English
2024/2561.7%
- England
- 23.4%
38.3 percentage points higher than England.
Show the figures as a table
| Year | Ealing | England |
|---|---|---|
| 2021/22 | 62.1% | 21.2% |
| 2022/23 | 62.0% | 22.0% |
| 2023/24 | 62.0% | 22.8% |
| 2024/25 | 61.7% | 23.4% |
Pupils whose first language is known or believed to be other than English. Source: Department for Education, Explore Education Statistics, Schools, pupils and their characteristics, 2024/25.
Pupils per qualified teacher
2025/2621.6
- England
- 21.2
0.4 higher than England.
Show the figures as a table
| Year | Ealing | England |
|---|---|---|
| 2017/18 | 22.3 | 21.3 |
| 2018/19 | 21.8 | 21.4 |
| 2019/20 | 22.3 | 21.4 |
| 2020/21 | 21.0 | 21.1 |
| 2021/22 | 20.9 | 21.0 |
| 2022/23 | 21.8 | 21.1 |
| 2023/24 | 21.9 | 21.2 |
| 2024/25 | 21.8 | 21.3 |
| 2025/26 | 21.6 | 21.2 |
Full-time equivalent pupils for each full-time equivalent qualified teacher. Source: Department for Education, Explore Education Statistics, School workforce in England, 2025/26.
Secondary schools
Overall absence
2024/257.8%
- England
- 8.4%
0.6 percentage points lower than England.
Show the figures as a table
| Year | Ealing | England |
|---|---|---|
| 2017/18 | 5.0% | 5.5% |
| 2018/19 | 5.1% | 5.5% |
| 2020/21 | 5.1% | 5.5% |
| 2021/22 | 6.9% | 9.0% |
| 2022/23 | 7.4% | 9.0% |
| 2023/24 | 7.1% | 8.9% |
| 2024/25 | 7.8% | 8.4% |
Sessions missed for any reason, as a share of all possible sessions in the school year. Source: Department for Education, Explore Education Statistics, Pupil absence in schools in England, 2024/25.
Persistent absence
2024/2522.8%
- England
- 23.4%
0.6 percentage points lower than England.
Show the figures as a table
| Year | Ealing | England |
|---|---|---|
| 2017/18 | 11.3% | 13.9% |
| 2018/19 | 12.8% | 13.7% |
| 2020/21 | 13.3% | 14.8% |
| 2021/22 | 20.2% | 27.7% |
| 2022/23 | 21.5% | 26.5% |
| 2023/24 | 19.9% | 25.6% |
| 2024/25 | 22.8% | 23.4% |
Pupils who missed 10% or more of their possible sessions, as a share of pupils. Source: Department for Education, Explore Education Statistics, Pupil absence in schools in England, 2024/25.
Severe absence
2024/252.6%
- England
- 3.9%
1.3 percentage points lower than England.
Show the figures as a table
| Year | Ealing | England |
|---|---|---|
| 2017/18 | 0.6% | 1.2% |
| 2018/19 | 0.6% | 1.3% |
| 2020/21 | 1.0% | 1.5% |
| 2021/22 | 1.2% | 2.7% |
| 2022/23 | 1.7% | 3.4% |
| 2023/24 | 2.0% | 3.8% |
| 2024/25 | 2.6% | 3.9% |
Pupils who missed 50% or more of their possible sessions, as a share of pupils. Source: Department for Education, Explore Education Statistics, Pupil absence in schools in England, 2024/25.
Suspensions per 100 pupils
2024/257.67
- England
- 21.24
13.57 lower than England.
Show the figures as a table
| Year | Ealing | England |
|---|---|---|
| 2017/18 | 5.81 | 10.13 |
| 2018/19 | 8.09 | 10.75 |
| 2019/20 | 5.24 | 7.43 |
| 2020/21 | 4.31 | 8.48 |
| 2021/22 | 6.39 | 13.96 |
| 2022/23 | 8.79 | 18.90 |
| 2023/24 | 8.19 | 22.61 |
| 2024/25 | 7.67 | 21.24 |
Suspensions in the school year for every 100 pupils on roll. One pupil can be suspended more than once. Source: Department for Education, Explore Education Statistics, Suspensions and permanent exclusions in England, 2024/25.
Permanent exclusions per 100 pupils
2024/250.17
- England
- 0.23
0.06 lower than England.
Show the figures as a table
| Year | Ealing | England |
|---|---|---|
| 2017/18 | 0.28 | 0.20 |
| 2018/19 | 0.27 | 0.20 |
| 2019/20 | 0.08 | 0.13 |
| 2020/21 | 0.08 | 0.10 |
| 2021/22 | 0.16 | 0.16 |
| 2022/23 | 0.22 | 0.22 |
| 2023/24 | 0.22 | 0.25 |
| 2024/25 | 0.17 | 0.23 |
Permanent exclusions in the school year for every 100 pupils on roll. Source: Department for Education, Explore Education Statistics, Suspensions and permanent exclusions in England, 2024/25.
Attainment 8
2025/26 (provisional)53.1
- England
- 47.4
5.7 higher than England.
Show the figures as a table
| Year | Ealing | England |
|---|---|---|
| 2021/22 | 54.6 | 49.8 |
| 2022/23 | 53.3 | 47.2 |
| 2023/24 | 53.0 | 46.9 |
| 2024/25 | 53.1 | 47.1 |
| 2025/26 (provisional) | 53.1 | 47.4 |
The average of pupils' points across eight GCSE-level qualifications, with English and maths counted twice. Source: Department for Education, Explore Education Statistics, Key stage 4 performance, 2025/26.
English and maths: grade 4 or above
2025/26 (provisional)75%
- England
- 66%
9 percentage points higher than England.
Show the figures as a table
| Year | Ealing | England |
|---|---|---|
| 2021/22 | 78% | 70% |
| 2022/23 | 76% | 67% |
| 2023/24 | 75% | 67% |
| 2024/25 | 74% | 66% |
| 2025/26 (provisional) | 75% | 66% |
Pupils at the end of key stage 4 with grade 4 or above in both English and maths. Source: Department for Education, Explore Education Statistics, Key stage 4 performance, 2025/26.
English and maths: grade 5 or above
2025/26 (provisional)58%
- England
- 48%
10 percentage points higher than England.
Show the figures as a table
| Year | Ealing | England |
|---|---|---|
| 2021/22 | 62% | 51% |
| 2022/23 | 58% | 46% |
| 2023/24 | 59% | 47% |
| 2024/25 | 58% | 47% |
| 2025/26 (provisional) | 58% | 48% |
Pupils at the end of key stage 4 with grade 5 or above in both English and maths. Source: Department for Education, Explore Education Statistics, Key stage 4 performance, 2025/26.
Eligible for free school meals
2024/2530.1%
- England
- 25.8%
4.3 percentage points higher than England.
Show the figures as a table
| Year | Ealing | England |
|---|---|---|
| 2021/22 | 23.6% | 20.9% |
| 2022/23 | 25.5% | 22.7% |
| 2023/24 | 27.7% | 24.1% |
| 2024/25 | 30.1% | 25.8% |
Pupils known to be eligible for free school meals on census day in January. Source: Department for Education, Explore Education Statistics, Schools, pupils and their characteristics, 2024/25.
SEN support
2024/259.2%
- England
- 13.4%
4.2 percentage points lower than England.
Show the figures as a table
| Year | Ealing | England |
|---|---|---|
| 2021/22 | 8.9% | 11.9% |
| 2022/23 | 9.3% | 12.4% |
| 2023/24 | 9.0% | 12.9% |
| 2024/25 | 9.2% | 13.4% |
Pupils receiving special educational needs support without an education, health and care plan. Source: Department for Education, Explore Education Statistics, Schools, pupils and their characteristics, 2024/25.
Education, health and care plan
2024/253.1%
- England
- 3.1%
The same as England.
Show the figures as a table
| Year | Ealing | England |
|---|---|---|
| 2021/22 | 2.3% | 2.2% |
| 2022/23 | 2.6% | 2.4% |
| 2023/24 | 2.8% | 2.7% |
| 2024/25 | 3.1% | 3.1% |
Pupils with an education, health and care plan. Source: Department for Education, Explore Education Statistics, Schools, pupils and their characteristics, 2024/25.
First language other than English
2024/2555.2%
- England
- 19.2%
36.0 percentage points higher than England.
Show the figures as a table
| Year | Ealing | England |
|---|---|---|
| 2021/22 | 56.0% | 17.5% |
| 2022/23 | 56.5% | 18.1% |
| 2023/24 | 56.0% | 18.6% |
| 2024/25 | 55.2% | 19.2% |
Pupils whose first language is known or believed to be other than English. Source: Department for Education, Explore Education Statistics, Schools, pupils and their characteristics, 2024/25.
Pupils per qualified teacher
2025/2617.1
- England
- 17.3
0.2 lower than England.
Show the figures as a table
| Year | Ealing | England |
|---|---|---|
| 2017/18 | 16.1 | 16.5 |
| 2018/19 | 16.5 | 16.8 |
| 2019/20 | 17.0 | 17.2 |
| 2020/21 | 17.7 | 17.1 |
| 2021/22 | 17.8 | 17.1 |
| 2022/23 | 17.1 | 17.2 |
| 2023/24 | 16.9 | 17.4 |
| 2024/25 | 16.3 | 17.3 |
| 2025/26 | 17.1 | 17.3 |
Full-time equivalent pupils for each full-time equivalent qualified teacher. Source: Department for Education, Explore Education Statistics, School workforce in England, 2025/26.
Special schools
Overall absence
2024/2510.6%
- England
- 12.8%
2.2 percentage points lower than England.
Show the figures as a table
| Year | Ealing | England |
|---|---|---|
| 2017/18 | 9.3% | 10.2% |
| 2018/19 | 9.3% | 10.1% |
| 2020/21 | 11.1% | 15.2% |
| 2021/22 | 12.0% | 13.2% |
| 2022/23 | 11.7% | 13.0% |
| 2023/24 | 10.6% | 13.0% |
| 2024/25 | 10.6% | 12.8% |
Sessions missed for any reason, as a share of all possible sessions in the school year. Source: Department for Education, Explore Education Statistics, Pupil absence in schools in England, 2024/25.
Persistent absence
2024/2533.4%
- England
- 35.3%
1.9 percentage points lower than England.
Show the figures as a table
| Year | Ealing | England |
|---|---|---|
| 2017/18 | 29.8% | 29.6% |
| 2018/19 | 31.4% | 28.8% |
| 2020/21 | 38.7% | 48.9% |
| 2021/22 | 44.7% | 40.4% |
| 2022/23 | 42.2% | 38.3% |
| 2023/24 | 34.5% | 37.2% |
| 2024/25 | 33.4% | 35.3% |
Pupils who missed 10% or more of their possible sessions, as a share of pupils. Source: Department for Education, Explore Education Statistics, Pupil absence in schools in England, 2024/25.
Severe absence
2024/253.2%
- England
- 6.9%
3.7 percentage points lower than England.
Show the figures as a table
| Year | Ealing | England |
|---|---|---|
| 2017/18 | 2.4% | 4.4% |
| 2018/19 | 2.5% | 4.6% |
| 2020/21 | 1.5% | 5.6% |
| 2021/22 | 2.8% | 5.8% |
| 2022/23 | 2.1% | 6.2% |
| 2023/24 | 3.5% | 6.7% |
| 2024/25 | 3.2% | 6.9% |
Pupils who missed 50% or more of their possible sessions, as a share of pupils. Source: Department for Education, Explore Education Statistics, Pupil absence in schools in England, 2024/25.
Suspensions per 100 pupils
2024/250.76
- England
- 12.32
11.56 lower than England.
Show the figures as a table
| Year | Ealing | England |
|---|---|---|
| 2017/18 | 0.13 | 12.34 |
| 2018/19 | 0.50 | 11.32 |
| 2019/20 | 0.95 | 7.76 |
| 2020/21 | 0.33 | 7.29 |
| 2021/22 | 0.86 | 9.60 |
| 2022/23 | 2.42 | 10.99 |
| 2023/24 | 2.59 | 12.62 |
| 2024/25 | 0.76 | 12.32 |
Suspensions in the school year for every 100 pupils on roll. One pupil can be suspended more than once. Source: Department for Education, Explore Education Statistics, Suspensions and permanent exclusions in England, 2024/25.
Permanent exclusions per 100 pupils
2024/250.00
- England
- 0.08
0.08 lower than England.
Show the figures as a table
| Year | Ealing | England |
|---|---|---|
| 2017/18 | 0.00 | 0.07 |
| 2018/19 | 0.00 | 0.06 |
| 2019/20 | 0.00 | 0.04 |
| 2020/21 | 0.00 | 0.03 |
| 2021/22 | 0.00 | 0.05 |
| 2022/23 | 0.00 | 0.08 |
| 2023/24 | 0.20 | 0.08 |
| 2024/25 | 0.00 | 0.08 |
Permanent exclusions in the school year for every 100 pupils on roll. Source: Department for Education, Explore Education Statistics, Suspensions and permanent exclusions in England, 2024/25.
Eligible for free school meals
2024/2548.4%
- England
- 48.8%
0.4 percentage points lower than England.
Show the figures as a table
| Year | Ealing | England |
|---|---|---|
| 2021/22 | 43.8% | 44.4% |
| 2022/23 | 44.9% | 45.6% |
| 2023/24 | 47.3% | 47.1% |
| 2024/25 | 48.4% | 48.8% |
Pupils known to be eligible for free school meals on census day in January. Source: Department for Education, Explore Education Statistics, Schools, pupils and their characteristics, 2024/25.
SEN support
2024/251.7%
- England
- 0.5%
1.2 percentage points higher than England.
Show the figures as a table
| Year | Ealing | England |
|---|---|---|
| 2021/22 | 1.5% | 0.9% |
| 2022/23 | 1.5% | 0.8% |
| 2023/24 | 1.4% | 0.7% |
| 2024/25 | 1.7% | 0.5% |
Pupils receiving special educational needs support without an education, health and care plan. Source: Department for Education, Explore Education Statistics, Schools, pupils and their characteristics, 2024/25.
Education, health and care plan
2024/2598.3%
- England
- 99.5%
1.2 percentage points lower than England.
Show the figures as a table
| Year | Ealing | England |
|---|---|---|
| 2021/22 | 98.5% | 99.1% |
| 2022/23 | 98.5% | 99.2% |
| 2023/24 | 98.6% | 99.3% |
| 2024/25 | 98.3% | 99.5% |
Pupils with an education, health and care plan. Source: Department for Education, Explore Education Statistics, Schools, pupils and their characteristics, 2024/25.
First language other than English
2024/2554.1%
- England
- 14.4%
39.7 percentage points higher than England.
Show the figures as a table
| Year | Ealing | England |
|---|---|---|
| 2021/22 | 55.6% | 14.5% |
| 2022/23 | 53.7% | 14.4% |
| 2023/24 | 53.6% | 14.4% |
| 2024/25 | 54.1% | 14.4% |
Pupils whose first language is known or believed to be other than English. Source: Department for Education, Explore Education Statistics, Schools, pupils and their characteristics, 2024/25.
Pupils per qualified teacher
2025/266.9
- England
- 7.3
0.4 lower than England.
Show the figures as a table
| Year | Ealing | England |
|---|---|---|
| 2017/18 | 5.8 | 6.7 |
| 2018/19 | 5.9 | 6.8 |
| 2019/20 | 6.4 | 7.0 |
| 2020/21 | 6.5 | 6.8 |
| 2021/22 | 6.2 | 6.9 |
| 2022/23 | 6.3 | 7.0 |
| 2023/24 | 7.0 | 7.1 |
| 2024/25 | 6.9 | 7.3 |
| 2025/26 | 6.9 | 7.3 |
Full-time equivalent pupils for each full-time equivalent qualified teacher. Source: Department for Education, Explore Education Statistics, School workforce in England, 2025/26.
Schools in Ealing
Listed by name. Filter by phase or type; sort by name or size. Nothing here is sorted by results.
Showing 94 of 94 schools in Ealing.
| School | Phase | Type | Town | Pupils |
|---|---|---|---|---|
| Acton Gardens Primary School | Primary | Maintained | London | 349 |
| Ada Lovelace Church of England High School | Secondary | Free school | London | 1,089 |
| Alec Reed Academy | All-through | Academy | Northolt | 1,639 |
| Allenby Primary School | Primary | Maintained | Southall | 253 |
| Ark Acton Academy | Secondary | Academy | London | 752 |
| Ark Byron Primary Academy | Primary | Free school | London | 412 |
| Ark Priory Primary Academy | Primary | Academy | London | 439 |
| Ark Soane Academy | Secondary | Free school | London | 874 |
| Beaconsfield Primary and Nursery School | Primary | Maintained | Southall | 437 |
| Belvue School | Special | Maintained special | Northolt | 228 |
| Blair Peach Primary School | Primary | Maintained | Southall | 368 |
| Brentside High School | Secondary | Maintained | London | 1,483 |
| Brentside Primary School | Primary | Academy | London | 382 |
| Castlebar School | Special | Maintained special | London | 193 |
| Christ the Saviour Church of England Primary School | Primary | Maintained | London | 892 |
| Clifton Primary School | Primary | Maintained | Southall | 417 |
| Coston Primary School | Primary | Maintained | Greenford | 432 |
| Dairy Meadow Primary School | Primary | Maintained | Southall | 337 |
| Derwentwater Primary School | Primary | Maintained | London | 431 |
| Dormers Wells High School | Secondary | Academy | Southall | 1,469 |
| Dormers Wells Primary School | Primary | Academy | Southall | 418 |
| Downe Manor Primary School | Primary | Maintained | Northolt | 237 |
| Drayton Green Primary School | Primary | Maintained | London | 236 |
| Drayton Manor High School | Secondary | Academy | London | 1,443 |
| Durdans Park Primary School | Primary | Maintained | Southall | 417 |
| Ealing Alternative Provision | Alternative provision | Maintained | London | 56 |
| Ealing Fields Church of England High School | Secondary | Free school | London | 803 |
| Ealing Primary Centre | Alternative provision | Maintained | London | 5 |
| East Acton Primary School | Primary | Maintained | London | 202 |
| Elthorne Park High School | Secondary | Maintained | London | 1,603 |
| Featherstone High School | Secondary | Academy | Southall | 1,748 |
| Featherstone Primary and Nursery School | Primary | Maintained | Southall | 673 |
| Fielding Primary School | Primary | Maintained | London | 1,012 |
| Gifford Primary School | Primary | Maintained | Northolt | 917 |
| Grange Primary School | Primary | Maintained | London | 641 |
| Greenfields Nursery School and Children's Centre | Nursery | Maintained | Southall | 122 |
| Greenford High School | Secondary | Maintained | Southall | 1,976 |
| Greenwood Primary School | Primary | Maintained | Northolt | 613 |
| Grove House Nursery School & Children's Centre | Nursery | Maintained | Southall | 135 |
| Hambrough Primary School | Primary | Maintained | Middlesex | 440 |
| Havelock Primary School, Nursery & Arp | Primary | Maintained | Southall | 419 |
| Hobbayne Primary School | Primary | Maintained | London | 320 |
| Holy Family Catholic Primary School | Primary | Maintained | London | 453 |
| Horsenden Primary School | Primary | Maintained | Greenford | 655 |
| Islip Manor High School | Secondary | Maintained | Northolt | 772 |
| John Chilton School | Special | Maintained special | Northolt | 159 |
| John Perryn Primary School | Primary | Maintained | London | 414 |
| Khalsa Primary School | Primary | Maintained | Southall | 413 |
| Lady Margaret Primary School | Primary | Maintained | Southall | 434 |
| Little Ealing Primary School | Primary | Maintained | London | 674 |
| Mandeville School | Special | Maintained special | Middlesex | 194 |
| Maples Nursery School and Children's Centre | Nursery | Maintained | London | 93 |
| Mayfield Primary School | Primary | Maintained | London | 421 |
| Montpelier Primary School | Primary | Maintained | London | 646 |
| Mount Carmel Catholic Primary School | Primary | Academy | London | Not published |
| North Ealing Primary School | Primary | Maintained | London | 660 |
| North Primary School | Primary | Maintained | Southall | 379 |
| Oaklands Primary School | Primary | Maintained | London | 450 |
| Oldfield Primary School | Primary | Maintained | Greenford | 308 |
| Our Lady of the Visitation Catholic Primary School | Primary | Academy | Greenford | Not published |
| Perivale Primary School | Primary | Maintained | Greenford | 449 |
| Petts Hill Primary School | Primary | Maintained | Northolt | 242 |
| Ravenor Primary School | Primary | Maintained | Greenford | 618 |
| Selborne Primary School | Primary | Maintained | Greenford | 649 |
| South Acton Childrens Centre | Nursery | Maintained | London | 125 |
| Southfield Primary School | Primary | Maintained | London | 372 |
| Springhallow School | Special | Maintained special | London | 169 |
| St Ann's School | Special | Maintained special | London | 128 |
| St Anselm's Catholic Primary School | Primary | Academy | Southall | Not published |
| St Gregory's Catholic Primary School | Primary | Academy | London | Not published |
| St John Fisher Catholic Primary School | Primary | Academy | Greenford | Not published |
| St John's Primary School | Primary | Maintained | London | 474 |
| St Joseph's Catholic Primary School | Primary | Academy | London | Not published |
| St Mark's Primary School | Primary | Maintained | London | 441 |
| St Mary's Church of England Primary Norwood Green | Primary | Free school | Southall | 170 |
| St Raphael's Catholic Primary School | Primary | Academy | Northolt | Not published |
| St Vincent's Catholic Primary School | Primary | Academy | London | Not published |
| Stanhope Primary School | Primary | Maintained | Greenford | 360 |
| The Cardinal Wiseman Catholic School | Secondary | Maintained | Greenford | 2,036 |
| The Edward Betham Church of England Primary School | Primary | Maintained | Greenford | 416 |
| The Ellen Wilkinson School for Girls | Secondary | Maintained | London | 1,315 |
| Three Bridges Primary School | Primary | Maintained | Southall | 422 |
| Tudor Primary School | Primary | Maintained | Southall | 392 |
| Twyford Church of England High School | Secondary | Academy | London | 1,682 |
| Vicar's Green Primary School | Primary | Maintained | Wembley | 439 |
| Viking Primary School | Primary | Maintained | Northolt | 213 |
| Villiers High School | Secondary | Maintained | Southall | 1,445 |
| West Acton Primary School | Primary | Maintained | London | 694 |
| West Twyford Primary School | Primary | Maintained | London | 440 |
| William Perkin Church of England High School | Secondary | Free school | Greenford | 1,450 |
| Willow Tree Primary School | Primary | Maintained | Northolt | 462 |
| Wolf Fields Primary School | Primary | Maintained | Southall | 187 |
| Wood End Primary School | Primary | Academy | Northolt | 415 |
| Woodlands Academy | Primary | Academy | London | 192 |