Dudley
108 state-funded schools with 47,263 pupils on roll, in the West Midlands region. Every school’s page has its published figures against Dudley and England.
- Primary
- 78
- Secondary
- 19
- Special
- 7
- Alternative provision
- 2
- Nursery
- 1
- 16 to 19
- 1
- Academies
- 64
- Maintained
- 40
- Maintained special
- 4
Map
Zoom in to see each school. Open the full map
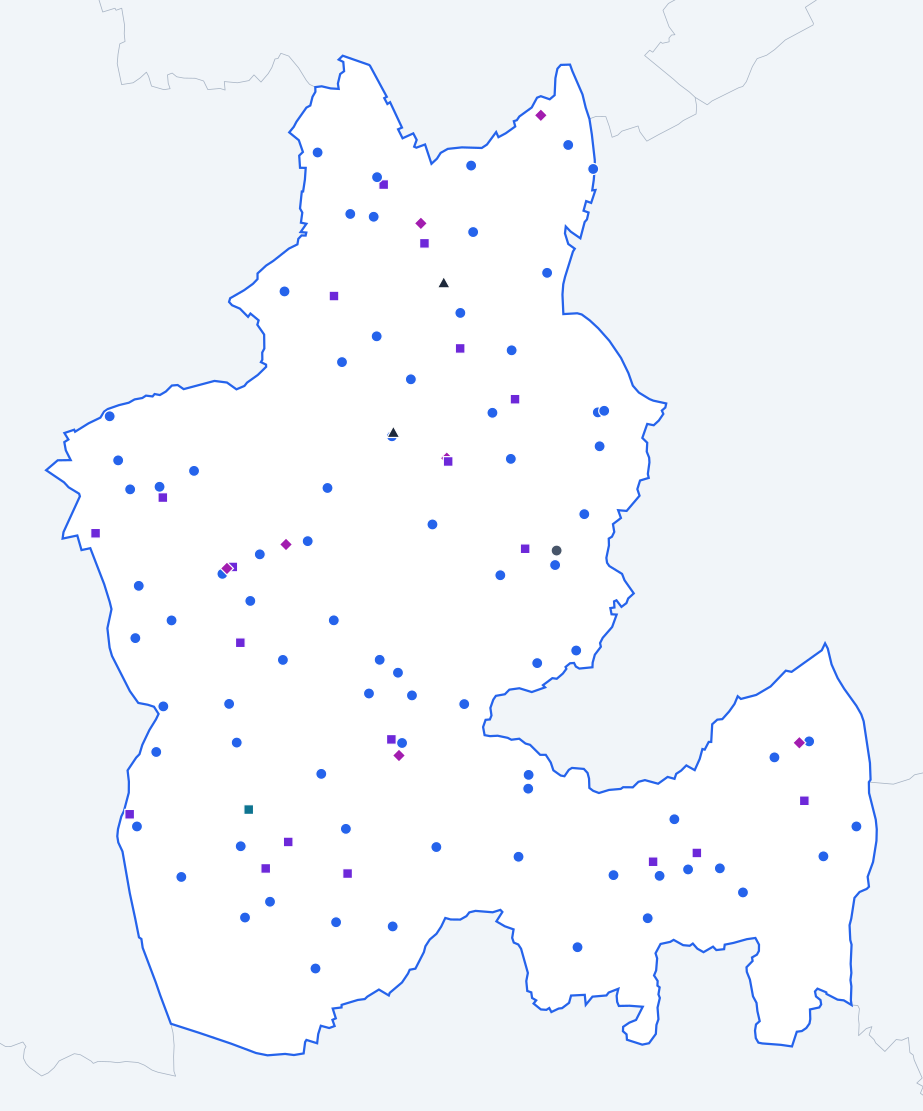
ONS, OS © Crown copyright 2025 · GIAS · © OpenStreetMap
Dudley against England
Published figures for the authority’s schools, set against the same kind of school across England.
All state-funded schools
Overall absence
2024/257.0%
- England
- 6.8%
0.2 percentage points higher than England.
Show the figures as a table
| Year | Dudley | England |
|---|---|---|
| 2017/18 | 5.0% | 4.8% |
| 2018/19 | 5.0% | 4.7% |
| 2020/21 | 4.9% | 4.6% |
| 2021/22 | 8.0% | 7.6% |
| 2022/23 | 7.7% | 7.4% |
| 2023/24 | 7.6% | 7.1% |
| 2024/25 | 7.0% | 6.8% |
Sessions missed for any reason, as a share of all possible sessions in the school year. Source: Department for Education, Explore Education Statistics, Pupil absence in schools in England, 2024/25.
Persistent absence
2024/2520.1%
- England
- 18.1%
2.0 percentage points higher than England.
Show the figures as a table
| Year | Dudley | England |
|---|---|---|
| 2017/18 | 12.3% | 11.2% |
| 2018/19 | 12.4% | 10.9% |
| 2020/21 | 13.8% | 12.1% |
| 2021/22 | 26.0% | 22.5% |
| 2022/23 | 23.0% | 21.2% |
| 2023/24 | 22.3% | 20.0% |
| 2024/25 | 20.1% | 18.1% |
Pupils who missed 10% or more of their possible sessions, as a share of pupils. Source: Department for Education, Explore Education Statistics, Pupil absence in schools in England, 2024/25.
Severe absence
2024/252.7%
- England
- 2.4%
0.3 percentage points higher than England.
Show the figures as a table
| Year | Dudley | England |
|---|---|---|
| 2017/18 | 0.9% | 0.8% |
| 2018/19 | 1.0% | 0.8% |
| 2020/21 | 1.1% | 1.1% |
| 2021/22 | 1.6% | 1.7% |
| 2022/23 | 2.2% | 2.0% |
| 2023/24 | 2.6% | 2.3% |
| 2024/25 | 2.7% | 2.4% |
Pupils who missed 50% or more of their possible sessions, as a share of pupils. Source: Department for Education, Explore Education Statistics, Pupil absence in schools in England, 2024/25.
Suspensions per 100 pupils
2024/258.62
- England
- 10.88
2.26 lower than England.
Show the figures as a table
| Year | Dudley | England |
|---|---|---|
| 2017/18 | 4.91 | 5.08 |
| 2018/19 | 9.12 | 5.36 |
| 2019/20 | 4.38 | 3.76 |
| 2020/21 | 5.23 | 4.25 |
| 2021/22 | 6.60 | 6.91 |
| 2022/23 | 8.46 | 9.33 |
| 2023/24 | 9.57 | 11.31 |
| 2024/25 | 8.62 | 10.88 |
Suspensions in the school year for every 100 pupils on roll. One pupil can be suspended more than once. Source: Department for Education, Explore Education Statistics, Suspensions and permanent exclusions in England, 2024/25.
Permanent exclusions per 100 pupils
2024/250.25
- England
- 0.12
0.13 higher than England.
Show the figures as a table
| Year | Dudley | England |
|---|---|---|
| 2017/18 | 0.20 | 0.10 |
| 2018/19 | 0.21 | 0.10 |
| 2019/20 | 0.10 | 0.06 |
| 2020/21 | 0.07 | 0.05 |
| 2021/22 | 0.14 | 0.08 |
| 2022/23 | 0.18 | 0.11 |
| 2023/24 | 0.20 | 0.13 |
| 2024/25 | 0.25 | 0.12 |
Permanent exclusions in the school year for every 100 pupils on roll. Source: Department for Education, Explore Education Statistics, Suspensions and permanent exclusions in England, 2024/25.
Eligible for free school meals
2024/2526.8%
- England
- 25.7%
1.1 percentage points higher than England.
Show the figures as a table
| Year | Dudley | England |
|---|---|---|
| 2021/22 | 24.2% | 22.5% |
| 2022/23 | 25.3% | 23.8% |
| 2023/24 | 26.0% | 24.6% |
| 2024/25 | 26.8% | 25.7% |
Pupils known to be eligible for free school meals on census day in January. Source: Department for Education, Explore Education Statistics, Schools, pupils and their characteristics, 2024/25.
SEN support
2024/2514.2%
- England
- 14.0%
0.2 percentage points higher than England.
Show the figures as a table
| Year | Dudley | England |
|---|---|---|
| 2021/22 | 13.7% | 12.4% |
| 2022/23 | 13.7% | 12.9% |
| 2023/24 | 14.1% | 13.4% |
| 2024/25 | 14.2% | 14.0% |
Pupils receiving special educational needs support without an education, health and care plan. Source: Department for Education, Explore Education Statistics, Schools, pupils and their characteristics, 2024/25.
Education, health and care plan
2024/255.2%
- England
- 5.2%
The same as England.
Show the figures as a table
| Year | Dudley | England |
|---|---|---|
| 2021/22 | 4.3% | 3.8% |
| 2022/23 | 4.6% | 4.2% |
| 2023/24 | 4.9% | 4.7% |
| 2024/25 | 5.2% | 5.2% |
Pupils with an education, health and care plan. Source: Department for Education, Explore Education Statistics, Schools, pupils and their characteristics, 2024/25.
First language other than English
2024/2512.1%
- England
- 21.4%
9.3 percentage points lower than England.
Show the figures as a table
| Year | Dudley | England |
|---|---|---|
| 2021/22 | 10.8% | 19.6% |
| 2022/23 | 11.0% | 20.2% |
| 2023/24 | 11.7% | 20.8% |
| 2024/25 | 12.1% | 21.4% |
Pupils whose first language is known or believed to be other than English. Source: Department for Education, Explore Education Statistics, Schools, pupils and their characteristics, 2024/25.
Pupils per qualified teacher
2025/2618.9
- England
- 18.5
0.4 higher than England.
Show the figures as a table
| Year | Dudley | England |
|---|---|---|
| 2017/18 | 17.9 | 18.4 |
| 2018/19 | 19.1 | 18.6 |
| 2019/20 | 19.1 | 18.8 |
| 2020/21 | 19.0 | 18.5 |
| 2021/22 | 19.2 | 18.5 |
| 2022/23 | 18.9 | 18.5 |
| 2023/24 | 19.0 | 18.6 |
| 2024/25 | 19.4 | 18.6 |
| 2025/26 | 18.9 | 18.5 |
Full-time equivalent pupils for each full-time equivalent qualified teacher. Source: Department for Education, Explore Education Statistics, School workforce in England, 2025/26.
Teacher sickness absence
2024/254.4 days
- England
- 5.0 days
0.6 days lower than England.
Show the figures as a table
| Year | Dudley | England |
|---|---|---|
| 2017/18 | 4.3 days | 4.0 days |
| 2018/19 | 3.9 days | 4.0 days |
| 2019/20 | Not published | Not published |
| 2020/21 | 3.3 days | 3.9 days |
| 2021/22 | 4.4 days | 6.3 days |
| 2022/23 | 4.2 days | 5.2 days |
| 2023/24 | 4.6 days | 5.3 days |
| 2024/25 | 4.4 days | 5.0 days |
Days lost to sickness absence in the school year, averaged across all teachers. Source: Department for Education, Explore Education Statistics, School workforce in England, 2024/25.
Primary schools
Overall absence
2024/255.7%
- England
- 5.2%
0.5 percentage points higher than England.
Show the figures as a table
| Year | Dudley | England |
|---|---|---|
| 2017/18 | 4.5% | 4.2% |
| 2018/19 | 4.3% | 4.0% |
| 2020/21 | 4.1% | 3.6% |
| 2021/22 | 6.9% | 6.3% |
| 2022/23 | 6.4% | 5.9% |
| 2023/24 | 6.0% | 5.5% |
| 2024/25 | 5.7% | 5.2% |
Sessions missed for any reason, as a share of all possible sessions in the school year. Source: Department for Education, Explore Education Statistics, Pupil absence in schools in England, 2024/25.
Persistent absence
2024/2514.8%
- England
- 13.0%
1.8 percentage points higher than England.
Show the figures as a table
| Year | Dudley | England |
|---|---|---|
| 2017/18 | 9.9% | 8.7% |
| 2018/19 | 9.2% | 8.2% |
| 2020/21 | 10.4% | 8.8% |
| 2021/22 | 21.7% | 17.7% |
| 2022/23 | 18.5% | 16.2% |
| 2023/24 | 16.7% | 14.6% |
| 2024/25 | 14.8% | 13.0% |
Pupils who missed 10% or more of their possible sessions, as a share of pupils. Source: Department for Education, Explore Education Statistics, Pupil absence in schools in England, 2024/25.
Severe absence
2024/251.3%
- England
- 0.9%
0.4 percentage points higher than England.
Show the figures as a table
| Year | Dudley | England |
|---|---|---|
| 2017/18 | 0.5% | 0.4% |
| 2018/19 | 0.6% | 0.4% |
| 2020/21 | 0.7% | 0.7% |
| 2021/22 | 0.7% | 0.6% |
| 2022/23 | 0.8% | 0.7% |
| 2023/24 | 1.1% | 0.9% |
| 2024/25 | 1.3% | 0.9% |
Pupils who missed 50% or more of their possible sessions, as a share of pupils. Source: Department for Education, Explore Education Statistics, Pupil absence in schools in England, 2024/25.
Suspensions per 100 pupils
2024/252.39
- England
- 2.47
0.08 lower than England.
Show the figures as a table
| Year | Dudley | England |
|---|---|---|
| 2017/18 | 1.28 | 1.40 |
| 2018/19 | 1.39 | 1.41 |
| 2019/20 | 1.03 | 1.00 |
| 2020/21 | 1.06 | 0.99 |
| 2021/22 | 1.60 | 1.42 |
| 2022/23 | 1.59 | 1.81 |
| 2023/24 | 2.00 | 2.27 |
| 2024/25 | 2.39 | 2.47 |
Suspensions in the school year for every 100 pupils on roll. One pupil can be suspended more than once. Source: Department for Education, Explore Education Statistics, Suspensions and permanent exclusions in England, 2024/25.
Permanent exclusions per 100 pupils
2024/250.10
- England
- 0.03
0.07 higher than England.
Show the figures as a table
| Year | Dudley | England |
|---|---|---|
| 2017/18 | 0.08 | 0.03 |
| 2018/19 | 0.05 | 0.02 |
| 2019/20 | 0.03 | 0.02 |
| 2020/21 | 0.00 | 0.01 |
| 2021/22 | 0.02 | 0.02 |
| 2022/23 | 0.04 | 0.03 |
| 2023/24 | 0.05 | 0.03 |
| 2024/25 | 0.10 | 0.03 |
Permanent exclusions in the school year for every 100 pupils on roll. Source: Department for Education, Explore Education Statistics, Suspensions and permanent exclusions in England, 2024/25.
Reading, writing and maths: expected standard
2025/26 (provisional)61%
- England
- 63%
2 percentage points lower than England.
Show the figures as a table
| Year | Dudley | England |
|---|---|---|
| 2021/22 | 53% | 59% |
| 2022/23 | 55% | 60% |
| 2023/24 | 57% | 61% |
| 2024/25 | 61% | 63% |
| 2025/26 (provisional) | 61% | 63% |
Pupils at the end of key stage 2 who met the expected standard in reading, writing and maths combined. Source: Department for Education, Explore Education Statistics, Key stage 2 attainment, 2025/26.
Reading, writing and maths: higher standard
2025/26 (provisional)8%
- England
- 9%
1 percentage point lower than England.
Show the figures as a table
| Year | Dudley | England |
|---|---|---|
| 2021/22 | 6% | 7% |
| 2022/23 | 7% | 8% |
| 2023/24 | 6% | 8% |
| 2024/25 | 7% | 8% |
| 2025/26 (provisional) | 8% | 9% |
Pupils at the end of key stage 2 who met the higher standard in reading, writing and maths combined. Source: Department for Education, Explore Education Statistics, Key stage 2 attainment, 2025/26.
Eligible for free school meals
2024/2524.6%
- England
- 24.7%
0.1 percentage points lower than England.
Show the figures as a table
| Year | Dudley | England |
|---|---|---|
| 2021/22 | 24.2% | 23.1% |
| 2022/23 | 24.6% | 24.0% |
| 2023/24 | 24.7% | 24.3% |
| 2024/25 | 24.6% | 24.7% |
Pupils known to be eligible for free school meals on census day in January. Source: Department for Education, Explore Education Statistics, Schools, pupils and their characteristics, 2024/25.
SEN support
2024/2514.9%
- England
- 15.0%
0.1 percentage points lower than England.
Show the figures as a table
| Year | Dudley | England |
|---|---|---|
| 2021/22 | 13.8% | 13.0% |
| 2022/23 | 13.9% | 13.5% |
| 2023/24 | 14.9% | 14.1% |
| 2024/25 | 14.9% | 15.0% |
Pupils receiving special educational needs support without an education, health and care plan. Source: Department for Education, Explore Education Statistics, Schools, pupils and their characteristics, 2024/25.
Education, health and care plan
2024/253.6%
- England
- 3.5%
0.1 percentage points higher than England.
Show the figures as a table
| Year | Dudley | England |
|---|---|---|
| 2021/22 | 2.7% | 2.3% |
| 2022/23 | 2.9% | 2.5% |
| 2023/24 | 3.2% | 3.0% |
| 2024/25 | 3.6% | 3.5% |
Pupils with an education, health and care plan. Source: Department for Education, Explore Education Statistics, Schools, pupils and their characteristics, 2024/25.
First language other than English
2024/2512.7%
- England
- 23.4%
10.7 percentage points lower than England.
Show the figures as a table
| Year | Dudley | England |
|---|---|---|
| 2021/22 | 10.9% | 21.2% |
| 2022/23 | 11.2% | 22.0% |
| 2023/24 | 12.1% | 22.8% |
| 2024/25 | 12.7% | 23.4% |
Pupils whose first language is known or believed to be other than English. Source: Department for Education, Explore Education Statistics, Schools, pupils and their characteristics, 2024/25.
Pupils per qualified teacher
2025/2622.5
- England
- 21.2
1.3 higher than England.
Show the figures as a table
| Year | Dudley | England |
|---|---|---|
| 2017/18 | 20.8 | 21.3 |
| 2018/19 | 22.0 | 21.4 |
| 2019/20 | 22.1 | 21.4 |
| 2020/21 | 22.4 | 21.1 |
| 2021/22 | 22.4 | 21.0 |
| 2022/23 | 22.0 | 21.1 |
| 2023/24 | 22.3 | 21.2 |
| 2024/25 | 22.6 | 21.3 |
| 2025/26 | 22.5 | 21.2 |
Full-time equivalent pupils for each full-time equivalent qualified teacher. Source: Department for Education, Explore Education Statistics, School workforce in England, 2025/26.
Secondary schools
Overall absence
2024/258.7%
- England
- 8.4%
0.3 percentage points higher than England.
Show the figures as a table
| Year | Dudley | England |
|---|---|---|
| 2017/18 | 5.7% | 5.5% |
| 2018/19 | 5.8% | 5.5% |
| 2020/21 | 5.8% | 5.5% |
| 2021/22 | 9.5% | 9.0% |
| 2022/23 | 9.3% | 9.0% |
| 2023/24 | 9.5% | 8.9% |
| 2024/25 | 8.7% | 8.4% |
Sessions missed for any reason, as a share of all possible sessions in the school year. Source: Department for Education, Explore Education Statistics, Pupil absence in schools in England, 2024/25.
Persistent absence
2024/2526.2%
- England
- 23.4%
2.8 percentage points higher than England.
Show the figures as a table
| Year | Dudley | England |
|---|---|---|
| 2017/18 | 14.9% | 13.9% |
| 2018/19 | 16.3% | 13.7% |
| 2020/21 | 16.5% | 14.8% |
| 2021/22 | 31.2% | 27.7% |
| 2022/23 | 28.5% | 26.5% |
| 2023/24 | 29.0% | 25.6% |
| 2024/25 | 26.2% | 23.4% |
Pupils who missed 10% or more of their possible sessions, as a share of pupils. Source: Department for Education, Explore Education Statistics, Pupil absence in schools in England, 2024/25.
Severe absence
2024/254.5%
- England
- 3.9%
0.6 percentage points higher than England.
Show the figures as a table
| Year | Dudley | England |
|---|---|---|
| 2017/18 | 1.4% | 1.2% |
| 2018/19 | 1.6% | 1.3% |
| 2020/21 | 1.5% | 1.5% |
| 2021/22 | 2.8% | 2.7% |
| 2022/23 | 3.9% | 3.4% |
| 2023/24 | 4.5% | 3.8% |
| 2024/25 | 4.5% | 3.9% |
Pupils who missed 50% or more of their possible sessions, as a share of pupils. Source: Department for Education, Explore Education Statistics, Pupil absence in schools in England, 2024/25.
Suspensions per 100 pupils
2024/2518.06
- England
- 21.24
3.18 lower than England.
Show the figures as a table
| Year | Dudley | England |
|---|---|---|
| 2017/18 | 10.57 | 10.13 |
| 2018/19 | 22.05 | 10.75 |
| 2019/20 | 9.79 | 7.43 |
| 2020/21 | 12.07 | 8.48 |
| 2021/22 | 14.65 | 13.96 |
| 2022/23 | 19.53 | 18.90 |
| 2023/24 | 21.29 | 22.61 |
| 2024/25 | 18.06 | 21.24 |
Suspensions in the school year for every 100 pupils on roll. One pupil can be suspended more than once. Source: Department for Education, Explore Education Statistics, Suspensions and permanent exclusions in England, 2024/25.
Permanent exclusions per 100 pupils
2024/250.48
- England
- 0.23
0.25 higher than England.
Show the figures as a table
| Year | Dudley | England |
|---|---|---|
| 2017/18 | 0.37 | 0.20 |
| 2018/19 | 0.45 | 0.20 |
| 2019/20 | 0.22 | 0.13 |
| 2020/21 | 0.18 | 0.10 |
| 2021/22 | 0.34 | 0.16 |
| 2022/23 | 0.39 | 0.22 |
| 2023/24 | 0.45 | 0.25 |
| 2024/25 | 0.48 | 0.23 |
Permanent exclusions in the school year for every 100 pupils on roll. Source: Department for Education, Explore Education Statistics, Suspensions and permanent exclusions in England, 2024/25.
Attainment 8
2025/26 (provisional)44.2
- England
- 47.4
3.2 lower than England.
Show the figures as a table
| Year | Dudley | England |
|---|---|---|
| 2021/22 | 47.5 | 49.8 |
| 2022/23 | 43.4 | 47.2 |
| 2023/24 | 43.7 | 46.9 |
| 2024/25 | 43.9 | 47.1 |
| 2025/26 (provisional) | 44.2 | 47.4 |
The average of pupils' points across eight GCSE-level qualifications, with English and maths counted twice. Source: Department for Education, Explore Education Statistics, Key stage 4 performance, 2025/26.
English and maths: grade 4 or above
2025/26 (provisional)62%
- England
- 66%
4 percentage points lower than England.
Show the figures as a table
| Year | Dudley | England |
|---|---|---|
| 2021/22 | 67% | 70% |
| 2022/23 | 60% | 67% |
| 2023/24 | 61% | 67% |
| 2024/25 | 62% | 66% |
| 2025/26 (provisional) | 62% | 66% |
Pupils at the end of key stage 4 with grade 4 or above in both English and maths. Source: Department for Education, Explore Education Statistics, Key stage 4 performance, 2025/26.
English and maths: grade 5 or above
2025/26 (provisional)44%
- England
- 48%
4 percentage points lower than England.
Show the figures as a table
| Year | Dudley | England |
|---|---|---|
| 2021/22 | 46% | 51% |
| 2022/23 | 38% | 46% |
| 2023/24 | 42% | 47% |
| 2024/25 | 42% | 47% |
| 2025/26 (provisional) | 44% | 48% |
Pupils at the end of key stage 4 with grade 5 or above in both English and maths. Source: Department for Education, Explore Education Statistics, Key stage 4 performance, 2025/26.
Eligible for free school meals
2024/2529.0%
- England
- 25.8%
3.2 percentage points higher than England.
Show the figures as a table
| Year | Dudley | England |
|---|---|---|
| 2021/22 | 23.3% | 20.9% |
| 2022/23 | 25.5% | 22.7% |
| 2023/24 | 27.2% | 24.1% |
| 2024/25 | 29.0% | 25.8% |
Pupils known to be eligible for free school meals on census day in January. Source: Department for Education, Explore Education Statistics, Schools, pupils and their characteristics, 2024/25.
SEN support
2024/2513.8%
- England
- 13.4%
0.4 percentage points higher than England.
Show the figures as a table
| Year | Dudley | England |
|---|---|---|
| 2021/22 | 14.0% | 11.9% |
| 2022/23 | 13.7% | 12.4% |
| 2023/24 | 13.5% | 12.9% |
| 2024/25 | 13.8% | 13.4% |
Pupils receiving special educational needs support without an education, health and care plan. Source: Department for Education, Explore Education Statistics, Schools, pupils and their characteristics, 2024/25.
Education, health and care plan
2024/252.7%
- England
- 3.1%
0.4 percentage points lower than England.
Show the figures as a table
| Year | Dudley | England |
|---|---|---|
| 2021/22 | 2.1% | 2.2% |
| 2022/23 | 2.4% | 2.4% |
| 2023/24 | 2.5% | 2.7% |
| 2024/25 | 2.7% | 3.1% |
Pupils with an education, health and care plan. Source: Department for Education, Explore Education Statistics, Schools, pupils and their characteristics, 2024/25.
First language other than English
2024/2511.5%
- England
- 19.2%
7.7 percentage points lower than England.
Show the figures as a table
| Year | Dudley | England |
|---|---|---|
| 2021/22 | 10.6% | 17.5% |
| 2022/23 | 10.6% | 18.1% |
| 2023/24 | 11.2% | 18.6% |
| 2024/25 | 11.5% | 19.2% |
Pupils whose first language is known or believed to be other than English. Source: Department for Education, Explore Education Statistics, Schools, pupils and their characteristics, 2024/25.
Pupils per qualified teacher
2025/2616.7
- England
- 17.3
0.6 lower than England.
Show the figures as a table
| Year | Dudley | England |
|---|---|---|
| 2017/18 | 15.9 | 16.5 |
| 2018/19 | 17.0 | 16.8 |
| 2019/20 | 16.9 | 17.2 |
| 2020/21 | 16.6 | 17.1 |
| 2021/22 | 16.9 | 17.1 |
| 2022/23 | 16.3 | 17.2 |
| 2023/24 | 16.8 | 17.4 |
| 2024/25 | 17.3 | 17.3 |
| 2025/26 | 16.7 | 17.3 |
Full-time equivalent pupils for each full-time equivalent qualified teacher. Source: Department for Education, Explore Education Statistics, School workforce in England, 2025/26.
Special schools
Overall absence
2024/259.7%
- England
- 12.8%
3.1 percentage points lower than England.
Show the figures as a table
| Year | Dudley | England |
|---|---|---|
| 2017/18 | 9.0% | 10.2% |
| 2018/19 | 8.4% | 10.1% |
| 2020/21 | 14.3% | 15.2% |
| 2021/22 | 10.9% | 13.2% |
| 2022/23 | 10.8% | 13.0% |
| 2023/24 | 10.0% | 13.0% |
| 2024/25 | 9.7% | 12.8% |
Sessions missed for any reason, as a share of all possible sessions in the school year. Source: Department for Education, Explore Education Statistics, Pupil absence in schools in England, 2024/25.
Persistent absence
2024/2530.2%
- England
- 35.3%
5.1 percentage points lower than England.
Show the figures as a table
| Year | Dudley | England |
|---|---|---|
| 2017/18 | 27.9% | 29.6% |
| 2018/19 | 23.6% | 28.8% |
| 2020/21 | 54.4% | 48.9% |
| 2021/22 | 38.3% | 40.4% |
| 2022/23 | 34.2% | 38.3% |
| 2023/24 | 29.9% | 37.2% |
| 2024/25 | 30.2% | 35.3% |
Pupils who missed 10% or more of their possible sessions, as a share of pupils. Source: Department for Education, Explore Education Statistics, Pupil absence in schools in England, 2024/25.
Severe absence
2024/253.7%
- England
- 6.9%
3.2 percentage points lower than England.
Show the figures as a table
| Year | Dudley | England |
|---|---|---|
| 2017/18 | 2.3% | 4.4% |
| 2018/19 | 3.1% | 4.6% |
| 2020/21 | 4.0% | 5.6% |
| 2021/22 | 3.0% | 5.8% |
| 2022/23 | 3.7% | 6.2% |
| 2023/24 | 3.4% | 6.7% |
| 2024/25 | 3.7% | 6.9% |
Pupils who missed 50% or more of their possible sessions, as a share of pupils. Source: Department for Education, Explore Education Statistics, Pupil absence in schools in England, 2024/25.
Suspensions per 100 pupils
2024/254.70
- England
- 12.32
7.62 lower than England.
Show the figures as a table
| Year | Dudley | England |
|---|---|---|
| 2017/18 | 12.24 | 12.34 |
| 2018/19 | 4.66 | 11.32 |
| 2019/20 | 4.27 | 7.76 |
| 2020/21 | 1.10 | 7.29 |
| 2021/22 | 3.04 | 9.60 |
| 2022/23 | 2.23 | 10.99 |
| 2023/24 | 2.86 | 12.62 |
| 2024/25 | 4.70 | 12.32 |
Suspensions in the school year for every 100 pupils on roll. One pupil can be suspended more than once. Source: Department for Education, Explore Education Statistics, Suspensions and permanent exclusions in England, 2024/25.
Permanent exclusions per 100 pupils
2024/250.10
- England
- 0.08
0.02 higher than England.
Show the figures as a table
| Year | Dudley | England |
|---|---|---|
| 2017/18 | 0.85 | 0.07 |
| 2018/19 | 0.35 | 0.06 |
| 2019/20 | 0.11 | 0.04 |
| 2020/21 | 0.00 | 0.03 |
| 2021/22 | 0.00 | 0.05 |
| 2022/23 | 0.21 | 0.08 |
| 2023/24 | 0.00 | 0.08 |
| 2024/25 | 0.10 | 0.08 |
Permanent exclusions in the school year for every 100 pupils on roll. Source: Department for Education, Explore Education Statistics, Suspensions and permanent exclusions in England, 2024/25.
Eligible for free school meals
2024/2545.6%
- England
- 48.8%
3.2 percentage points lower than England.
Show the figures as a table
| Year | Dudley | England |
|---|---|---|
| 2021/22 | 44.8% | 44.4% |
| 2022/23 | 43.4% | 45.6% |
| 2023/24 | 43.9% | 47.1% |
| 2024/25 | 45.6% | 48.8% |
Pupils known to be eligible for free school meals on census day in January. Source: Department for Education, Explore Education Statistics, Schools, pupils and their characteristics, 2024/25.
SEN support
2024/250.3%
- England
- 0.5%
0.2 percentage points lower than England.
Show the figures as a table
| Year | Dudley | England |
|---|---|---|
| 2021/22 | 0.4% | 0.9% |
| 2022/23 | 0.1% | 0.8% |
| 2023/24 | 0.1% | 0.7% |
| 2024/25 | 0.3% | 0.5% |
Pupils receiving special educational needs support without an education, health and care plan. Source: Department for Education, Explore Education Statistics, Schools, pupils and their characteristics, 2024/25.
Education, health and care plan
2024/2599.7%
- England
- 99.5%
0.2 percentage points higher than England.
Show the figures as a table
| Year | Dudley | England |
|---|---|---|
| 2021/22 | 99.6% | 99.1% |
| 2022/23 | 99.9% | 99.2% |
| 2023/24 | 99.9% | 99.3% |
| 2024/25 | 99.7% | 99.5% |
Pupils with an education, health and care plan. Source: Department for Education, Explore Education Statistics, Schools, pupils and their characteristics, 2024/25.
First language other than English
2024/258.3%
- England
- 14.4%
6.1 percentage points lower than England.
Show the figures as a table
| Year | Dudley | England |
|---|---|---|
| 2021/22 | 9.5% | 14.5% |
| 2022/23 | 9.1% | 14.4% |
| 2023/24 | 8.7% | 14.4% |
| 2024/25 | 8.3% | 14.4% |
Pupils whose first language is known or believed to be other than English. Source: Department for Education, Explore Education Statistics, Schools, pupils and their characteristics, 2024/25.
Pupils per qualified teacher
2025/267.3
- England
- 7.3
The same as England.
Show the figures as a table
| Year | Dudley | England |
|---|---|---|
| 2017/18 | 6.9 | 6.7 |
| 2018/19 | 7.4 | 6.8 |
| 2019/20 | 7.6 | 7.0 |
| 2020/21 | 7.4 | 6.8 |
| 2021/22 | 7.4 | 6.9 |
| 2022/23 | 7.7 | 7.0 |
| 2023/24 | 7.5 | 7.1 |
| 2024/25 | 7.9 | 7.3 |
| 2025/26 | 7.3 | 7.3 |
Full-time equivalent pupils for each full-time equivalent qualified teacher. Source: Department for Education, Explore Education Statistics, School workforce in England, 2025/26.
Schools in Dudley
Listed by name. Filter by phase or type; sort by name or size. Nothing here is sorted by results.
Showing 108 of 108 schools in Dudley.
| School | Phase | Type | Town | Pupils |
|---|---|---|---|---|
| Alder Coppice Primary School | Primary | Maintained | Dudley | 351 |
| Amblecote Primary School | Primary | Maintained | Stourbridge | 299 |
| Ashwood Park Primary School | Primary | Maintained | Stourbridge | 293 |
| Beacon Hill Academy | Secondary | Academy | Dudley | 1,117 |
| Beechwood Church of England Primary School | Primary | Academy | Dudley | 214 |
| Belle Vue Primary School | Primary | Maintained | Stourbridge | 381 |
| Bishop Milner Catholic College | Secondary | Academy | Dudley | 798 |
| Blanford Mere Primary School | Primary | Maintained | Kingswinford | 311 |
| Blowers Green Primary School | Primary | Academy | Dudley | 245 |
| Bramford Primary School | Primary | Academy | Bilston | 476 |
| Brierley Hill Primary School | Primary | Maintained | Brierley Hill | 199 |
| Brockmoor Primary School | Primary | Maintained | Brierley Hill | 439 |
| Bromley Hills Primary School | Primary | Maintained | Kingswinford | 282 |
| Brook Primary School | Primary | Maintained | Stourbridge | 380 |
| Caslon Primary Community School | Primary | Maintained | Halesowen | 268 |
| Cherry Tree Learning Centre | Alternative provision | Academy | Dudley | 0 |
| Christ Church CofE Primary School | Primary | Academy | Bilston | 557 |
| Church of the Ascension CofE Primary School | Primary | Academy | Kingswinford | 303 |
| Colley Lane Primary Academy | Primary | Academy | Halesowen | 483 |
| Cotwall End Primary School | Primary | Maintained | Dudley | 415 |
| Cradley CofE Primary School | Primary | Maintained | Halesowen | 210 |
| Crestwood Park Primary School | Primary | Maintained | Kingswinford | 210 |
| Dawley Brook Primary School | Primary | Maintained | Kingswinford | 231 |
| Dingle Community Primary School | Primary | Maintained | Kingswinford | 188 |
| Dudley Wood Primary School | Primary | Academy | Dudley | 451 |
| Ellowes Hall Sports College | Secondary | Academy | Dudley | 1,038 |
| Fairhaven Primary School | Primary | Academy | Stourbridge | 251 |
| Foxyards Primary School | Primary | Academy | Tipton | 338 |
| Gig Mill Primary School | Primary | Academy | Stourbridge | 535 |
| Glynne Primary School | Primary | Maintained | Kingswinford | 474 |
| Greenfield Primary School | Primary | Academy | Stourbridge | 275 |
| Halesbury School | Special | Maintained special | Halesowen | 174 |
| Halesowen CofE Primary School | Primary | Maintained | Halesowen | 190 |
| Ham Dingle Primary Academy | Primary | Academy | Stourbridge | 329 |
| Hawbush Primary School | Primary | Academy | Brierley Hill | 214 |
| Hob Green Primary School | Primary | Academy | Stourbridge | 259 |
| Howley Grange Primary School | Primary | Maintained | Halesowen | 414 |
| Huntingtree Primary School | Primary | Academy | Halesowen | 438 |
| Hurst Green Primary School | Primary | Maintained | Halesowen | 420 |
| Hurst Hill Primary School | Primary | Academy | Bilston | 233 |
| Jesson's Church of England Primary School | Primary | Academy | Dudley | 703 |
| Kates Hill Primary School | Primary | Academy | Dudley | 445 |
| King Edward VI College Stourbridge | 16 to 19 | Academy | Stourbridge | 0 |
| Kingswinford Academy | Secondary | Academy | Kingswinford | 917 |
| Lapal Primary School | Primary | Academy | Halesowen | 360 |
| Leasowes High School | Secondary | Academy | Halesowen | 1,043 |
| Lutley Primary School | Primary | Academy | Halesowen | 546 |
| Maidensbridge Primary School | Primary | Maintained | Kingswinford | 236 |
| Manor Way Primary Academy | Primary | Academy | Halesowen | 205 |
| Milking Bank Primary School | Primary | Academy | DUDLEY | Not published |
| Mount Pleasant Primary School | Primary | Maintained | Brierley Hill | 356 |
| Netherbrook Primary School | Primary | Academy | Dudley | 461 |
| Netherton CofE Primary School | Primary | Academy | Dudley | 381 |
| Netherton Park Nursery School | Nursery | Maintained | Dudley | 122 |
| Newfield Park Primary Academy | Primary | Academy | Halesowen | 472 |
| Northfield Road Primary School | Primary | Academy | Dudley | 366 |
| Old Swinford Hospital | Secondary | Maintained | Stourbridge | 1,036 |
| Oldswinford C of E Primary School | Primary | Maintained | Stourbridge | 413 |
| Olive Hill Primary Academy | Primary | Academy | Halesowen | 454 |
| Our Lady and St Kenelm RC School | Primary | Maintained | Halesowen | 203 |
| Pedmore CE Primary School | Primary | Academy | Stourbridge | 219 |
| Pegasus Academy | Secondary | Academy | Dudley | 697 |
| Pens Meadow School | Special | Maintained special | Pensnett | 145 |
| Peters Hill Primary School | Primary | Maintained | Brierley Hill | 722 |
| Priory Primary School | Primary | Academy | Dudley | 547 |
| Quarry Bank Primary School | Primary | Maintained | Brierley Hill | 358 |
| Queen Victoria Primary School | Primary | Academy | Dudley | 449 |
| Red Hall Primary School | Primary | Maintained | Dudley | 429 |
| Redhill School | Secondary | Academy | Stourbridge | 1,204 |
| Ridgewood High School | Secondary | Academy | Stourbridge | 641 |
| Roberts Primary School | Primary | Maintained | Dudley | 626 |
| Rosewood School | Special | Maintained special | Bilston | 48 |
| Rufford Primary School | Primary | Academy | Stourbridge | 260 |
| Russells Hall Primary School | Primary | Maintained | Dudley | 413 |
| Sledmere Primary School | Primary | Academy | Dudley | 558 |
| St Chad's Catholic Primary School | Primary | Academy | Dudley | 238 |
| St James Academy | Secondary | Academy | Dudley | 867 |
| St James's CofE Primary School | Primary | Maintained | Stourbridge | 390 |
| St Joseph's Catholic Primary School | Primary | Academy | Dudley | 245 |
| St Joseph's RC Primary School | Primary | Academy | Stourbridge | 201 |
| St Margaret's At Hasbury CofE Primary School | Primary | Maintained | Halesowen | 193 |
| St Mark's CofE Primary School | Primary | Maintained | Brierley Hill | 336 |
| St Mary's CofE Primary School | Primary | Academy | Kingswinford | 170 |
| St Mary's RC Primary School | Primary | Academy | Brierley Hill | 180 |
| Straits Primary School | Primary | Maintained | Dudley | 410 |
| Summerhill School | Secondary | Maintained | Kingswinford | 1,093 |
| Sutton School | Special | Maintained special | Dudley | 194 |
| Sycamore Short Stay School | Alternative provision | Maintained | Dudley | 16 |
| Tenterfields Primary Academy | Primary | Academy | HALESOWEN | 229 |
| The Brier School | Special | Academy | Kingswinford | 219 |
| The Bromley-Pensnett Primary School | Primary | Academy | Brierley Hill | 243 |
| The Crestwood School | Secondary | Academy | Dudley | 1,023 |
| The Dormston School | Secondary | Maintained | Dudley | 1,128 |
| The Earls High School | Secondary | Academy | Halesowen | 1,304 |
| The Link Academy | Secondary | Academy | Dudley | 1,013 |
| The Old Park School | Special | Academy | Brierley Hill | Not published |
| The Pedmore High School | Secondary | Academy | Stourbridge | 647 |
| The Ridge Primary School | Primary | Maintained | Stourbridge | 236 |
| The Wordsley School | Secondary | Academy | Stourbridge | 906 |
| Thorns Collegiate Academy | Secondary | Academy | Brierley Hill | 861 |
| Thorns Primary School | Primary | Academy | Brierley Hill | 190 |
| Wallbrook Primary Academy | Primary | Academy | Bilston | 263 |
| Windsor High School and Sixth Form | Secondary | Academy | Halesowen | 1,710 |
| Withymoor Primary School | Primary | Academy | Brierley Hill | 439 |
| Wollescote Primary School | Primary | Maintained | Stourbridge | 440 |
| Woodsetton School | Special | Academy | Dudley | 123 |
| Woodside Primary School and Nursery | Primary | Academy | Dudley | 501 |
| Wrens Nest Primary School | Primary | Maintained | Dudley | 537 |