Doncaster
128 state-funded schools with 48,299 pupils on roll, in the Yorkshire and The Humber region. Every school’s page has its published figures against Doncaster and England.
- Primary
- 98
- Secondary
- 20
- Special
- 6
- Alternative provision
- 3
- 16 to 19
- 1
- Academies
- 95
- Maintained
- 26
- Free schools
- 6
- Maintained special
- 1
Map
Zoom in to see each school. Open the full map
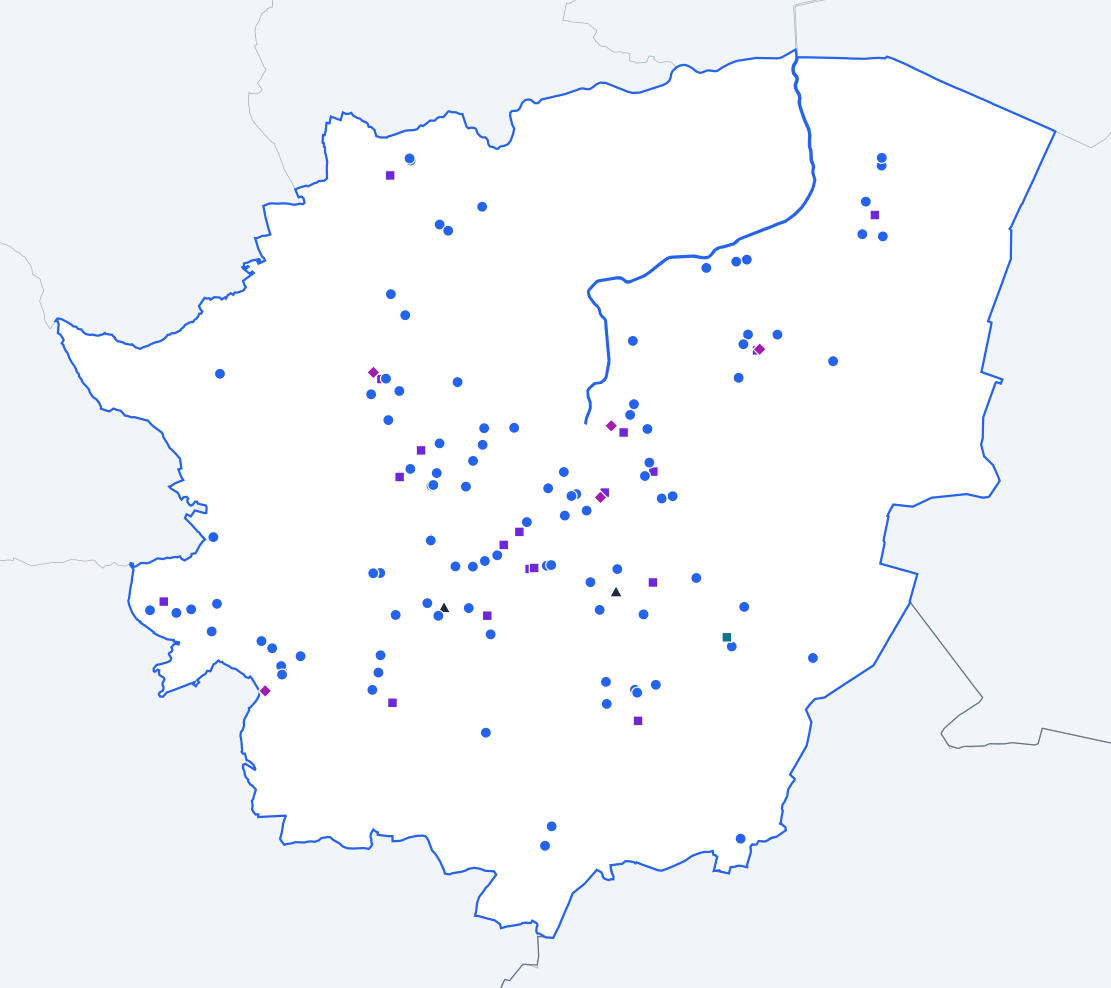
ONS, OS © Crown copyright 2025 · GIAS · © OpenStreetMap
Doncaster against England
Published figures for the authority’s schools, set against the same kind of school across England.
All state-funded schools
Overall absence
2024/256.5%
- England
- 6.8%
0.3 percentage points lower than England.
Show the figures as a table
| Year | Doncaster | England |
|---|---|---|
| 2017/18 | 5.5% | 4.8% |
| 2018/19 | 5.2% | 4.7% |
| 2020/21 | 5.2% | 4.6% |
| 2021/22 | 8.4% | 7.6% |
| 2022/23 | 7.7% | 7.4% |
| 2023/24 | 7.3% | 7.1% |
| 2024/25 | 6.5% | 6.8% |
Sessions missed for any reason, as a share of all possible sessions in the school year. Source: Department for Education, Explore Education Statistics, Pupil absence in schools in England, 2024/25.
Persistent absence
2024/2518.3%
- England
- 18.1%
0.2 percentage points higher than England.
Show the figures as a table
| Year | Doncaster | England |
|---|---|---|
| 2017/18 | 14.3% | 11.2% |
| 2018/19 | 12.9% | 10.9% |
| 2020/21 | 14.2% | 12.1% |
| 2021/22 | 26.1% | 22.5% |
| 2022/23 | 22.6% | 21.2% |
| 2023/24 | 21.2% | 20.0% |
| 2024/25 | 18.3% | 18.1% |
Pupils who missed 10% or more of their possible sessions, as a share of pupils. Source: Department for Education, Explore Education Statistics, Pupil absence in schools in England, 2024/25.
Severe absence
2024/252.3%
- England
- 2.4%
0.1 percentage points lower than England.
Show the figures as a table
| Year | Doncaster | England |
|---|---|---|
| 2017/18 | 1.4% | 0.8% |
| 2018/19 | 1.3% | 0.8% |
| 2020/21 | 1.7% | 1.1% |
| 2021/22 | 2.3% | 1.7% |
| 2022/23 | 2.5% | 2.0% |
| 2023/24 | 2.6% | 2.3% |
| 2024/25 | 2.3% | 2.4% |
Pupils who missed 50% or more of their possible sessions, as a share of pupils. Source: Department for Education, Explore Education Statistics, Pupil absence in schools in England, 2024/25.
Suspensions per 100 pupils
2024/2521.24
- England
- 10.88
10.36 higher than England.
Show the figures as a table
| Year | Doncaster | England |
|---|---|---|
| 2017/18 | 22.61 | 5.08 |
| 2018/19 | 19.14 | 5.36 |
| 2019/20 | 13.37 | 3.76 |
| 2020/21 | 12.34 | 4.25 |
| 2021/22 | 20.18 | 6.91 |
| 2022/23 | 24.21 | 9.33 |
| 2023/24 | 24.30 | 11.31 |
| 2024/25 | 21.24 | 10.88 |
Suspensions in the school year for every 100 pupils on roll. One pupil can be suspended more than once. Source: Department for Education, Explore Education Statistics, Suspensions and permanent exclusions in England, 2024/25.
Permanent exclusions per 100 pupils
2024/250.14
- England
- 0.12
0.02 higher than England.
Show the figures as a table
| Year | Doncaster | England |
|---|---|---|
| 2017/18 | 0.09 | 0.10 |
| 2018/19 | 0.22 | 0.10 |
| 2019/20 | 0.10 | 0.06 |
| 2020/21 | 0.05 | 0.05 |
| 2021/22 | 0.09 | 0.08 |
| 2022/23 | 0.17 | 0.11 |
| 2023/24 | 0.17 | 0.13 |
| 2024/25 | 0.14 | 0.12 |
Permanent exclusions in the school year for every 100 pupils on roll. Source: Department for Education, Explore Education Statistics, Suspensions and permanent exclusions in England, 2024/25.
Eligible for free school meals
2024/2529.6%
- England
- 25.7%
3.9 percentage points higher than England.
Show the figures as a table
| Year | Doncaster | England |
|---|---|---|
| 2021/22 | 26.8% | 22.5% |
| 2022/23 | 28.0% | 23.8% |
| 2023/24 | 28.9% | 24.6% |
| 2024/25 | 29.6% | 25.7% |
Pupils known to be eligible for free school meals on census day in January. Source: Department for Education, Explore Education Statistics, Schools, pupils and their characteristics, 2024/25.
SEN support
2024/2514.0%
- England
- 14.0%
The same as England.
Show the figures as a table
| Year | Doncaster | England |
|---|---|---|
| 2021/22 | 12.8% | 12.4% |
| 2022/23 | 13.1% | 12.9% |
| 2023/24 | 13.8% | 13.4% |
| 2024/25 | 14.0% | 14.0% |
Pupils receiving special educational needs support without an education, health and care plan. Source: Department for Education, Explore Education Statistics, Schools, pupils and their characteristics, 2024/25.
Education, health and care plan
2024/254.1%
- England
- 5.2%
1.1 percentage points lower than England.
Show the figures as a table
| Year | Doncaster | England |
|---|---|---|
| 2021/22 | 3.0% | 3.8% |
| 2022/23 | 3.2% | 4.2% |
| 2023/24 | 3.6% | 4.7% |
| 2024/25 | 4.1% | 5.2% |
Pupils with an education, health and care plan. Source: Department for Education, Explore Education Statistics, Schools, pupils and their characteristics, 2024/25.
First language other than English
2024/2514.8%
- England
- 21.4%
6.6 percentage points lower than England.
Show the figures as a table
| Year | Doncaster | England |
|---|---|---|
| 2021/22 | 12.0% | 19.6% |
| 2022/23 | 13.1% | 20.2% |
| 2023/24 | 14.0% | 20.8% |
| 2024/25 | 14.8% | 21.4% |
Pupils whose first language is known or believed to be other than English. Source: Department for Education, Explore Education Statistics, Schools, pupils and their characteristics, 2024/25.
Pupils per qualified teacher
2025/2619.3
- England
- 18.5
0.8 higher than England.
Show the figures as a table
| Year | Doncaster | England |
|---|---|---|
| 2017/18 | 18.7 | 18.4 |
| 2018/19 | 18.9 | 18.6 |
| 2019/20 | 19.3 | 18.8 |
| 2020/21 | 19.0 | 18.5 |
| 2021/22 | 18.9 | 18.5 |
| 2022/23 | 19.3 | 18.5 |
| 2023/24 | 19.4 | 18.6 |
| 2024/25 | 19.4 | 18.6 |
| 2025/26 | 19.3 | 18.5 |
Full-time equivalent pupils for each full-time equivalent qualified teacher. Source: Department for Education, Explore Education Statistics, School workforce in England, 2025/26.
Teacher sickness absence
2024/255.2 days
- England
- 5.0 days
0.2 days higher than England.
Show the figures as a table
| Year | Doncaster | England |
|---|---|---|
| 2017/18 | 4.8 days | 4.0 days |
| 2018/19 | 4.5 days | 4.0 days |
| 2019/20 | Not published | Not published |
| 2020/21 | 4.5 days | 3.9 days |
| 2021/22 | 6.5 days | 6.3 days |
| 2022/23 | 5.2 days | 5.2 days |
| 2023/24 | 5.4 days | 5.3 days |
| 2024/25 | 5.2 days | 5.0 days |
Days lost to sickness absence in the school year, averaged across all teachers. Source: Department for Education, Explore Education Statistics, School workforce in England, 2024/25.
Primary schools
Overall absence
2024/255.1%
- England
- 5.2%
0.1 percentage points lower than England.
Show the figures as a table
| Year | Doncaster | England |
|---|---|---|
| 2017/18 | 4.6% | 4.2% |
| 2018/19 | 4.2% | 4.0% |
| 2020/21 | 3.9% | 3.6% |
| 2021/22 | 6.8% | 6.3% |
| 2022/23 | 6.1% | 5.9% |
| 2023/24 | 5.6% | 5.5% |
| 2024/25 | 5.1% | 5.2% |
Sessions missed for any reason, as a share of all possible sessions in the school year. Source: Department for Education, Explore Education Statistics, Pupil absence in schools in England, 2024/25.
Persistent absence
2024/2513.2%
- England
- 13.0%
0.2 percentage points higher than England.
Show the figures as a table
| Year | Doncaster | England |
|---|---|---|
| 2017/18 | 11.1% | 8.7% |
| 2018/19 | 9.6% | 8.2% |
| 2020/21 | 10.6% | 8.8% |
| 2021/22 | 21.1% | 17.7% |
| 2022/23 | 17.4% | 16.2% |
| 2023/24 | 15.8% | 14.6% |
| 2024/25 | 13.2% | 13.0% |
Pupils who missed 10% or more of their possible sessions, as a share of pupils. Source: Department for Education, Explore Education Statistics, Pupil absence in schools in England, 2024/25.
Severe absence
2024/250.7%
- England
- 0.9%
0.2 percentage points lower than England.
Show the figures as a table
| Year | Doncaster | England |
|---|---|---|
| 2017/18 | 0.5% | 0.4% |
| 2018/19 | 0.4% | 0.4% |
| 2020/21 | 1.0% | 0.7% |
| 2021/22 | 0.8% | 0.6% |
| 2022/23 | 0.7% | 0.7% |
| 2023/24 | 0.9% | 0.9% |
| 2024/25 | 0.7% | 0.9% |
Pupils who missed 50% or more of their possible sessions, as a share of pupils. Source: Department for Education, Explore Education Statistics, Pupil absence in schools in England, 2024/25.
Suspensions per 100 pupils
2024/253.51
- England
- 2.47
1.04 higher than England.
Show the figures as a table
| Year | Doncaster | England |
|---|---|---|
| 2017/18 | 2.15 | 1.40 |
| 2018/19 | 3.01 | 1.41 |
| 2019/20 | 1.91 | 1.00 |
| 2020/21 | 1.10 | 0.99 |
| 2021/22 | 2.10 | 1.42 |
| 2022/23 | 3.10 | 1.81 |
| 2023/24 | 3.83 | 2.27 |
| 2024/25 | 3.51 | 2.47 |
Suspensions in the school year for every 100 pupils on roll. One pupil can be suspended more than once. Source: Department for Education, Explore Education Statistics, Suspensions and permanent exclusions in England, 2024/25.
Permanent exclusions per 100 pupils
2024/250.03
- England
- 0.03
The same as England.
Show the figures as a table
| Year | Doncaster | England |
|---|---|---|
| 2017/18 | 0.02 | 0.03 |
| 2018/19 | 0.05 | 0.02 |
| 2019/20 | 0.02 | 0.02 |
| 2020/21 | 0.00 | 0.01 |
| 2021/22 | 0.00 | 0.02 |
| 2022/23 | 0.03 | 0.03 |
| 2023/24 | 0.03 | 0.03 |
| 2024/25 | 0.03 | 0.03 |
Permanent exclusions in the school year for every 100 pupils on roll. Source: Department for Education, Explore Education Statistics, Suspensions and permanent exclusions in England, 2024/25.
Reading, writing and maths: expected standard
2025/26 (provisional)64%
- England
- 63%
1 percentage point higher than England.
Show the figures as a table
| Year | Doncaster | England |
|---|---|---|
| 2021/22 | 56% | 59% |
| 2022/23 | 55% | 60% |
| 2023/24 | 60% | 61% |
| 2024/25 | 63% | 63% |
| 2025/26 (provisional) | 64% | 63% |
Pupils at the end of key stage 2 who met the expected standard in reading, writing and maths combined. Source: Department for Education, Explore Education Statistics, Key stage 2 attainment, 2025/26.
Reading, writing and maths: higher standard
2025/26 (provisional)7%
- England
- 9%
2 percentage points lower than England.
Show the figures as a table
| Year | Doncaster | England |
|---|---|---|
| 2021/22 | 4% | 7% |
| 2022/23 | 5% | 8% |
| 2023/24 | 5% | 8% |
| 2024/25 | 6% | 8% |
| 2025/26 (provisional) | 7% | 9% |
Pupils at the end of key stage 2 who met the higher standard in reading, writing and maths combined. Source: Department for Education, Explore Education Statistics, Key stage 2 attainment, 2025/26.
Eligible for free school meals
2024/2528.2%
- England
- 24.7%
3.5 percentage points higher than England.
Show the figures as a table
| Year | Doncaster | England |
|---|---|---|
| 2021/22 | 27.4% | 23.1% |
| 2022/23 | 28.0% | 24.0% |
| 2023/24 | 28.3% | 24.3% |
| 2024/25 | 28.2% | 24.7% |
Pupils known to be eligible for free school meals on census day in January. Source: Department for Education, Explore Education Statistics, Schools, pupils and their characteristics, 2024/25.
SEN support
2024/2515.2%
- England
- 15.0%
0.2 percentage points higher than England.
Show the figures as a table
| Year | Doncaster | England |
|---|---|---|
| 2021/22 | 14.0% | 13.0% |
| 2022/23 | 14.4% | 13.5% |
| 2023/24 | 14.9% | 14.1% |
| 2024/25 | 15.2% | 15.0% |
Pupils receiving special educational needs support without an education, health and care plan. Source: Department for Education, Explore Education Statistics, Schools, pupils and their characteristics, 2024/25.
Education, health and care plan
2024/252.5%
- England
- 3.5%
1.0 percentage point lower than England.
Show the figures as a table
| Year | Doncaster | England |
|---|---|---|
| 2021/22 | 1.5% | 2.3% |
| 2022/23 | 1.7% | 2.5% |
| 2023/24 | 2.0% | 3.0% |
| 2024/25 | 2.5% | 3.5% |
Pupils with an education, health and care plan. Source: Department for Education, Explore Education Statistics, Schools, pupils and their characteristics, 2024/25.
First language other than English
2024/2516.6%
- England
- 23.4%
6.8 percentage points lower than England.
Show the figures as a table
| Year | Doncaster | England |
|---|---|---|
| 2021/22 | 13.2% | 21.2% |
| 2022/23 | 14.6% | 22.0% |
| 2023/24 | 15.9% | 22.8% |
| 2024/25 | 16.6% | 23.4% |
Pupils whose first language is known or believed to be other than English. Source: Department for Education, Explore Education Statistics, Schools, pupils and their characteristics, 2024/25.
Pupils per qualified teacher
2025/2622.2
- England
- 21.2
1.0 higher than England.
Show the figures as a table
| Year | Doncaster | England |
|---|---|---|
| 2017/18 | 21.8 | 21.3 |
| 2018/19 | 21.9 | 21.4 |
| 2019/20 | 22.2 | 21.4 |
| 2020/21 | 21.7 | 21.1 |
| 2021/22 | 21.6 | 21.0 |
| 2022/23 | 22.0 | 21.1 |
| 2023/24 | 22.2 | 21.2 |
| 2024/25 | 22.6 | 21.3 |
| 2025/26 | 22.2 | 21.2 |
Full-time equivalent pupils for each full-time equivalent qualified teacher. Source: Department for Education, Explore Education Statistics, School workforce in England, 2025/26.
Secondary schools
Overall absence
2024/258.1%
- England
- 8.4%
0.3 percentage points lower than England.
Show the figures as a table
| Year | Doncaster | England |
|---|---|---|
| 2017/18 | 6.9% | 5.5% |
| 2018/19 | 6.5% | 5.5% |
| 2020/21 | 6.6% | 5.5% |
| 2021/22 | 10.4% | 9.0% |
| 2022/23 | 9.8% | 9.0% |
| 2023/24 | 9.4% | 8.9% |
| 2024/25 | 8.1% | 8.4% |
Sessions missed for any reason, as a share of all possible sessions in the school year. Source: Department for Education, Explore Education Statistics, Pupil absence in schools in England, 2024/25.
Persistent absence
2024/2524.2%
- England
- 23.4%
0.8 percentage points higher than England.
Show the figures as a table
| Year | Doncaster | England |
|---|---|---|
| 2017/18 | 18.8% | 13.9% |
| 2018/19 | 17.1% | 13.7% |
| 2020/21 | 18.5% | 14.8% |
| 2021/22 | 32.3% | 27.7% |
| 2022/23 | 28.8% | 26.5% |
| 2023/24 | 27.5% | 25.6% |
| 2024/25 | 24.2% | 23.4% |
Pupils who missed 10% or more of their possible sessions, as a share of pupils. Source: Department for Education, Explore Education Statistics, Pupil absence in schools in England, 2024/25.
Severe absence
2024/254.2%
- England
- 3.9%
0.3 percentage points higher than England.
Show the figures as a table
| Year | Doncaster | England |
|---|---|---|
| 2017/18 | 2.6% | 1.2% |
| 2018/19 | 2.5% | 1.3% |
| 2020/21 | 2.7% | 1.5% |
| 2021/22 | 4.2% | 2.7% |
| 2022/23 | 4.7% | 3.4% |
| 2023/24 | 4.7% | 3.8% |
| 2024/25 | 4.2% | 3.9% |
Pupils who missed 50% or more of their possible sessions, as a share of pupils. Source: Department for Education, Explore Education Statistics, Pupil absence in schools in England, 2024/25.
Suspensions per 100 pupils
2024/2547.34
- England
- 21.24
26.10 higher than England.
Show the figures as a table
| Year | Doncaster | England |
|---|---|---|
| 2017/18 | 57.04 | 10.13 |
| 2018/19 | 46.32 | 10.75 |
| 2019/20 | 32.27 | 7.43 |
| 2020/21 | 29.84 | 8.48 |
| 2021/22 | 48.09 | 13.96 |
| 2022/23 | 56.30 | 18.90 |
| 2023/24 | 54.95 | 22.61 |
| 2024/25 | 47.34 | 21.24 |
Suspensions in the school year for every 100 pupils on roll. One pupil can be suspended more than once. Source: Department for Education, Explore Education Statistics, Suspensions and permanent exclusions in England, 2024/25.
Permanent exclusions per 100 pupils
2024/250.31
- England
- 0.23
0.08 higher than England.
Show the figures as a table
| Year | Doncaster | England |
|---|---|---|
| 2017/18 | 0.21 | 0.20 |
| 2018/19 | 0.49 | 0.20 |
| 2019/20 | 0.24 | 0.13 |
| 2020/21 | 0.12 | 0.10 |
| 2021/22 | 0.22 | 0.16 |
| 2022/23 | 0.38 | 0.22 |
| 2023/24 | 0.38 | 0.25 |
| 2024/25 | 0.31 | 0.23 |
Permanent exclusions in the school year for every 100 pupils on roll. Source: Department for Education, Explore Education Statistics, Suspensions and permanent exclusions in England, 2024/25.
Attainment 8
2025/26 (provisional)46.5
- England
- 47.4
0.9 lower than England.
Show the figures as a table
| Year | Doncaster | England |
|---|---|---|
| 2021/22 | 45.9 | 49.8 |
| 2022/23 | 45.2 | 47.2 |
| 2023/24 | 44.8 | 46.9 |
| 2024/25 | 45.7 | 47.1 |
| 2025/26 (provisional) | 46.5 | 47.4 |
The average of pupils' points across eight GCSE-level qualifications, with English and maths counted twice. Source: Department for Education, Explore Education Statistics, Key stage 4 performance, 2025/26.
English and maths: grade 4 or above
2025/26 (provisional)68%
- England
- 66%
2 percentage points higher than England.
Show the figures as a table
| Year | Doncaster | England |
|---|---|---|
| 2021/22 | 66% | 70% |
| 2022/23 | 64% | 67% |
| 2023/24 | 65% | 67% |
| 2024/25 | 66% | 66% |
| 2025/26 (provisional) | 68% | 66% |
Pupils at the end of key stage 4 with grade 4 or above in both English and maths. Source: Department for Education, Explore Education Statistics, Key stage 4 performance, 2025/26.
English and maths: grade 5 or above
2025/26 (provisional)50%
- England
- 48%
2 percentage points higher than England.
Show the figures as a table
| Year | Doncaster | England |
|---|---|---|
| 2021/22 | 45% | 51% |
| 2022/23 | 42% | 46% |
| 2023/24 | 43% | 47% |
| 2024/25 | 45% | 47% |
| 2025/26 (provisional) | 50% | 48% |
Pupils at the end of key stage 4 with grade 5 or above in both English and maths. Source: Department for Education, Explore Education Statistics, Key stage 4 performance, 2025/26.
Eligible for free school meals
2024/2530.5%
- England
- 25.8%
4.7 percentage points higher than England.
Show the figures as a table
| Year | Doncaster | England |
|---|---|---|
| 2021/22 | 25.3% | 20.9% |
| 2022/23 | 27.4% | 22.7% |
| 2023/24 | 29.0% | 24.1% |
| 2024/25 | 30.5% | 25.8% |
Pupils known to be eligible for free school meals on census day in January. Source: Department for Education, Explore Education Statistics, Schools, pupils and their characteristics, 2024/25.
SEN support
2024/2512.9%
- England
- 13.4%
0.5 percentage points lower than England.
Show the figures as a table
| Year | Doncaster | England |
|---|---|---|
| 2021/22 | 11.4% | 11.9% |
| 2022/23 | 11.8% | 12.4% |
| 2023/24 | 12.6% | 12.9% |
| 2024/25 | 12.9% | 13.4% |
Pupils receiving special educational needs support without an education, health and care plan. Source: Department for Education, Explore Education Statistics, Schools, pupils and their characteristics, 2024/25.
Education, health and care plan
2024/252.1%
- England
- 3.1%
1.0 percentage point lower than England.
Show the figures as a table
| Year | Doncaster | England |
|---|---|---|
| 2021/22 | 1.6% | 2.2% |
| 2022/23 | 1.6% | 2.4% |
| 2023/24 | 2.0% | 2.7% |
| 2024/25 | 2.1% | 3.1% |
Pupils with an education, health and care plan. Source: Department for Education, Explore Education Statistics, Schools, pupils and their characteristics, 2024/25.
First language other than English
2024/2512.6%
- England
- 19.2%
6.6 percentage points lower than England.
Show the figures as a table
| Year | Doncaster | England |
|---|---|---|
| 2021/22 | 10.4% | 17.5% |
| 2022/23 | 11.0% | 18.1% |
| 2023/24 | 11.6% | 18.6% |
| 2024/25 | 12.6% | 19.2% |
Pupils whose first language is known or believed to be other than English. Source: Department for Education, Explore Education Statistics, Schools, pupils and their characteristics, 2024/25.
Pupils per qualified teacher
2025/2617.7
- England
- 17.3
0.4 higher than England.
Show the figures as a table
| Year | Doncaster | England |
|---|---|---|
| 2017/18 | 16.3 | 16.5 |
| 2018/19 | 16.5 | 16.8 |
| 2019/20 | 17.1 | 17.2 |
| 2020/21 | 17.3 | 17.1 |
| 2021/22 | 17.0 | 17.1 |
| 2022/23 | 17.5 | 17.2 |
| 2023/24 | 17.5 | 17.4 |
| 2024/25 | 17.6 | 17.3 |
| 2025/26 | 17.7 | 17.3 |
Full-time equivalent pupils for each full-time equivalent qualified teacher. Source: Department for Education, Explore Education Statistics, School workforce in England, 2025/26.
Special schools
Overall absence
2024/2511.2%
- England
- 12.8%
1.6 percentage points lower than England.
Show the figures as a table
| Year | Doncaster | England |
|---|---|---|
| 2017/18 | 8.2% | 10.2% |
| 2018/19 | 9.2% | 10.1% |
| 2020/21 | 10.8% | 15.2% |
| 2021/22 | 12.1% | 13.2% |
| 2022/23 | 10.9% | 13.0% |
| 2023/24 | 12.0% | 13.0% |
| 2024/25 | 11.2% | 12.8% |
Sessions missed for any reason, as a share of all possible sessions in the school year. Source: Department for Education, Explore Education Statistics, Pupil absence in schools in England, 2024/25.
Persistent absence
2024/2530.9%
- England
- 35.3%
4.4 percentage points lower than England.
Show the figures as a table
| Year | Doncaster | England |
|---|---|---|
| 2017/18 | 24.4% | 29.6% |
| 2018/19 | 25.1% | 28.8% |
| 2020/21 | 32.8% | 48.9% |
| 2021/22 | 37.1% | 40.4% |
| 2022/23 | 32.6% | 38.3% |
| 2023/24 | 34.0% | 37.2% |
| 2024/25 | 30.9% | 35.3% |
Pupils who missed 10% or more of their possible sessions, as a share of pupils. Source: Department for Education, Explore Education Statistics, Pupil absence in schools in England, 2024/25.
Severe absence
2024/254.6%
- England
- 6.9%
2.3 percentage points lower than England.
Show the figures as a table
| Year | Doncaster | England |
|---|---|---|
| 2017/18 | 1.2% | 4.4% |
| 2018/19 | 3.5% | 4.6% |
| 2020/21 | 3.1% | 5.6% |
| 2021/22 | 3.9% | 5.8% |
| 2022/23 | 4.1% | 6.2% |
| 2023/24 | 4.6% | 6.7% |
| 2024/25 | 4.6% | 6.9% |
Pupils who missed 50% or more of their possible sessions, as a share of pupils. Source: Department for Education, Explore Education Statistics, Pupil absence in schools in England, 2024/25.
Suspensions per 100 pupils
2024/259.53
- England
- 12.32
2.79 lower than England.
Show the figures as a table
| Year | Doncaster | England |
|---|---|---|
| 2017/18 | 3.51 | 12.34 |
| 2018/19 | 3.40 | 11.32 |
| 2019/20 | 3.54 | 7.76 |
| 2020/21 | 4.60 | 7.29 |
| 2021/22 | 6.32 | 9.60 |
| 2022/23 | 8.78 | 10.99 |
| 2023/24 | 9.25 | 12.62 |
| 2024/25 | 9.53 | 12.32 |
Suspensions in the school year for every 100 pupils on roll. One pupil can be suspended more than once. Source: Department for Education, Explore Education Statistics, Suspensions and permanent exclusions in England, 2024/25.
Permanent exclusions per 100 pupils
2024/250.00
- England
- 0.08
0.08 lower than England.
Show the figures as a table
| Year | Doncaster | England |
|---|---|---|
| 2017/18 | 0.00 | 0.07 |
| 2018/19 | 0.17 | 0.06 |
| 2019/20 | 0.00 | 0.04 |
| 2020/21 | 0.00 | 0.03 |
| 2021/22 | 0.00 | 0.05 |
| 2022/23 | 0.13 | 0.08 |
| 2023/24 | 0.00 | 0.08 |
| 2024/25 | 0.00 | 0.08 |
Permanent exclusions in the school year for every 100 pupils on roll. Source: Department for Education, Explore Education Statistics, Suspensions and permanent exclusions in England, 2024/25.
Eligible for free school meals
2024/2550.8%
- England
- 48.8%
2.0 percentage points higher than England.
Show the figures as a table
| Year | Doncaster | England |
|---|---|---|
| 2021/22 | 41.3% | 44.4% |
| 2022/23 | 45.2% | 45.6% |
| 2023/24 | 46.0% | 47.1% |
| 2024/25 | 50.8% | 48.8% |
Pupils known to be eligible for free school meals on census day in January. Source: Department for Education, Explore Education Statistics, Schools, pupils and their characteristics, 2024/25.
SEN support
2024/251.0%
- England
- 0.5%
0.5 percentage points higher than England.
Show the figures as a table
| Year | Doncaster | England |
|---|---|---|
| 2021/22 | 0.0% | 0.9% |
| 2022/23 | 0.1% | 0.8% |
| 2023/24 | 0.8% | 0.7% |
| 2024/25 | 1.0% | 0.5% |
Pupils receiving special educational needs support without an education, health and care plan. Source: Department for Education, Explore Education Statistics, Schools, pupils and their characteristics, 2024/25.
Education, health and care plan
2024/2599.0%
- England
- 99.5%
0.5 percentage points lower than England.
Show the figures as a table
| Year | Doncaster | England |
|---|---|---|
| 2021/22 | 100.0% | 99.1% |
| 2022/23 | 99.9% | 99.2% |
| 2023/24 | 99.2% | 99.3% |
| 2024/25 | 99.0% | 99.5% |
Pupils with an education, health and care plan. Source: Department for Education, Explore Education Statistics, Schools, pupils and their characteristics, 2024/25.
First language other than English
2024/258.1%
- England
- 14.4%
6.3 percentage points lower than England.
Show the figures as a table
| Year | Doncaster | England |
|---|---|---|
| 2021/22 | 8.4% | 14.5% |
| 2022/23 | 8.0% | 14.4% |
| 2023/24 | 8.4% | 14.4% |
| 2024/25 | 8.1% | 14.4% |
Pupils whose first language is known or believed to be other than English. Source: Department for Education, Explore Education Statistics, Schools, pupils and their characteristics, 2024/25.
Pupils per qualified teacher
2025/267.4
- England
- 7.3
0.1 higher than England.
Show the figures as a table
| Year | Doncaster | England |
|---|---|---|
| 2017/18 | 6.8 | 6.7 |
| 2018/19 | 7.0 | 6.8 |
| 2019/20 | 6.5 | 7.0 |
| 2020/21 | 6.7 | 6.8 |
| 2021/22 | 7.3 | 6.9 |
| 2022/23 | 7.4 | 7.0 |
| 2023/24 | 7.8 | 7.1 |
| 2024/25 | 7.4 | 7.3 |
| 2025/26 | 7.4 | 7.3 |
Full-time equivalent pupils for each full-time equivalent qualified teacher. Source: Department for Education, Explore Education Statistics, School workforce in England, 2025/26.
Schools in Doncaster
Listed by name. Filter by phase or type; sort by name or size. Nothing here is sorted by results.
Showing 128 of 128 schools in Doncaster.
| School | Phase | Type | Town | Pupils |
|---|---|---|---|---|
| Adwick Primary School | Primary | Academy | Doncaster | 370 |
| Arksey Primary School | Primary | Maintained | Doncaster | 76 |
| Armthorpe Academy | Secondary | Academy | Doncaster | 695 |
| Armthorpe Shaw Wood Academy | Primary | Academy | Doncaster | 462 |
| Ash Hill Academy | Secondary | Academy | DONCASTER | 827 |
| Askern Littlemoor Infant Academy | Primary | Academy | Doncaster | 166 |
| Askern Moss Road Infant Academy | Primary | Academy | Doncaster | 117 |
| Astrea Academy Woodfields | Secondary | Academy | Doncaster | 662 |
| Atlas Academy | Primary | Academy | Doncaster | 423 |
| Auckley Primary Academy | Primary | Academy | Doncaster | 246 |
| Bader Academy | Special | Free school | Doncaster | 131 |
| Balby Central Primary Academy | Primary | Academy | Doncaster | 448 |
| Barnburgh Primary Academy | Primary | Academy | Doncaster | 232 |
| Barnby Dun Primary Academy | Primary | Academy | Doncaster | 230 |
| Bawtry Mayflower Primary School | Primary | Maintained | Doncaster | 216 |
| Bentley High Street Primary School | Primary | Academy | Doncaster | 439 |
| Bentley New Village Primary School | Primary | Maintained | Doncaster | 250 |
| Bessacarr Primary | Primary | Academy | Doncaster | 462 |
| Branton St Wilfrid's Church of England Primary School | Primary | Maintained | Doncaster | 192 |
| Brooke Primary Academy | Primary | Academy | Doncaster | 369 |
| Campsmount Academy | Secondary | Academy | Doncaster | 710 |
| Canon Popham CofE Primary Academy | Primary | Academy | Doncaster | 239 |
| Carcroft Primary School | Primary | Academy | Doncaster | 225 |
| Carr Lodge Academy | Primary | Academy | Doncaster | 448 |
| Castle Academy | Primary | Academy | Doncaster | 143 |
| Conisbrough Ivanhoe Primary Academy | Primary | Academy | Doncaster | 363 |
| Copley Junior School | Primary | Maintained | Doncaster | 194 |
| Coppice School | Special | Academy | Doncaster | 167 |
| Crookesbroom Primary Academy | Primary | Academy | Doncaster | 207 |
| De Warenne Academy | Secondary | Academy | Doncaster | 762 |
| Denaby Main Primary Academy | Primary | Academy | Doncaster | 164 |
| Don Valley Academy | Secondary | Academy | Doncaster | 1,093 |
| Doncaster UTC | Secondary | Free school | Doncaster | 770 |
| Dunsville Primary School | Primary | Academy | Doncaster | 260 |
| Edenthorpe Hall Primary Academy | Primary | Academy | Doncaster | 194 |
| Edlington Victoria Academy | Primary | Academy | Doncaster | 288 |
| Grange Lane Infant Academy | Primary | Academy | Doncaster | 251 |
| Green Top | Primary | Academy | Doncaster | 426 |
| Hall Cross Academy | Secondary | Academy | Doncaster | 2,039 |
| Hatchell Wood Primary Academy | Primary | Academy | Doncaster | 433 |
| Hatfield Woodhouse Primary School | Primary | Academy | Doncaster | 220 |
| Hawthorn Primary School | Primary | Academy | Doncaster | 231 |
| Hayfield Lane Primary School | Primary | Maintained | Doncaster | 439 |
| Heatherwood School | Special | Academy | Doncaster | 99 |
| Hexthorpe Primary School | Primary | Academy | Doncaster | 439 |
| Highfields Primary Academy | Primary | Academy | Doncaster | 101 |
| Highwoods Academy | Primary | Academy | Mexborough | 198 |
| Hill Top Academy | Primary | Academy | Doncaster | 380 |
| Holy Family Catholic Primary School | Primary | Academy | Doncaster | 215 |
| Hooton Pagnell All Saints Church of England Primary School | Primary | Academy | Doncaster | 87 |
| Hungerhill School | Secondary | Academy | Doncaster | 1,175 |
| Intake Primary Academy | Primary | Academy | Doncaster | 269 |
| Kingfisher Primary Academy | Primary | Academy | Doncaster | 432 |
| Kirk Sandall Infant School | Primary | Academy | Doncaster | 222 |
| Kirk Sandall Junior School | Primary | Academy | Doncaster | 309 |
| Kirkby Avenue Primary School | Primary | Maintained | Doncaster | 347 |
| Lakeside Primary Academy | Primary | Academy | Doncaster | 379 |
| Long Toft Primary School | Primary | Maintained | Doncaster | 282 |
| Maple Medical PRU | Alternative provision | Maintained | Doncaster | 24 |
| Marshland Primary Academy | Primary | Academy | Doncaster | 187 |
| Mexborough St John the Baptist CofE Primary School | Primary | Academy | Mexborough | 227 |
| Montagu Academy | Primary | Academy | Mexborough | 352 |
| Morley Place Academy | Primary | Academy | Doncaster | 289 |
| New College Doncaster | 16 to 19 | Free school | Doncaster | 0 |
| New Pastures Primary School | Primary | Academy | Mexborough | 270 |
| North Ridge Community School | Special | Academy | Doncaster | 181 |
| Norton Infant School | Primary | Academy | Doncaster | 220 |
| Norton Junior School | Primary | Academy | Doncaster | 236 |
| Our Lady of Mount Carmel Catholic Primary School | Primary | Academy | Doncaster | 215 |
| Our Lady of Perpetual Help Catholic Primary School | Primary | Maintained | Doncaster | 136 |
| Our Lady of Sorrows Catholic Voluntary Academy | Primary | Academy | Doncaster | 217 |
| Outwood Academy Adwick | Secondary | Academy | Doncaster | 1,048 |
| Outwood Academy Danum | Secondary | Academy | Doncaster | 1,083 |
| Outwood Primary Academy Woodlands | Primary | Academy | Doncaster | 394 |
| Owston Park Primary Academy | Primary | Academy | Doncaster | 445 |
| Park Primary School | Primary | Maintained | Doncaster | 416 |
| Pennine View School | Special | Academy | Doncaster | 167 |
| Pheasant Bank Academy | Primary | Academy | Doncaster | 359 |
| Plover Primary School | Primary | Academy | Doncaster | 408 |
| Richmond Hill Primary Academy | Primary | Academy | Doncaster | 414 |
| Ridgewood School | Secondary | Academy | Doncaster | 1,425 |
| Rosedale Primary School | Primary | Academy | Doncaster | 175 |
| Rossington All Saints Academy | Secondary | Academy | Doncaster | 850 |
| Rossington St Michael's CofE Primary School | Primary | Academy | Doncaster | 371 |
| Rowena Academy | Primary | Academy | Doncaster | 246 |
| Sandringham Primary School | Primary | Academy | Doncaster | 433 |
| Scawsby Junior Academy | Primary | Academy | Doncaster | 355 |
| Scawsby Saltersgate Infant School | Primary | Maintained | Doncaster | 308 |
| Scawthorpe Castle Hills Primary Academy | Primary | Academy | Doncaster | 276 |
| Scawthorpe Sunnyfields Primary School | Primary | Maintained | Doncaster | 302 |
| Sheep Dip Lane Academy | Primary | Academy | Doncaster | 256 |
| Sir Thomas Wharton Academy | Secondary | Academy | Doncaster | 1,226 |
| Southfield Primary | Primary | Academy | Doncaster | 248 |
| Spa Academy Askern | Primary | Academy | Doncaster | 253 |
| Sprotbrough Orchard Infant School | Primary | Maintained | Doncaster | 208 |
| St Alban's Catholic Primary and Nursery School | Primary | Academy | Doncaster | 226 |
| St Francis Xavier Catholic Primary School | Primary | Maintained | Doncaster | 243 |
| St Joseph and St Teresa's Catholic Primary School | Primary | Maintained | Doncaster | 153 |
| St Joseph's School, a Catholic Voluntary Academy | Primary | Academy | Doncaster | 246 |
| St Mary's Catholic Primary School, Edlington | Primary | Maintained | Doncaster | 198 |
| St Oswald's CofE Academy | Primary | Academy | Doncaster | 226 |
| St Peter's Catholic Primary School | Primary | Academy | Doncaster | 204 |
| St Wilfrid's Academy, Doncaster | Alternative provision | Free school | Doncaster | 8 |
| Stainforth Kirton Lane Primary School | Primary | Maintained | Doncaster | 224 |
| Stone Hill School | Special | Maintained special | Doncaster | 182 |
| The Hayfield School | Secondary | Academy | Doncaster | 1,088 |
| The Laurel Academy | Secondary | Academy | Mexborough | 755 |
| The Levett School | Alternative provision | Maintained | Doncaster | 13 |
| The Mallard Academy | Primary | Academy | Doncaster | 356 |
| The McAuley Catholic High School | Secondary | Academy | Doncaster | 1,431 |
| Thorne King Edward Primary School | Primary | Maintained | Doncaster | 336 |
| Tickhill Estfeld Primary School | Primary | Maintained | Doncaster | 218 |
| Tickhill St Mary's Church of England Primary and Nursery School | Primary | Maintained | Doncaster | 226 |
| Toll Bar Primary School | Primary | Maintained | Doncaster | 186 |
| Tornedale Infant Academy | Primary | Academy | Doncaster | 158 |
| Town Field Primary School | Primary | Academy | Doncaster | 464 |
| Tranmoor Primary | Primary | Academy | Doncaster | 426 |
| Travis St Lawrence Church of England Primary School | Primary | Academy | Doncaster | 400 |
| Trinity Academy | Secondary | Academy | Doncaster | 1,176 |
| Wadworth Primary School | Primary | Maintained | Doncaster | 145 |
| Warmsworth Primary School | Primary | Maintained | Doncaster | 461 |
| Waverley Academy | Primary | Academy | Doncaster | 201 |
| West Road Primary Academy | Primary | Academy | Doncaster | 276 |
| Willow Primary School | Primary | Academy | Doncaster | 417 |
| Windhill Primary School | Primary | Maintained | Mexborough | 302 |
| Woodfield Primary School | Primary | Academy | Doncaster | 402 |
| XP East | Secondary | Free school | Doncaster | 273 |
| XP School | Secondary | Free school | Doncaster | 246 |