Cumberland
172 state-funded schools with 38,792 pupils on roll, in the North West region. Every school’s page has its published figures against Cumberland and England.
- Primary
- 145
- Secondary
- 19
- Special
- 3
- Alternative provision
- 2
- Nursery
- 3
- Maintained
- 122
- Academies
- 47
- Free schools
- 2
- Maintained special
- 1
Map
Zoom in to see each school. Open the full map
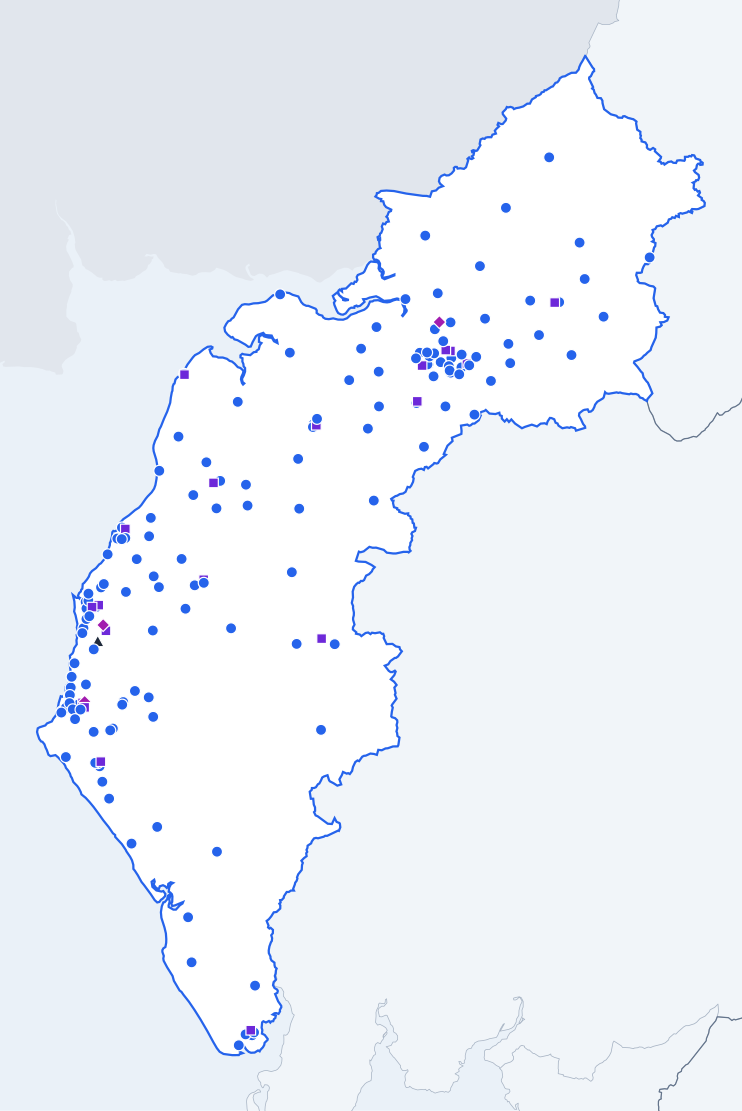
ONS, OS © Crown copyright 2025 · GIAS · © OpenStreetMap
Cumberland against England
Published figures for the authority’s schools, set against the same kind of school across England.
All state-funded schools
Overall absence
2024/256.6%
- England
- 6.8%
0.2 percentage points lower than England.
Show the figures as a table
| Year | Cumberland | England |
|---|---|---|
| 2017/18 | Not published | 4.8% |
| 2018/19 | Not published | 4.7% |
| 2020/21 | Not published | 4.6% |
| 2021/22 | Not published | 7.6% |
| 2022/23 | Not published | 7.4% |
| 2023/24 | 7.2% | 7.1% |
| 2024/25 | 6.6% | 6.8% |
Sessions missed for any reason, as a share of all possible sessions in the school year. Source: Department for Education, Explore Education Statistics, Pupil absence in schools in England, 2024/25.
Persistent absence
2024/2516.3%
- England
- 18.1%
1.8 percentage points lower than England.
Show the figures as a table
| Year | Cumberland | England |
|---|---|---|
| 2017/18 | Not published | 11.2% |
| 2018/19 | Not published | 10.9% |
| 2020/21 | Not published | 12.1% |
| 2021/22 | Not published | 22.5% |
| 2022/23 | Not published | 21.2% |
| 2023/24 | 19.7% | 20.0% |
| 2024/25 | 16.3% | 18.1% |
Pupils who missed 10% or more of their possible sessions, as a share of pupils. Source: Department for Education, Explore Education Statistics, Pupil absence in schools in England, 2024/25.
Severe absence
2024/252.2%
- England
- 2.4%
0.2 percentage points lower than England.
Show the figures as a table
| Year | Cumberland | England |
|---|---|---|
| 2017/18 | Not published | 0.8% |
| 2018/19 | Not published | 0.8% |
| 2020/21 | Not published | 1.1% |
| 2021/22 | Not published | 1.7% |
| 2022/23 | Not published | 2.0% |
| 2023/24 | 2.2% | 2.3% |
| 2024/25 | 2.2% | 2.4% |
Pupils who missed 50% or more of their possible sessions, as a share of pupils. Source: Department for Education, Explore Education Statistics, Pupil absence in schools in England, 2024/25.
Suspensions per 100 pupils
2024/258.62
- England
- 10.88
2.26 lower than England.
Show the figures as a table
| Year | Cumberland | England |
|---|---|---|
| 2017/18 | Not published | 5.08 |
| 2018/19 | Not published | 5.36 |
| 2019/20 | Not published | 3.76 |
| 2020/21 | Not published | 4.25 |
| 2021/22 | Not published | 6.91 |
| 2022/23 | Not published | 9.33 |
| 2023/24 | 8.91 | 11.31 |
| 2024/25 | 8.62 | 10.88 |
Suspensions in the school year for every 100 pupils on roll. One pupil can be suspended more than once. Source: Department for Education, Explore Education Statistics, Suspensions and permanent exclusions in England, 2024/25.
Permanent exclusions per 100 pupils
2024/250.10
- England
- 0.12
0.02 lower than England.
Show the figures as a table
| Year | Cumberland | England |
|---|---|---|
| 2017/18 | Not published | 0.10 |
| 2018/19 | Not published | 0.10 |
| 2019/20 | Not published | 0.06 |
| 2020/21 | Not published | 0.05 |
| 2021/22 | Not published | 0.08 |
| 2022/23 | Not published | 0.11 |
| 2023/24 | 0.18 | 0.13 |
| 2024/25 | 0.10 | 0.12 |
Permanent exclusions in the school year for every 100 pupils on roll. Source: Department for Education, Explore Education Statistics, Suspensions and permanent exclusions in England, 2024/25.
Eligible for free school meals
2024/2521.7%
- England
- 25.7%
4.0 percentage points lower than England.
Show the figures as a table
| Year | Cumberland | England |
|---|---|---|
| 2021/22 | Not published | 22.5% |
| 2022/23 | Not published | 23.8% |
| 2023/24 | 21.2% | 24.6% |
| 2024/25 | 21.7% | 25.7% |
Pupils known to be eligible for free school meals on census day in January. Source: Department for Education, Explore Education Statistics, Schools, pupils and their characteristics, 2024/25.
SEN support
2024/2513.7%
- England
- 14.0%
0.3 percentage points lower than England.
Show the figures as a table
| Year | Cumberland | England |
|---|---|---|
| 2021/22 | Not published | 12.4% |
| 2022/23 | Not published | 12.9% |
| 2023/24 | 13.1% | 13.4% |
| 2024/25 | 13.7% | 14.0% |
Pupils receiving special educational needs support without an education, health and care plan. Source: Department for Education, Explore Education Statistics, Schools, pupils and their characteristics, 2024/25.
Education, health and care plan
2024/255.6%
- England
- 5.2%
0.4 percentage points higher than England.
Show the figures as a table
| Year | Cumberland | England |
|---|---|---|
| 2021/22 | Not published | 3.8% |
| 2022/23 | Not published | 4.2% |
| 2023/24 | 5.1% | 4.7% |
| 2024/25 | 5.6% | 5.2% |
Pupils with an education, health and care plan. Source: Department for Education, Explore Education Statistics, Schools, pupils and their characteristics, 2024/25.
First language other than English
2024/255.7%
- England
- 21.4%
15.7 percentage points lower than England.
Show the figures as a table
| Year | Cumberland | England |
|---|---|---|
| 2021/22 | Not published | 19.6% |
| 2022/23 | Not published | 20.2% |
| 2023/24 | 5.1% | 20.8% |
| 2024/25 | 5.7% | 21.4% |
Pupils whose first language is known or believed to be other than English. Source: Department for Education, Explore Education Statistics, Schools, pupils and their characteristics, 2024/25.
Pupils per qualified teacher
2025/2618.0
- England
- 18.5
0.5 lower than England.
Show the figures as a table
| Year | Cumberland | England |
|---|---|---|
| 2017/18 | Not published | 18.4 |
| 2018/19 | Not published | 18.6 |
| 2019/20 | Not published | 18.8 |
| 2020/21 | Not published | 18.5 |
| 2021/22 | Not published | 18.5 |
| 2022/23 | Not published | 18.5 |
| 2023/24 | 18.0 | 18.6 |
| 2024/25 | 17.8 | 18.6 |
| 2025/26 | 18.0 | 18.5 |
Full-time equivalent pupils for each full-time equivalent qualified teacher. Source: Department for Education, Explore Education Statistics, School workforce in England, 2025/26.
Teacher sickness absence
2024/254.8 days
- England
- 5.0 days
0.2 days lower than England.
Show the figures as a table
| Year | Cumberland | England |
|---|---|---|
| 2017/18 | Not published | 4.0 days |
| 2018/19 | Not published | 4.0 days |
| 2019/20 | Not published | Not published |
| 2020/21 | Not published | 3.9 days |
| 2021/22 | Not published | 6.3 days |
| 2022/23 | 4.6 days | 5.2 days |
| 2023/24 | 4.7 days | 5.3 days |
| 2024/25 | 4.8 days | 5.0 days |
Days lost to sickness absence in the school year, averaged across all teachers. Source: Department for Education, Explore Education Statistics, School workforce in England, 2024/25.
Primary schools
Overall absence
2024/254.8%
- England
- 5.2%
0.4 percentage points lower than England.
Show the figures as a table
| Year | Cumberland | England |
|---|---|---|
| 2017/18 | Not published | 4.2% |
| 2018/19 | Not published | 4.0% |
| 2020/21 | Not published | 3.6% |
| 2021/22 | Not published | 6.3% |
| 2022/23 | Not published | 5.9% |
| 2023/24 | 5.3% | 5.5% |
| 2024/25 | 4.8% | 5.2% |
Sessions missed for any reason, as a share of all possible sessions in the school year. Source: Department for Education, Explore Education Statistics, Pupil absence in schools in England, 2024/25.
Persistent absence
2024/2510.2%
- England
- 13.0%
2.8 percentage points lower than England.
Show the figures as a table
| Year | Cumberland | England |
|---|---|---|
| 2017/18 | Not published | 8.7% |
| 2018/19 | Not published | 8.2% |
| 2020/21 | Not published | 8.8% |
| 2021/22 | Not published | 17.7% |
| 2022/23 | Not published | 16.2% |
| 2023/24 | 13.2% | 14.6% |
| 2024/25 | 10.2% | 13.0% |
Pupils who missed 10% or more of their possible sessions, as a share of pupils. Source: Department for Education, Explore Education Statistics, Pupil absence in schools in England, 2024/25.
Severe absence
2024/250.5%
- England
- 0.9%
0.4 percentage points lower than England.
Show the figures as a table
| Year | Cumberland | England |
|---|---|---|
| 2017/18 | Not published | 0.4% |
| 2018/19 | Not published | 0.4% |
| 2020/21 | Not published | 0.7% |
| 2021/22 | Not published | 0.6% |
| 2022/23 | Not published | 0.7% |
| 2023/24 | 0.4% | 0.9% |
| 2024/25 | 0.5% | 0.9% |
Pupils who missed 50% or more of their possible sessions, as a share of pupils. Source: Department for Education, Explore Education Statistics, Pupil absence in schools in England, 2024/25.
Suspensions per 100 pupils
2024/251.65
- England
- 2.47
0.82 lower than England.
Show the figures as a table
| Year | Cumberland | England |
|---|---|---|
| 2017/18 | Not published | 1.40 |
| 2018/19 | Not published | 1.41 |
| 2019/20 | Not published | 1.00 |
| 2020/21 | Not published | 0.99 |
| 2021/22 | Not published | 1.42 |
| 2022/23 | Not published | 1.81 |
| 2023/24 | 2.11 | 2.27 |
| 2024/25 | 1.65 | 2.47 |
Suspensions in the school year for every 100 pupils on roll. One pupil can be suspended more than once. Source: Department for Education, Explore Education Statistics, Suspensions and permanent exclusions in England, 2024/25.
Permanent exclusions per 100 pupils
2024/250.04
- England
- 0.03
0.01 higher than England.
Show the figures as a table
| Year | Cumberland | England |
|---|---|---|
| 2017/18 | Not published | 0.03 |
| 2018/19 | Not published | 0.02 |
| 2019/20 | Not published | 0.02 |
| 2020/21 | Not published | 0.01 |
| 2021/22 | Not published | 0.02 |
| 2022/23 | Not published | 0.03 |
| 2023/24 | 0.02 | 0.03 |
| 2024/25 | 0.04 | 0.03 |
Permanent exclusions in the school year for every 100 pupils on roll. Source: Department for Education, Explore Education Statistics, Suspensions and permanent exclusions in England, 2024/25.
Reading, writing and maths: expected standard
2025/26 (provisional)55%
- England
- 63%
8 percentage points lower than England.
Show the figures as a table
| Year | Cumberland | England |
|---|---|---|
| 2021/22 | Not published | 59% |
| 2022/23 | 54% | 60% |
| 2023/24 | 54% | 61% |
| 2024/25 | 56% | 63% |
| 2025/26 (provisional) | 55% | 63% |
Pupils at the end of key stage 2 who met the expected standard in reading, writing and maths combined. Source: Department for Education, Explore Education Statistics, Key stage 2 attainment, 2025/26.
Reading, writing and maths: higher standard
2025/26 (provisional)6%
- England
- 9%
3 percentage points lower than England.
Show the figures as a table
| Year | Cumberland | England |
|---|---|---|
| 2021/22 | Not published | 7% |
| 2022/23 | 5% | 8% |
| 2023/24 | 6% | 8% |
| 2024/25 | 5% | 8% |
| 2025/26 (provisional) | 6% | 9% |
Pupils at the end of key stage 2 who met the higher standard in reading, writing and maths combined. Source: Department for Education, Explore Education Statistics, Key stage 2 attainment, 2025/26.
Eligible for free school meals
2024/2520.1%
- England
- 24.7%
4.6 percentage points lower than England.
Show the figures as a table
| Year | Cumberland | England |
|---|---|---|
| 2021/22 | Not published | 23.1% |
| 2022/23 | Not published | 24.0% |
| 2023/24 | 20.2% | 24.3% |
| 2024/25 | 20.1% | 24.7% |
Pupils known to be eligible for free school meals on census day in January. Source: Department for Education, Explore Education Statistics, Schools, pupils and their characteristics, 2024/25.
SEN support
2024/2513.4%
- England
- 15.0%
1.6 percentage points lower than England.
Show the figures as a table
| Year | Cumberland | England |
|---|---|---|
| 2021/22 | Not published | 13.0% |
| 2022/23 | Not published | 13.5% |
| 2023/24 | 13.0% | 14.1% |
| 2024/25 | 13.4% | 15.0% |
Pupils receiving special educational needs support without an education, health and care plan. Source: Department for Education, Explore Education Statistics, Schools, pupils and their characteristics, 2024/25.
Education, health and care plan
2024/254.4%
- England
- 3.5%
0.9 percentage points higher than England.
Show the figures as a table
| Year | Cumberland | England |
|---|---|---|
| 2021/22 | Not published | 2.3% |
| 2022/23 | Not published | 2.5% |
| 2023/24 | 3.9% | 3.0% |
| 2024/25 | 4.4% | 3.5% |
Pupils with an education, health and care plan. Source: Department for Education, Explore Education Statistics, Schools, pupils and their characteristics, 2024/25.
First language other than English
2024/256.4%
- England
- 23.4%
17.0 percentage points lower than England.
Show the figures as a table
| Year | Cumberland | England |
|---|---|---|
| 2021/22 | Not published | 21.2% |
| 2022/23 | Not published | 22.0% |
| 2023/24 | 5.6% | 22.8% |
| 2024/25 | 6.4% | 23.4% |
Pupils whose first language is known or believed to be other than English. Source: Department for Education, Explore Education Statistics, Schools, pupils and their characteristics, 2024/25.
Pupils per qualified teacher
2025/2619.1
- England
- 21.2
2.1 lower than England.
Show the figures as a table
| Year | Cumberland | England |
|---|---|---|
| 2017/18 | Not published | 21.3 |
| 2018/19 | Not published | 21.4 |
| 2019/20 | Not published | 21.4 |
| 2020/21 | Not published | 21.1 |
| 2021/22 | Not published | 21.0 |
| 2022/23 | Not published | 21.1 |
| 2023/24 | 19.1 | 21.2 |
| 2024/25 | 19.0 | 21.3 |
| 2025/26 | 19.1 | 21.2 |
Full-time equivalent pupils for each full-time equivalent qualified teacher. Source: Department for Education, Explore Education Statistics, School workforce in England, 2025/26.
Secondary schools
Overall absence
2024/258.7%
- England
- 8.4%
0.3 percentage points higher than England.
Show the figures as a table
| Year | Cumberland | England |
|---|---|---|
| 2017/18 | Not published | 5.5% |
| 2018/19 | Not published | 5.5% |
| 2020/21 | Not published | 5.5% |
| 2021/22 | Not published | 9.0% |
| 2022/23 | Not published | 9.0% |
| 2023/24 | 9.5% | 8.9% |
| 2024/25 | 8.7% | 8.4% |
Sessions missed for any reason, as a share of all possible sessions in the school year. Source: Department for Education, Explore Education Statistics, Pupil absence in schools in England, 2024/25.
Persistent absence
2024/2523.2%
- England
- 23.4%
0.2 percentage points lower than England.
Show the figures as a table
| Year | Cumberland | England |
|---|---|---|
| 2017/18 | Not published | 13.9% |
| 2018/19 | Not published | 13.7% |
| 2020/21 | Not published | 14.8% |
| 2021/22 | Not published | 27.7% |
| 2022/23 | Not published | 26.5% |
| 2023/24 | 26.9% | 25.6% |
| 2024/25 | 23.2% | 23.4% |
Pupils who missed 10% or more of their possible sessions, as a share of pupils. Source: Department for Education, Explore Education Statistics, Pupil absence in schools in England, 2024/25.
Severe absence
2024/254.1%
- England
- 3.9%
0.2 percentage points higher than England.
Show the figures as a table
| Year | Cumberland | England |
|---|---|---|
| 2017/18 | Not published | 1.2% |
| 2018/19 | Not published | 1.3% |
| 2020/21 | Not published | 1.5% |
| 2021/22 | Not published | 2.7% |
| 2022/23 | Not published | 3.4% |
| 2023/24 | 4.3% | 3.8% |
| 2024/25 | 4.1% | 3.9% |
Pupils who missed 50% or more of their possible sessions, as a share of pupils. Source: Department for Education, Explore Education Statistics, Pupil absence in schools in England, 2024/25.
Suspensions per 100 pupils
2024/2517.86
- England
- 21.24
3.38 lower than England.
Show the figures as a table
| Year | Cumberland | England |
|---|---|---|
| 2017/18 | Not published | 10.13 |
| 2018/19 | Not published | 10.75 |
| 2019/20 | Not published | 7.43 |
| 2020/21 | Not published | 8.48 |
| 2021/22 | Not published | 13.96 |
| 2022/23 | Not published | 18.90 |
| 2023/24 | 18.00 | 22.61 |
| 2024/25 | 17.86 | 21.24 |
Suspensions in the school year for every 100 pupils on roll. One pupil can be suspended more than once. Source: Department for Education, Explore Education Statistics, Suspensions and permanent exclusions in England, 2024/25.
Permanent exclusions per 100 pupils
2024/250.18
- England
- 0.23
0.05 lower than England.
Show the figures as a table
| Year | Cumberland | England |
|---|---|---|
| 2017/18 | Not published | 0.20 |
| 2018/19 | Not published | 0.20 |
| 2019/20 | Not published | 0.13 |
| 2020/21 | Not published | 0.10 |
| 2021/22 | Not published | 0.16 |
| 2022/23 | Not published | 0.22 |
| 2023/24 | 0.39 | 0.25 |
| 2024/25 | 0.18 | 0.23 |
Permanent exclusions in the school year for every 100 pupils on roll. Source: Department for Education, Explore Education Statistics, Suspensions and permanent exclusions in England, 2024/25.
Attainment 8
2025/26 (provisional)41.4
- England
- 47.4
6.0 lower than England.
Show the figures as a table
| Year | Cumberland | England |
|---|---|---|
| 2021/22 | Not published | 49.8 |
| 2022/23 | 43.7 | 47.2 |
| 2023/24 | 42.8 | 46.9 |
| 2024/25 | 42.7 | 47.1 |
| 2025/26 (provisional) | 41.4 | 47.4 |
The average of pupils' points across eight GCSE-level qualifications, with English and maths counted twice. Source: Department for Education, Explore Education Statistics, Key stage 4 performance, 2025/26.
English and maths: grade 4 or above
2025/26 (provisional)56%
- England
- 66%
10 percentage points lower than England.
Show the figures as a table
| Year | Cumberland | England |
|---|---|---|
| 2021/22 | Not published | 70% |
| 2022/23 | 61% | 67% |
| 2023/24 | 60% | 67% |
| 2024/25 | 58% | 66% |
| 2025/26 (provisional) | 56% | 66% |
Pupils at the end of key stage 4 with grade 4 or above in both English and maths. Source: Department for Education, Explore Education Statistics, Key stage 4 performance, 2025/26.
English and maths: grade 5 or above
2025/26 (provisional)34%
- England
- 48%
14 percentage points lower than England.
Show the figures as a table
| Year | Cumberland | England |
|---|---|---|
| 2021/22 | Not published | 51% |
| 2022/23 | 38% | 46% |
| 2023/24 | 39% | 47% |
| 2024/25 | 37% | 47% |
| 2025/26 (provisional) | 34% | 48% |
Pupils at the end of key stage 4 with grade 5 or above in both English and maths. Source: Department for Education, Explore Education Statistics, Key stage 4 performance, 2025/26.
Eligible for free school meals
2024/2523.2%
- England
- 25.8%
2.6 percentage points lower than England.
Show the figures as a table
| Year | Cumberland | England |
|---|---|---|
| 2021/22 | Not published | 20.9% |
| 2022/23 | Not published | 22.7% |
| 2023/24 | 21.9% | 24.1% |
| 2024/25 | 23.2% | 25.8% |
Pupils known to be eligible for free school meals on census day in January. Source: Department for Education, Explore Education Statistics, Schools, pupils and their characteristics, 2024/25.
SEN support
2024/2514.2%
- England
- 13.4%
0.8 percentage points higher than England.
Show the figures as a table
| Year | Cumberland | England |
|---|---|---|
| 2021/22 | Not published | 11.9% |
| 2022/23 | Not published | 12.4% |
| 2023/24 | 13.2% | 12.9% |
| 2024/25 | 14.2% | 13.4% |
Pupils receiving special educational needs support without an education, health and care plan. Source: Department for Education, Explore Education Statistics, Schools, pupils and their characteristics, 2024/25.
Education, health and care plan
2024/254.1%
- England
- 3.1%
1.0 percentage point higher than England.
Show the figures as a table
| Year | Cumberland | England |
|---|---|---|
| 2021/22 | Not published | 2.2% |
| 2022/23 | Not published | 2.4% |
| 2023/24 | 3.8% | 2.7% |
| 2024/25 | 4.1% | 3.1% |
Pupils with an education, health and care plan. Source: Department for Education, Explore Education Statistics, Schools, pupils and their characteristics, 2024/25.
First language other than English
2024/254.9%
- England
- 19.2%
14.3 percentage points lower than England.
Show the figures as a table
| Year | Cumberland | England |
|---|---|---|
| 2021/22 | Not published | 17.5% |
| 2022/23 | Not published | 18.1% |
| 2023/24 | 4.5% | 18.6% |
| 2024/25 | 4.9% | 19.2% |
Pupils whose first language is known or believed to be other than English. Source: Department for Education, Explore Education Statistics, Schools, pupils and their characteristics, 2024/25.
Pupils per qualified teacher
2025/2617.7
- England
- 17.3
0.4 higher than England.
Show the figures as a table
| Year | Cumberland | England |
|---|---|---|
| 2017/18 | Not published | 16.5 |
| 2018/19 | Not published | 16.8 |
| 2019/20 | Not published | 17.2 |
| 2020/21 | Not published | 17.1 |
| 2021/22 | Not published | 17.1 |
| 2022/23 | Not published | 17.2 |
| 2023/24 | 17.8 | 17.4 |
| 2024/25 | 17.3 | 17.3 |
| 2025/26 | 17.7 | 17.3 |
Full-time equivalent pupils for each full-time equivalent qualified teacher. Source: Department for Education, Explore Education Statistics, School workforce in England, 2025/26.
Special schools
Overall absence
2024/259.3%
- England
- 12.8%
3.5 percentage points lower than England.
Show the figures as a table
| Year | Cumberland | England |
|---|---|---|
| 2017/18 | Not published | 10.2% |
| 2018/19 | Not published | 10.1% |
| 2020/21 | Not published | 15.2% |
| 2021/22 | Not published | 13.2% |
| 2022/23 | Not published | 13.0% |
| 2023/24 | 9.5% | 13.0% |
| 2024/25 | 9.3% | 12.8% |
Sessions missed for any reason, as a share of all possible sessions in the school year. Source: Department for Education, Explore Education Statistics, Pupil absence in schools in England, 2024/25.
Persistent absence
2024/2522.7%
- England
- 35.3%
12.6 percentage points lower than England.
Show the figures as a table
| Year | Cumberland | England |
|---|---|---|
| 2017/18 | Not published | 29.6% |
| 2018/19 | Not published | 28.8% |
| 2020/21 | Not published | 48.9% |
| 2021/22 | Not published | 40.4% |
| 2022/23 | Not published | 38.3% |
| 2023/24 | 28.7% | 37.2% |
| 2024/25 | 22.7% | 35.3% |
Pupils who missed 10% or more of their possible sessions, as a share of pupils. Source: Department for Education, Explore Education Statistics, Pupil absence in schools in England, 2024/25.
Severe absence
2024/253.0%
- England
- 6.9%
3.9 percentage points lower than England.
Show the figures as a table
| Year | Cumberland | England |
|---|---|---|
| 2017/18 | Not published | 4.4% |
| 2018/19 | Not published | 4.6% |
| 2020/21 | Not published | 5.6% |
| 2021/22 | Not published | 5.8% |
| 2022/23 | Not published | 6.2% |
| 2023/24 | 3.0% | 6.7% |
| 2024/25 | 3.0% | 6.9% |
Pupils who missed 50% or more of their possible sessions, as a share of pupils. Source: Department for Education, Explore Education Statistics, Pupil absence in schools in England, 2024/25.
Suspensions per 100 pupils
2024/250.38
- England
- 12.32
11.94 lower than England.
Show the figures as a table
| Year | Cumberland | England |
|---|---|---|
| 2017/18 | Not published | 12.34 |
| 2018/19 | Not published | 11.32 |
| 2019/20 | Not published | 7.76 |
| 2020/21 | Not published | 7.29 |
| 2021/22 | Not published | 9.60 |
| 2022/23 | Not published | 10.99 |
| 2023/24 | 0.21 | 12.62 |
| 2024/25 | 0.38 | 12.32 |
Suspensions in the school year for every 100 pupils on roll. One pupil can be suspended more than once. Source: Department for Education, Explore Education Statistics, Suspensions and permanent exclusions in England, 2024/25.
Permanent exclusions per 100 pupils
2024/250.00
- England
- 0.08
0.08 lower than England.
Show the figures as a table
| Year | Cumberland | England |
|---|---|---|
| 2017/18 | Not published | 0.07 |
| 2018/19 | Not published | 0.06 |
| 2019/20 | Not published | 0.04 |
| 2020/21 | Not published | 0.03 |
| 2021/22 | Not published | 0.05 |
| 2022/23 | Not published | 0.08 |
| 2023/24 | 0.00 | 0.08 |
| 2024/25 | 0.00 | 0.08 |
Permanent exclusions in the school year for every 100 pupils on roll. Source: Department for Education, Explore Education Statistics, Suspensions and permanent exclusions in England, 2024/25.
Eligible for free school meals
2024/2538.0%
- England
- 48.8%
10.8 percentage points lower than England.
Show the figures as a table
| Year | Cumberland | England |
|---|---|---|
| 2021/22 | Not published | 44.4% |
| 2022/23 | Not published | 45.6% |
| 2023/24 | 35.7% | 47.1% |
| 2024/25 | 38.0% | 48.8% |
Pupils known to be eligible for free school meals on census day in January. Source: Department for Education, Explore Education Statistics, Schools, pupils and their characteristics, 2024/25.
SEN support
2024/250.0%
- England
- 0.5%
0.5 percentage points lower than England.
Show the figures as a table
| Year | Cumberland | England |
|---|---|---|
| 2021/22 | Not published | 0.9% |
| 2022/23 | Not published | 0.8% |
| 2023/24 | 0.2% | 0.7% |
| 2024/25 | 0.0% | 0.5% |
Pupils receiving special educational needs support without an education, health and care plan. Source: Department for Education, Explore Education Statistics, Schools, pupils and their characteristics, 2024/25.
Education, health and care plan
2024/25100.0%
- England
- 99.5%
0.5 percentage points higher than England.
Show the figures as a table
| Year | Cumberland | England |
|---|---|---|
| 2021/22 | Not published | 99.1% |
| 2022/23 | Not published | 99.2% |
| 2023/24 | 99.8% | 99.3% |
| 2024/25 | 100.0% | 99.5% |
Pupils with an education, health and care plan. Source: Department for Education, Explore Education Statistics, Schools, pupils and their characteristics, 2024/25.
First language other than English
2024/253.2%
- England
- 14.4%
11.2 percentage points lower than England.
Show the figures as a table
| Year | Cumberland | England |
|---|---|---|
| 2021/22 | Not published | 14.5% |
| 2022/23 | Not published | 14.4% |
| 2023/24 | 3.3% | 14.4% |
| 2024/25 | 3.2% | 14.4% |
Pupils whose first language is known or believed to be other than English. Source: Department for Education, Explore Education Statistics, Schools, pupils and their characteristics, 2024/25.
Pupils per qualified teacher
2025/266.9
- England
- 7.3
0.4 lower than England.
Show the figures as a table
| Year | Cumberland | England |
|---|---|---|
| 2017/18 | Not published | 6.7 |
| 2018/19 | Not published | 6.8 |
| 2019/20 | Not published | 7.0 |
| 2020/21 | Not published | 6.8 |
| 2021/22 | Not published | 6.9 |
| 2022/23 | Not published | 7.0 |
| 2023/24 | 6.9 | 7.1 |
| 2024/25 | 6.8 | 7.3 |
| 2025/26 | 6.9 | 7.3 |
Full-time equivalent pupils for each full-time equivalent qualified teacher. Source: Department for Education, Explore Education Statistics, School workforce in England, 2025/26.
Schools in Cumberland
Listed by name. Filter by phase or type; sort by name or size. Nothing here is sorted by results.
Showing 172 of 172 schools in Cumberland.
| School | Phase | Type | Town | Pupils |
|---|---|---|---|---|
| All Saints' CofE School | Primary | Academy | Cockermouth | Not published |
| Allonby Primary School | Primary | Maintained | Maryport | 27 |
| Arlecdon Primary School | Primary | Academy | FRIZINGTON | 46 |
| Ashfield Infant & Nursery School | Primary | Maintained | Workington | 200 |
| Ashfield Junior School | Primary | Maintained | Workington | 254 |
| Bassenthwaite Primary School | Primary | Academy | Keswick | 24 |
| Beacon Hill Community School | Secondary | Maintained | Wigton | 135 |
| Beckermet CofE School | Primary | Maintained | Beckermet | 73 |
| Beckstone Primary School | Primary | Maintained | Workington | 375 |
| Belle Vue Primary School | Primary | Maintained | Carlisle | 426 |
| Bewcastle School | Primary | Maintained | Carlisle | 19 |
| Black Combe Junior School | Primary | Maintained | Millom | 89 |
| Blackford CofE Primary School | Primary | Maintained | Carlisle | 60 |
| Blennerhasset School | Primary | Maintained | Wigton | 60 |
| Boltons CofE School | Primary | Maintained | Wigton | 86 |
| Bookwell Primary School | Primary | Maintained | Egremont | 194 |
| Borrowdale CofE Primary School | Primary | Maintained | Keswick | 31 |
| Bowness-on-Solway Primary School | Primary | Maintained | Wigton | 40 |
| Braithwaite CofE Primary School | Primary | Academy | Keswick | 40 |
| Brampton Primary School | Primary | Maintained | Brampton | 200 |
| Bransty Primary School | Primary | Maintained | Whitehaven | 205 |
| Branthwaite Academy | Special | Free school | Workington | 74 |
| Bridekirk Dovenby CofE Primary School | Primary | Maintained | Cockermouth | 146 |
| Brook Street Primary School | Primary | Maintained | Carlisle | 228 |
| Broughton Moor Primary School | Primary | Academy | Maryport | Not published |
| Broughton Primary School | Primary | Academy | Cockermouth | 146 |
| Burgh by Sands School | Primary | Maintained | Carlisle | 91 |
| Caldew Lea School | Primary | Academy | Carlisle | 273 |
| Caldew School | Secondary | Academy | Carlisle | 990 |
| Captain Shaw's CofE School | Primary | Maintained | Millom | 24 |
| Castle Carrock School | Primary | Academy | Brampton | 43 |
| Cleator Moor Nursery School | Nursery | Maintained | Cleator Moor | 65 |
| Cockermouth School | Secondary | Academy | Cockermouth | 1,254 |
| Crosby-on-Eden CofE School | Primary | Academy | Carlisle | 93 |
| Crosscanonby St John's CofE School | Primary | Maintained | Maryport | 51 |
| Cummersdale School | Primary | Maintained | Carlisle | 97 |
| Cumwhinton School | Primary | Maintained | Carlisle | 198 |
| Dean CofE School | Primary | Academy | Workington | 96 |
| Dearham Primary School | Primary | Academy | Maryport | 202 |
| Derwent Vale Primary and Nursery School | Primary | Maintained | Workington | 93 |
| Distington Community School | Primary | Maintained | Workington | 114 |
| Eaglesfield Paddle CofE Primary Academy | Primary | Academy | Cockermouth | 193 |
| Ellenborough Academy | Primary | Academy | Maryport | 50 |
| Energy Coast UTC | Secondary | Free school | Workington | 383 |
| Ennerdale and Kinniside CofE Primary School | Primary | Maintained | Cleator | 36 |
| Ewanrigg Junior School | Primary | Maintained | Maryport | 133 |
| Fairfield Primary School | Primary | Academy | Cockermouth | 455 |
| Fellview Primary School | Primary | Maintained | Wigton | 40 |
| Fir Ends Primary School | Primary | Maintained | Brampton | 87 |
| Flimby Primary School | Primary | Academy | Maryport | 112 |
| Frizington Community Primary School | Primary | Maintained | Frizington | 109 |
| Frizington Nursery School | Nursery | Maintained | Frizington | 95 |
| Gillford Centre | Alternative provision | Maintained | Carlisle | 56 |
| Gilsland CofE Primary School | Primary | Academy | Brampton | 18 |
| Gosforth CofE Primary School and Nursery | Primary | Maintained | Seascale | 96 |
| Grasslot Infant School | Primary | Maintained | Maryport | 65 |
| Great Corby School and Nursery | Primary | Academy | Carlisle | 99 |
| Great Orton Primary School | Primary | Maintained | Carlisle | 35 |
| Hallbankgate Village School | Primary | Maintained | Brampton | 45 |
| Haverigg Primary School | Primary | Maintained | Millom | 177 |
| Hayton CofE Primary School | Primary | Maintained | Brampton | 142 |
| Hensingham Primary School | Primary | Academy | Whitehaven | 120 |
| Holm Cultram Abbey CofE Primary School | Primary | Maintained | Wigton | 43 |
| Holme St Cuthbert School | Primary | Maintained | Maryport | 21 |
| Houghton CofE School | Primary | Maintained | Carlisle | 179 |
| Inglewood Infant School | Primary | Maintained | Carlisle | 267 |
| Inglewood Junior School | Primary | Maintained | Carlisle | 229 |
| Ireby CofE School | Primary | Maintained | Wigton | 38 |
| Irthington Village School | Primary | Maintained | Carlisle | 66 |
| James Rennie School | Special | Academy | Carlisle | 217 |
| Jericho Primary School | Primary | Maintained | Whitehaven | 363 |
| Kells Infant School | Primary | Maintained | Whitehaven | 130 |
| Keswick School | Secondary | Academy | Keswick | 1,208 |
| Kingmoor Junior School | Primary | Maintained | Carlisle | 316 |
| Kingmoor Nursery and Infant School | Primary | Maintained | Carlisle | 312 |
| Kirkbampton CofE School | Primary | Maintained | Carlisle | 94 |
| Kirkbride Primary School | Primary | Maintained | Wigton | 77 |
| Kirkland Church of England Academy | Primary | Academy | Frizington | 42 |
| Lanercost CofE Primary School | Primary | Maintained | Brampton | 84 |
| Longtown Primary School | Primary | Academy | Carlisle | 182 |
| Lorton School | Primary | Academy | Cockermouth | 45 |
| Lowca Community School | Primary | Maintained | Whitehaven | 51 |
| Maryport CofE Primary School | Primary | Maintained | Maryport | 297 |
| Mayfield School | Special | Maintained special | Whitehaven | 274 |
| Millom Infant School | Primary | Maintained | Millom | 50 |
| Millom School | Secondary | Maintained | Millom | 476 |
| Monkwray Junior School | Primary | Maintained | Whitehaven | 109 |
| Montreal CofE Primary School | Primary | Maintained | Cleator Moor | 107 |
| Moor Row Community Primary School | Primary | Maintained | Moor Row | 72 |
| Moresby Primary School | Primary | Maintained | Whitehaven | 122 |
| Netherhall School | Secondary | Maintained | Maryport | 894 |
| Netherton Infant School | Primary | Maintained | Maryport | 69 |
| Newlaithes Infant School | Primary | Maintained | Carlisle | 196 |
| Newlaithes Junior School | Primary | Maintained | Carlisle | 236 |
| Newtown Primary School | Primary | Academy | Carlisle | 131 |
| Norman Street Primary School | Primary | Maintained | Carlisle | 322 |
| Northside Primary School | Primary | Academy | Workington | 75 |
| Orgill Primary School | Primary | Maintained | Egremont | 228 |
| Oughterside Primary School | Primary | Maintained | Wigton | 69 |
| Our Lady and St Patrick's Catholic Primary School, Maryport | Primary | Academy | Maryport | 204 |
| Parkview Nursery School | Nursery | Maintained | Millom | 57 |
| Pennine Way Primary School | Primary | Maintained | Carlisle | 558 |
| Petteril Bank School | Primary | Academy | Carlisle | 147 |
| Plumbland CofE School | Primary | Maintained | Wigton | 53 |
| Raughton Head CofE School & Nursery | Primary | Maintained | Carlisle | 74 |
| Richard Rose Central Academy | Secondary | Academy | Carlisle | 1,035 |
| Richard Rose Morton Academy | Secondary | Academy | Carlisle | 905 |
| Richmond Hill School | Primary | Maintained | Wigton | 205 |
| Robert Ferguson Primary School | Primary | Maintained | Carlisle | 409 |
| Rockcliffe CofE School | Primary | Maintained | Carlisle | 115 |
| Rosley CofE School | Primary | Maintained | Wigton | 66 |
| Scotby CofE Primary School | Primary | Maintained | Carlisle | 215 |
| Seascale Primary School | Primary | Maintained | Seascale | 97 |
| Seaton Academy | Primary | Academy | Workington | 197 |
| Seaton St. Paul's CofE Junior School | Primary | Maintained | Workington | 204 |
| Shankhill CofE Primary School | Primary | Maintained | CARLISLE | 44 |
| Silloth Primary School | Primary | Maintained | Wigton | 185 |
| Solway Community School | Secondary | Maintained | Wigton | 150 |
| St Bede's Catholic Primary School | Primary | Maintained | Carlisle | 213 |
| St Bees Village Primary School | Primary | Academy | St Bees | 162 |
| St Bega's CofE Primary School | Primary | Maintained | Holmrook | 16 |
| St Begh's Catholic Junior School | Primary | Maintained | Whitehaven | 240 |
| St Benedict's Catholic High School | Secondary | Maintained | Whitehaven | 990 |
| St Bridget's Catholic Primary School | Primary | Maintained | Egremont | 198 |
| St Bridget's CofE School | Primary | Maintained | Cockermouth | 82 |
| St Bridget's CofE School | Primary | Maintained | Whitehaven | 66 |
| St Cuthbert's Catholic Primary School | Primary | Academy | Wigton | 136 |
| St Cuthberts Catholic Primary School, Carlisle | Primary | Academy | Carlisle | 188 |
| St Gregory and St Patrick's Catholic Infant School | Primary | Maintained | Whitehaven | 189 |
| St Gregory's Catholic Primary School, Workington | Primary | Academy | Workington | 183 |
| St Herbert's CofE (VA) Primary and Nursery School | Primary | Maintained | Keswick | 266 |
| St James' Catholic Primary School | Primary | Maintained | millom | 186 |
| St James' CofE Infant and Nursery School | Primary | Maintained | Whitehaven | 133 |
| St James' CofE Junior School | Primary | Maintained | Whitehaven | 156 |
| St John Henry Newman Catholic School | Secondary | Maintained | Carlisle | 703 |
| St Joseph's Catholic Primary School | Primary | Maintained | Frizington | 55 |
| St Josephs Catholic High School, Workington | Secondary | Academy | Workington | 539 |
| St Margaret Mary Catholic Primary School, Carlisle | Primary | Academy | Carlisle | 217 |
| St Mary's Catholic Primary School | Primary | Maintained | Workington | 209 |
| St Mary's Catholic Primary School | Primary | Maintained | Whitehaven | 195 |
| St Matthew's CofE School | Primary | Maintained | Wigton | 51 |
| St Michael's CofE Primary School | Primary | Maintained | Carlisle | 186 |
| St Michael's CofE Primary School | Primary | Maintained | Wigton | 45 |
| St Michael's Nursery and Infant School | Primary | Maintained | Workington | 117 |
| St Patrick's Catholic Primary School | Primary | Maintained | Workington | 199 |
| St Patrick's Catholic Primary School | Primary | Maintained | Cleator Moor | 271 |
| Stanwix School | Primary | Academy | Carlisle | 367 |
| Stoneraise School | Primary | Maintained | Carlisle | 169 |
| The Bishop Harvey Goodwin School (Church of England Voluntary Aided) | Primary | Maintained | Carlisle | 139 |
| The Nelson Thomlinson School | Secondary | Maintained | Wigton | 1,095 |
| The Whitehaven Academy | Secondary | Academy | Whitehaven | 859 |
| Thomlinson Junior School | Primary | Maintained | Wigton | 227 |
| Thornhill Primary School | Primary | Academy | Egremont | 85 |
| Thursby Primary School | Primary | Maintained | Carlisle | 110 |
| Thwaites School | Primary | Maintained | Millom | 28 |
| Trinity School | Secondary | Academy | Carlisle | 1,711 |
| Upperby Primary School | Primary | Maintained | Carlisle | 346 |
| Valley Primary School and Nursery | Primary | Maintained | Whitehaven | 286 |
| Victoria Infant and Nursery School | Primary | Maintained | Workington | 251 |
| Victoria Junior School | Primary | Maintained | Workington | 311 |
| Waberthwaite CofE School | Primary | Maintained | Millom | 56 |
| Walton & Lees Hill CofE School | Primary | Maintained | Brampton | 20 |
| Warwick Bridge Primary School | Primary | Maintained | Carlisle | 182 |
| West Cumbria Learning Centre | Alternative provision | Maintained | Workington | 50 |
| West Lakes Academy | Secondary | Academy | Egremont | 1,017 |
| Westfield Nursery and Primary School | Primary | Maintained | Workington | 160 |
| Wiggonby CofE School | Primary | Maintained | Wigton | 61 |
| Wigton Nursery and Infant School | Primary | Maintained | Wigton | 165 |
| William Howard School | Secondary | Academy | Brampton | 1,312 |
| Workington Academy | Secondary | Academy | Workington | 1,234 |
| Wreay Church of England Primary School | Primary | Academy | Carlisle | 75 |
| Yewdale School | Primary | Academy | Carlisle | 266 |