Coventry
118 state-funded schools with 61,063 pupils on roll, in the West Midlands region. Every school’s page has its published figures against Coventry and England.
- Primary
- 85
- Secondary
- 21
- All-through
- 1
- Special
- 8
- Alternative provision
- 2
- Nursery
- 1
- Academies
- 59
- Maintained
- 50
- Free schools
- 5
- Maintained special
- 4
Map
Zoom in to see each school. Open the full map
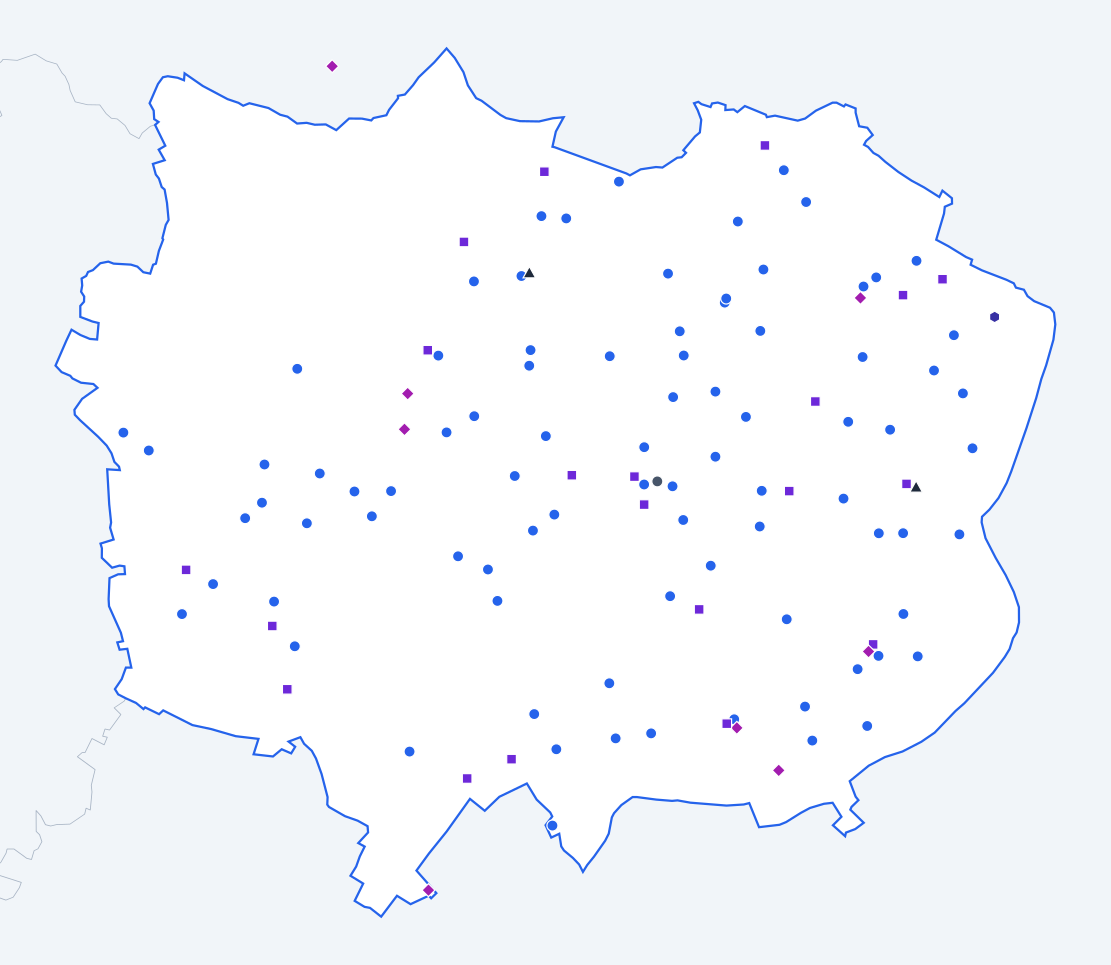
ONS, OS © Crown copyright 2025 · GIAS · © OpenStreetMap
Coventry against England
Published figures for the authority’s schools, set against the same kind of school across England.
All state-funded schools
Overall absence
2024/257.2%
- England
- 6.8%
0.4 percentage points higher than England.
Show the figures as a table
| Year | Coventry | England |
|---|---|---|
| 2017/18 | 4.9% | 4.8% |
| 2018/19 | 4.8% | 4.7% |
| 2020/21 | 4.9% | 4.6% |
| 2021/22 | 7.6% | 7.6% |
| 2022/23 | 7.7% | 7.4% |
| 2023/24 | 7.4% | 7.1% |
| 2024/25 | 7.2% | 6.8% |
Sessions missed for any reason, as a share of all possible sessions in the school year. Source: Department for Education, Explore Education Statistics, Pupil absence in schools in England, 2024/25.
Persistent absence
2024/2520.2%
- England
- 18.1%
2.1 percentage points higher than England.
Show the figures as a table
| Year | Coventry | England |
|---|---|---|
| 2017/18 | 11.8% | 11.2% |
| 2018/19 | 11.5% | 10.9% |
| 2020/21 | 13.6% | 12.1% |
| 2021/22 | 23.5% | 22.5% |
| 2022/23 | 23.7% | 21.2% |
| 2023/24 | 21.4% | 20.0% |
| 2024/25 | 20.2% | 18.1% |
Pupils who missed 10% or more of their possible sessions, as a share of pupils. Source: Department for Education, Explore Education Statistics, Pupil absence in schools in England, 2024/25.
Severe absence
2024/253.1%
- England
- 2.4%
0.7 percentage points higher than England.
Show the figures as a table
| Year | Coventry | England |
|---|---|---|
| 2017/18 | 0.9% | 0.8% |
| 2018/19 | 0.9% | 0.8% |
| 2020/21 | 1.4% | 1.1% |
| 2021/22 | 1.9% | 1.7% |
| 2022/23 | 2.5% | 2.0% |
| 2023/24 | 2.6% | 2.3% |
| 2024/25 | 3.1% | 2.4% |
Pupils who missed 50% or more of their possible sessions, as a share of pupils. Source: Department for Education, Explore Education Statistics, Pupil absence in schools in England, 2024/25.
Suspensions per 100 pupils
2024/2510.95
- England
- 10.88
0.07 higher than England.
Show the figures as a table
| Year | Coventry | England |
|---|---|---|
| 2017/18 | 5.69 | 5.08 |
| 2018/19 | 4.84 | 5.36 |
| 2019/20 | 4.06 | 3.76 |
| 2020/21 | 4.18 | 4.25 |
| 2021/22 | 7.56 | 6.91 |
| 2022/23 | 9.21 | 9.33 |
| 2023/24 | 10.04 | 11.31 |
| 2024/25 | 10.95 | 10.88 |
Suspensions in the school year for every 100 pupils on roll. One pupil can be suspended more than once. Source: Department for Education, Explore Education Statistics, Suspensions and permanent exclusions in England, 2024/25.
Permanent exclusions per 100 pupils
2024/250.13
- England
- 0.12
0.01 higher than England.
Show the figures as a table
| Year | Coventry | England |
|---|---|---|
| 2017/18 | 0.13 | 0.10 |
| 2018/19 | 0.08 | 0.10 |
| 2019/20 | 0.05 | 0.06 |
| 2020/21 | 0.03 | 0.05 |
| 2021/22 | 0.09 | 0.08 |
| 2022/23 | 0.13 | 0.11 |
| 2023/24 | 0.15 | 0.13 |
| 2024/25 | 0.13 | 0.12 |
Permanent exclusions in the school year for every 100 pupils on roll. Source: Department for Education, Explore Education Statistics, Suspensions and permanent exclusions in England, 2024/25.
Eligible for free school meals
2024/2528.0%
- England
- 25.7%
2.3 percentage points higher than England.
Show the figures as a table
| Year | Coventry | England |
|---|---|---|
| 2021/22 | 24.7% | 22.5% |
| 2022/23 | 26.3% | 23.8% |
| 2023/24 | 26.9% | 24.6% |
| 2024/25 | 28.0% | 25.7% |
Pupils known to be eligible for free school meals on census day in January. Source: Department for Education, Explore Education Statistics, Schools, pupils and their characteristics, 2024/25.
SEN support
2024/2517.6%
- England
- 14.0%
3.6 percentage points higher than England.
Show the figures as a table
| Year | Coventry | England |
|---|---|---|
| 2021/22 | 14.8% | 12.4% |
| 2022/23 | 15.6% | 12.9% |
| 2023/24 | 16.9% | 13.4% |
| 2024/25 | 17.6% | 14.0% |
Pupils receiving special educational needs support without an education, health and care plan. Source: Department for Education, Explore Education Statistics, Schools, pupils and their characteristics, 2024/25.
Education, health and care plan
2024/254.5%
- England
- 5.2%
0.7 percentage points lower than England.
Show the figures as a table
| Year | Coventry | England |
|---|---|---|
| 2021/22 | 3.4% | 3.8% |
| 2022/23 | 3.5% | 4.2% |
| 2023/24 | 3.8% | 4.7% |
| 2024/25 | 4.5% | 5.2% |
Pupils with an education, health and care plan. Source: Department for Education, Explore Education Statistics, Schools, pupils and their characteristics, 2024/25.
First language other than English
2024/2536.9%
- England
- 21.4%
15.5 percentage points higher than England.
Show the figures as a table
| Year | Coventry | England |
|---|---|---|
| 2021/22 | 34.0% | 19.6% |
| 2022/23 | 35.2% | 20.2% |
| 2023/24 | 36.1% | 20.8% |
| 2024/25 | 36.9% | 21.4% |
Pupils whose first language is known or believed to be other than English. Source: Department for Education, Explore Education Statistics, Schools, pupils and their characteristics, 2024/25.
Pupils per qualified teacher
2025/2619.3
- England
- 18.5
0.8 higher than England.
Show the figures as a table
| Year | Coventry | England |
|---|---|---|
| 2017/18 | 19.0 | 18.4 |
| 2018/19 | 19.1 | 18.6 |
| 2019/20 | 19.1 | 18.8 |
| 2020/21 | 18.7 | 18.5 |
| 2021/22 | 19.1 | 18.5 |
| 2022/23 | 19.0 | 18.5 |
| 2023/24 | 19.8 | 18.6 |
| 2024/25 | 19.8 | 18.6 |
| 2025/26 | 19.3 | 18.5 |
Full-time equivalent pupils for each full-time equivalent qualified teacher. Source: Department for Education, Explore Education Statistics, School workforce in England, 2025/26.
Teacher sickness absence
2024/256.2 days
- England
- 5.0 days
1.2 days higher than England.
Show the figures as a table
| Year | Coventry | England |
|---|---|---|
| 2017/18 | 4.8 days | 4.0 days |
| 2018/19 | 4.8 days | 4.0 days |
| 2019/20 | Not published | Not published |
| 2020/21 | 4.5 days | 3.9 days |
| 2021/22 | 7.7 days | 6.3 days |
| 2022/23 | 6.1 days | 5.2 days |
| 2023/24 | 5.9 days | 5.3 days |
| 2024/25 | 6.2 days | 5.0 days |
Days lost to sickness absence in the school year, averaged across all teachers. Source: Department for Education, Explore Education Statistics, School workforce in England, 2024/25.
Primary schools
Overall absence
2024/255.6%
- England
- 5.2%
0.4 percentage points higher than England.
Show the figures as a table
| Year | Coventry | England |
|---|---|---|
| 2017/18 | 4.2% | 4.2% |
| 2018/19 | 4.1% | 4.0% |
| 2020/21 | 4.0% | 3.6% |
| 2021/22 | 6.2% | 6.3% |
| 2022/23 | 6.3% | 5.9% |
| 2023/24 | 5.9% | 5.5% |
| 2024/25 | 5.6% | 5.2% |
Sessions missed for any reason, as a share of all possible sessions in the school year. Source: Department for Education, Explore Education Statistics, Pupil absence in schools in England, 2024/25.
Persistent absence
2024/2515.9%
- England
- 13.0%
2.9 percentage points higher than England.
Show the figures as a table
| Year | Coventry | England |
|---|---|---|
| 2017/18 | 9.6% | 8.7% |
| 2018/19 | 9.3% | 8.2% |
| 2020/21 | 10.8% | 8.8% |
| 2021/22 | 19.1% | 17.7% |
| 2022/23 | 19.3% | 16.2% |
| 2023/24 | 17.2% | 14.6% |
| 2024/25 | 15.9% | 13.0% |
Pupils who missed 10% or more of their possible sessions, as a share of pupils. Source: Department for Education, Explore Education Statistics, Pupil absence in schools in England, 2024/25.
Severe absence
2024/251.5%
- England
- 0.9%
0.6 percentage points higher than England.
Show the figures as a table
| Year | Coventry | England |
|---|---|---|
| 2017/18 | 0.5% | 0.4% |
| 2018/19 | 0.5% | 0.4% |
| 2020/21 | 1.1% | 0.7% |
| 2021/22 | 0.8% | 0.6% |
| 2022/23 | 1.0% | 0.7% |
| 2023/24 | 1.2% | 0.9% |
| 2024/25 | 1.5% | 0.9% |
Pupils who missed 50% or more of their possible sessions, as a share of pupils. Source: Department for Education, Explore Education Statistics, Pupil absence in schools in England, 2024/25.
Suspensions per 100 pupils
2024/253.39
- England
- 2.47
0.92 higher than England.
Show the figures as a table
| Year | Coventry | England |
|---|---|---|
| 2017/18 | 2.31 | 1.40 |
| 2018/19 | 1.99 | 1.41 |
| 2019/20 | 1.59 | 1.00 |
| 2020/21 | 1.29 | 0.99 |
| 2021/22 | 1.80 | 1.42 |
| 2022/23 | 2.18 | 1.81 |
| 2023/24 | 2.77 | 2.27 |
| 2024/25 | 3.39 | 2.47 |
Suspensions in the school year for every 100 pupils on roll. One pupil can be suspended more than once. Source: Department for Education, Explore Education Statistics, Suspensions and permanent exclusions in England, 2024/25.
Permanent exclusions per 100 pupils
2024/250.04
- England
- 0.03
0.01 higher than England.
Show the figures as a table
| Year | Coventry | England |
|---|---|---|
| 2017/18 | 0.07 | 0.03 |
| 2018/19 | 0.04 | 0.02 |
| 2019/20 | 0.04 | 0.02 |
| 2020/21 | 0.00 | 0.01 |
| 2021/22 | 0.05 | 0.02 |
| 2022/23 | 0.02 | 0.03 |
| 2023/24 | 0.06 | 0.03 |
| 2024/25 | 0.04 | 0.03 |
Permanent exclusions in the school year for every 100 pupils on roll. Source: Department for Education, Explore Education Statistics, Suspensions and permanent exclusions in England, 2024/25.
Reading, writing and maths: expected standard
2025/26 (provisional)58%
- England
- 63%
5 percentage points lower than England.
Show the figures as a table
| Year | Coventry | England |
|---|---|---|
| 2021/22 | 54% | 59% |
| 2022/23 | 56% | 60% |
| 2023/24 | 57% | 61% |
| 2024/25 | 60% | 63% |
| 2025/26 (provisional) | 58% | 63% |
Pupils at the end of key stage 2 who met the expected standard in reading, writing and maths combined. Source: Department for Education, Explore Education Statistics, Key stage 2 attainment, 2025/26.
Reading, writing and maths: higher standard
2025/26 (provisional)4%
- England
- 9%
5 percentage points lower than England.
Show the figures as a table
| Year | Coventry | England |
|---|---|---|
| 2021/22 | 4% | 7% |
| 2022/23 | 5% | 8% |
| 2023/24 | 5% | 8% |
| 2024/25 | 5% | 8% |
| 2025/26 (provisional) | 4% | 9% |
Pupils at the end of key stage 2 who met the higher standard in reading, writing and maths combined. Source: Department for Education, Explore Education Statistics, Key stage 2 attainment, 2025/26.
Eligible for free school meals
2024/2525.2%
- England
- 24.7%
0.5 percentage points higher than England.
Show the figures as a table
| Year | Coventry | England |
|---|---|---|
| 2021/22 | 24.3% | 23.1% |
| 2022/23 | 25.2% | 24.0% |
| 2023/24 | 25.1% | 24.3% |
| 2024/25 | 25.2% | 24.7% |
Pupils known to be eligible for free school meals on census day in January. Source: Department for Education, Explore Education Statistics, Schools, pupils and their characteristics, 2024/25.
SEN support
2024/2518.3%
- England
- 15.0%
3.3 percentage points higher than England.
Show the figures as a table
| Year | Coventry | England |
|---|---|---|
| 2021/22 | 15.3% | 13.0% |
| 2022/23 | 16.0% | 13.5% |
| 2023/24 | 17.4% | 14.1% |
| 2024/25 | 18.3% | 15.0% |
Pupils receiving special educational needs support without an education, health and care plan. Source: Department for Education, Explore Education Statistics, Schools, pupils and their characteristics, 2024/25.
Education, health and care plan
2024/252.6%
- England
- 3.5%
0.9 percentage points lower than England.
Show the figures as a table
| Year | Coventry | England |
|---|---|---|
| 2021/22 | 1.5% | 2.3% |
| 2022/23 | 1.6% | 2.5% |
| 2023/24 | 2.1% | 3.0% |
| 2024/25 | 2.6% | 3.5% |
Pupils with an education, health and care plan. Source: Department for Education, Explore Education Statistics, Schools, pupils and their characteristics, 2024/25.
First language other than English
2024/2538.1%
- England
- 23.4%
14.7 percentage points higher than England.
Show the figures as a table
| Year | Coventry | England |
|---|---|---|
| 2021/22 | 34.4% | 21.2% |
| 2022/23 | 35.8% | 22.0% |
| 2023/24 | 37.0% | 22.8% |
| 2024/25 | 38.1% | 23.4% |
Pupils whose first language is known or believed to be other than English. Source: Department for Education, Explore Education Statistics, Schools, pupils and their characteristics, 2024/25.
Pupils per qualified teacher
2025/2622.9
- England
- 21.2
1.7 higher than England.
Show the figures as a table
| Year | Coventry | England |
|---|---|---|
| 2017/18 | 22.5 | 21.3 |
| 2018/19 | 22.3 | 21.4 |
| 2019/20 | 22.6 | 21.4 |
| 2020/21 | 22.1 | 21.1 |
| 2021/22 | 22.6 | 21.0 |
| 2022/23 | 22.9 | 21.1 |
| 2023/24 | 23.3 | 21.2 |
| 2024/25 | 23.9 | 21.3 |
| 2025/26 | 22.9 | 21.2 |
Full-time equivalent pupils for each full-time equivalent qualified teacher. Source: Department for Education, Explore Education Statistics, School workforce in England, 2025/26.
Secondary schools
Overall absence
2024/259.0%
- England
- 8.4%
0.6 percentage points higher than England.
Show the figures as a table
| Year | Coventry | England |
|---|---|---|
| 2017/18 | 5.5% | 5.5% |
| 2018/19 | 5.4% | 5.5% |
| 2020/21 | 5.5% | 5.5% |
| 2021/22 | 9.2% | 9.0% |
| 2022/23 | 9.4% | 9.0% |
| 2023/24 | 9.0% | 8.9% |
| 2024/25 | 9.0% | 8.4% |
Sessions missed for any reason, as a share of all possible sessions in the school year. Source: Department for Education, Explore Education Statistics, Pupil absence in schools in England, 2024/25.
Persistent absence
2024/2524.9%
- England
- 23.4%
1.5 percentage points higher than England.
Show the figures as a table
| Year | Coventry | England |
|---|---|---|
| 2017/18 | 14.3% | 13.9% |
| 2018/19 | 13.8% | 13.7% |
| 2020/21 | 15.4% | 14.8% |
| 2021/22 | 28.3% | 27.7% |
| 2022/23 | 28.5% | 26.5% |
| 2023/24 | 25.9% | 25.6% |
| 2024/25 | 24.9% | 23.4% |
Pupils who missed 10% or more of their possible sessions, as a share of pupils. Source: Department for Education, Explore Education Statistics, Pupil absence in schools in England, 2024/25.
Severe absence
2024/254.9%
- England
- 3.9%
1.0 percentage point higher than England.
Show the figures as a table
| Year | Coventry | England |
|---|---|---|
| 2017/18 | 1.3% | 1.2% |
| 2018/19 | 1.2% | 1.3% |
| 2020/21 | 1.6% | 1.5% |
| 2021/22 | 3.0% | 2.7% |
| 2022/23 | 4.1% | 3.4% |
| 2023/24 | 4.1% | 3.8% |
| 2024/25 | 4.9% | 3.9% |
Pupils who missed 50% or more of their possible sessions, as a share of pupils. Source: Department for Education, Explore Education Statistics, Pupil absence in schools in England, 2024/25.
Suspensions per 100 pupils
2024/2520.32
- England
- 21.24
0.92 lower than England.
Show the figures as a table
| Year | Coventry | England |
|---|---|---|
| 2017/18 | 10.87 | 10.13 |
| 2018/19 | 9.23 | 10.75 |
| 2019/20 | 7.53 | 7.43 |
| 2020/21 | 7.85 | 8.48 |
| 2021/22 | 14.65 | 13.96 |
| 2022/23 | 17.47 | 18.90 |
| 2023/24 | 19.05 | 22.61 |
| 2024/25 | 20.32 | 21.24 |
Suspensions in the school year for every 100 pupils on roll. One pupil can be suspended more than once. Source: Department for Education, Explore Education Statistics, Suspensions and permanent exclusions in England, 2024/25.
Permanent exclusions per 100 pupils
2024/250.25
- England
- 0.23
0.02 higher than England.
Show the figures as a table
| Year | Coventry | England |
|---|---|---|
| 2017/18 | 0.22 | 0.20 |
| 2018/19 | 0.14 | 0.20 |
| 2019/20 | 0.06 | 0.13 |
| 2020/21 | 0.07 | 0.10 |
| 2021/22 | 0.14 | 0.16 |
| 2022/23 | 0.26 | 0.22 |
| 2023/24 | 0.27 | 0.25 |
| 2024/25 | 0.25 | 0.23 |
Permanent exclusions in the school year for every 100 pupils on roll. Source: Department for Education, Explore Education Statistics, Suspensions and permanent exclusions in England, 2024/25.
Attainment 8
2025/26 (provisional)44.8
- England
- 47.4
2.6 lower than England.
Show the figures as a table
| Year | Coventry | England |
|---|---|---|
| 2021/22 | 47.3 | 49.8 |
| 2022/23 | 44.7 | 47.2 |
| 2023/24 | 45.3 | 46.9 |
| 2024/25 | 45.1 | 47.1 |
| 2025/26 (provisional) | 44.8 | 47.4 |
The average of pupils' points across eight GCSE-level qualifications, with English and maths counted twice. Source: Department for Education, Explore Education Statistics, Key stage 4 performance, 2025/26.
English and maths: grade 4 or above
2025/26 (provisional)63%
- England
- 66%
3 percentage points lower than England.
Show the figures as a table
| Year | Coventry | England |
|---|---|---|
| 2021/22 | 67% | 70% |
| 2022/23 | 62% | 67% |
| 2023/24 | 66% | 67% |
| 2024/25 | 63% | 66% |
| 2025/26 (provisional) | 63% | 66% |
Pupils at the end of key stage 4 with grade 4 or above in both English and maths. Source: Department for Education, Explore Education Statistics, Key stage 4 performance, 2025/26.
English and maths: grade 5 or above
2025/26 (provisional)44%
- England
- 48%
4 percentage points lower than England.
Show the figures as a table
| Year | Coventry | England |
|---|---|---|
| 2021/22 | 48% | 51% |
| 2022/23 | 42% | 46% |
| 2023/24 | 45% | 47% |
| 2024/25 | 42% | 47% |
| 2025/26 (provisional) | 44% | 48% |
Pupils at the end of key stage 4 with grade 5 or above in both English and maths. Source: Department for Education, Explore Education Statistics, Key stage 4 performance, 2025/26.
Eligible for free school meals
2024/2530.6%
- England
- 25.8%
4.8 percentage points higher than England.
Show the figures as a table
| Year | Coventry | England |
|---|---|---|
| 2021/22 | 24.5% | 20.9% |
| 2022/23 | 26.9% | 22.7% |
| 2023/24 | 28.3% | 24.1% |
| 2024/25 | 30.6% | 25.8% |
Pupils known to be eligible for free school meals on census day in January. Source: Department for Education, Explore Education Statistics, Schools, pupils and their characteristics, 2024/25.
SEN support
2024/2517.5%
- England
- 13.4%
4.1 percentage points higher than England.
Show the figures as a table
| Year | Coventry | England |
|---|---|---|
| 2021/22 | 14.7% | 11.9% |
| 2022/23 | 15.8% | 12.4% |
| 2023/24 | 16.9% | 12.9% |
| 2024/25 | 17.5% | 13.4% |
Pupils receiving special educational needs support without an education, health and care plan. Source: Department for Education, Explore Education Statistics, Schools, pupils and their characteristics, 2024/25.
Education, health and care plan
2024/252.0%
- England
- 3.1%
1.1 percentage points lower than England.
Show the figures as a table
| Year | Coventry | England |
|---|---|---|
| 2021/22 | 1.3% | 2.2% |
| 2022/23 | 1.4% | 2.4% |
| 2023/24 | 1.5% | 2.7% |
| 2024/25 | 2.0% | 3.1% |
Pupils with an education, health and care plan. Source: Department for Education, Explore Education Statistics, Schools, pupils and their characteristics, 2024/25.
First language other than English
2024/2535.9%
- England
- 19.2%
16.7 percentage points higher than England.
Show the figures as a table
| Year | Coventry | England |
|---|---|---|
| 2021/22 | 33.6% | 17.5% |
| 2022/23 | 34.6% | 18.1% |
| 2023/24 | 35.2% | 18.6% |
| 2024/25 | 35.9% | 19.2% |
Pupils whose first language is known or believed to be other than English. Source: Department for Education, Explore Education Statistics, Schools, pupils and their characteristics, 2024/25.
Pupils per qualified teacher
2025/2617.4
- England
- 17.3
0.1 higher than England.
Show the figures as a table
| Year | Coventry | England |
|---|---|---|
| 2017/18 | 16.4 | 16.5 |
| 2018/19 | 16.9 | 16.8 |
| 2019/20 | 16.9 | 17.2 |
| 2020/21 | 16.6 | 17.1 |
| 2021/22 | 17.1 | 17.1 |
| 2022/23 | 16.7 | 17.2 |
| 2023/24 | 17.9 | 17.4 |
| 2024/25 | 17.5 | 17.3 |
| 2025/26 | 17.4 | 17.3 |
Full-time equivalent pupils for each full-time equivalent qualified teacher. Source: Department for Education, Explore Education Statistics, School workforce in England, 2025/26.
Special schools
Overall absence
2024/2511.4%
- England
- 12.8%
1.4 percentage points lower than England.
Show the figures as a table
| Year | Coventry | England |
|---|---|---|
| 2017/18 | 12.2% | 10.2% |
| 2018/19 | 12.1% | 10.1% |
| 2020/21 | 17.2% | 15.2% |
| 2021/22 | 13.4% | 13.2% |
| 2022/23 | 13.7% | 13.0% |
| 2023/24 | 12.4% | 13.0% |
| 2024/25 | 11.4% | 12.8% |
Sessions missed for any reason, as a share of all possible sessions in the school year. Source: Department for Education, Explore Education Statistics, Pupil absence in schools in England, 2024/25.
Persistent absence
2024/2532.4%
- England
- 35.3%
2.9 percentage points lower than England.
Show the figures as a table
| Year | Coventry | England |
|---|---|---|
| 2017/18 | 33.0% | 29.6% |
| 2018/19 | 33.3% | 28.8% |
| 2020/21 | 56.8% | 48.9% |
| 2021/22 | 41.4% | 40.4% |
| 2022/23 | 36.9% | 38.3% |
| 2023/24 | 34.0% | 37.2% |
| 2024/25 | 32.4% | 35.3% |
Pupils who missed 10% or more of their possible sessions, as a share of pupils. Source: Department for Education, Explore Education Statistics, Pupil absence in schools in England, 2024/25.
Severe absence
2024/254.6%
- England
- 6.9%
2.3 percentage points lower than England.
Show the figures as a table
| Year | Coventry | England |
|---|---|---|
| 2017/18 | 7.9% | 4.4% |
| 2018/19 | 6.5% | 4.6% |
| 2020/21 | 5.9% | 5.6% |
| 2021/22 | 6.6% | 5.8% |
| 2022/23 | 7.9% | 6.2% |
| 2023/24 | 5.5% | 6.7% |
| 2024/25 | 4.6% | 6.9% |
Pupils who missed 50% or more of their possible sessions, as a share of pupils. Source: Department for Education, Explore Education Statistics, Pupil absence in schools in England, 2024/25.
Suspensions per 100 pupils
2024/2519.92
- England
- 12.32
7.60 higher than England.
Show the figures as a table
| Year | Coventry | England |
|---|---|---|
| 2017/18 | 8.08 | 12.34 |
| 2018/19 | 5.03 | 11.32 |
| 2019/20 | 7.44 | 7.76 |
| 2020/21 | 12.97 | 7.29 |
| 2021/22 | 22.91 | 9.60 |
| 2022/23 | 33.25 | 10.99 |
| 2023/24 | 20.73 | 12.62 |
| 2024/25 | 19.92 | 12.32 |
Suspensions in the school year for every 100 pupils on roll. One pupil can be suspended more than once. Source: Department for Education, Explore Education Statistics, Suspensions and permanent exclusions in England, 2024/25.
Permanent exclusions per 100 pupils
2024/250.08
- England
- 0.08
The same as England.
Show the figures as a table
| Year | Coventry | England |
|---|---|---|
| 2017/18 | 0.00 | 0.07 |
| 2018/19 | 0.21 | 0.06 |
| 2019/20 | 0.00 | 0.04 |
| 2020/21 | 0.18 | 0.03 |
| 2021/22 | 0.09 | 0.05 |
| 2022/23 | 0.66 | 0.08 |
| 2023/24 | 0.08 | 0.08 |
| 2024/25 | 0.08 | 0.08 |
Permanent exclusions in the school year for every 100 pupils on roll. Source: Department for Education, Explore Education Statistics, Suspensions and permanent exclusions in England, 2024/25.
Eligible for free school meals
2024/2547.4%
- England
- 48.8%
1.4 percentage points lower than England.
Show the figures as a table
| Year | Coventry | England |
|---|---|---|
| 2021/22 | 45.1% | 44.4% |
| 2022/23 | 45.4% | 45.6% |
| 2023/24 | 47.3% | 47.1% |
| 2024/25 | 47.4% | 48.8% |
Pupils known to be eligible for free school meals on census day in January. Source: Department for Education, Explore Education Statistics, Schools, pupils and their characteristics, 2024/25.
SEN support
2024/250.0%
- England
- 0.5%
0.5 percentage points lower than England.
Show the figures as a table
| Year | Coventry | England |
|---|---|---|
| 2021/22 | 0.2% | 0.9% |
| 2022/23 | 0.1% | 0.8% |
| 2023/24 | 0.0% | 0.7% |
| 2024/25 | 0.0% | 0.5% |
Pupils receiving special educational needs support without an education, health and care plan. Source: Department for Education, Explore Education Statistics, Schools, pupils and their characteristics, 2024/25.
Education, health and care plan
2024/25100.0%
- England
- 99.5%
0.5 percentage points higher than England.
Show the figures as a table
| Year | Coventry | England |
|---|---|---|
| 2021/22 | 99.8% | 99.1% |
| 2022/23 | 99.9% | 99.2% |
| 2023/24 | 100.0% | 99.3% |
| 2024/25 | 100.0% | 99.5% |
Pupils with an education, health and care plan. Source: Department for Education, Explore Education Statistics, Schools, pupils and their characteristics, 2024/25.
First language other than English
2024/2526.3%
- England
- 14.4%
11.9 percentage points higher than England.
Show the figures as a table
| Year | Coventry | England |
|---|---|---|
| 2021/22 | 28.8% | 14.5% |
| 2022/23 | 28.1% | 14.4% |
| 2023/24 | 26.6% | 14.4% |
| 2024/25 | 26.3% | 14.4% |
Pupils whose first language is known or believed to be other than English. Source: Department for Education, Explore Education Statistics, Schools, pupils and their characteristics, 2024/25.
Pupils per qualified teacher
2025/267.8
- England
- 7.3
0.5 higher than England.
Show the figures as a table
| Year | Coventry | England |
|---|---|---|
| 2017/18 | 7.6 | 6.7 |
| 2018/19 | 7.1 | 6.8 |
| 2019/20 | 6.6 | 7.0 |
| 2020/21 | 6.7 | 6.8 |
| 2021/22 | 6.7 | 6.9 |
| 2022/23 | 7.1 | 7.0 |
| 2023/24 | 7.5 | 7.1 |
| 2024/25 | 7.6 | 7.3 |
| 2025/26 | 7.8 | 7.3 |
Full-time equivalent pupils for each full-time equivalent qualified teacher. Source: Department for Education, Explore Education Statistics, School workforce in England, 2025/26.
Schools in Coventry
Listed by name. Filter by phase or type; sort by name or size. Nothing here is sorted by results.
Showing 118 of 118 schools in Coventry.
| School | Phase | Type | Town | Pupils |
|---|---|---|---|---|
| Alderman's Green Primary School | Primary | Academy | Coventry | 485 |
| Aldermoor Farm Primary School | Primary | Maintained | Coventry | 644 |
| All Saints Church of England Primary School | Primary | Maintained | Coventry | 268 |
| All Souls' Catholic Primary School | Primary | Maintained | Coventry | 237 |
| Allesley Hall Primary School | Primary | Maintained | Coventry | 196 |
| Allesley Primary School | Primary | Maintained | Coventry | 414 |
| Baginton Fields Academy | Special | Academy | Coventry | 125 |
| Barr's Hill School | Secondary | Academy | Coventry | 1,063 |
| Bishop Ullathorne Catholic School | Secondary | Academy | Coventry | 1,155 |
| Blue Coat Church of England School and Music College | Secondary | Academy | Coventry | 1,815 |
| Broad Heath Community Primary School | Primary | Maintained | Coventry | 683 |
| Caludon Castle School | Secondary | Academy | Coventry | 1,520 |
| Cannon Park Primary School | Primary | Maintained | Coventry | 199 |
| Cardinal Wiseman Catholic School | Secondary | Academy | Coventry | 1,406 |
| Castle Wood Special School | Special | Maintained special | Coventry | 194 |
| Charter Academy | Primary | Academy | Coventry | 336 |
| Christ The King Catholic Primary School | Primary | Academy | Coventry | 445 |
| Clifford Bridge Academy | Primary | Academy | Coventry | 430 |
| Corley Academy | Special | Academy | Coventry | 168 |
| Corpus Christi Catholic School | Primary | Academy | Coventry | 442 |
| Coundon Court | Secondary | Academy | Coventry | 1,873 |
| Coundon Primary School | Primary | Maintained | Coventry | 534 |
| Courthouse Green Primary School | Primary | Academy | Coventry | 711 |
| Coventry Alternative Provision Academy | Alternative provision | Academy | Coventry | 59 |
| Earlsdon Primary School | Primary | Maintained | Coventry | 416 |
| Eastern Green Junior School | Primary | Maintained | Coventry | 241 |
| Eden Girls' School, Coventry | Secondary | Free school | Coventry | 600 |
| Edgewick Community Primary School | Primary | Maintained | Coventry | 433 |
| Ernesford Grange Community Academy | Secondary | Academy | Coventry | 1,187 |
| Ernesford Grange Primary School | Primary | Maintained | Coventry | 451 |
| Finham Park 2 | Secondary | Free school | Coventry | 812 |
| Finham Park School | Secondary | Academy | Coventry | 1,724 |
| Finham Primary School | Primary | Academy | Coventry | 457 |
| Foxford Community School | Secondary | Academy | Coventry | 1,078 |
| Frederick Bird Academy | Primary | Academy | Coventry | 855 |
| Good Shepherd Catholic School | Primary | Academy | Coventry | 227 |
| Gosford Park Primary School | Primary | Maintained | Coventry | 430 |
| Grace Academy Coventry | Secondary | Academy | Coventry | 1,051 |
| Grange Farm Primary School | Primary | Maintained | Coventry | 401 |
| Grangehurst Primary School | Primary | Maintained | Coventry | 411 |
| Hearsall Community Academy | Primary | Academy | Coventry | 433 |
| Henley Green Primary | Primary | Maintained | Coventry | 449 |
| Hill Farm Academy | Primary | Academy | Coventry | 477 |
| Hillfields Nursery School | Nursery | Maintained | Coventry | 144 |
| Holbrook Primary School | Primary | Maintained | Coventry | 608 |
| Hollyfast Primary School | Primary | Maintained | Coventry | 641 |
| Holy Family Catholic Primary School | Primary | Maintained | Coventry | 459 |
| Howes Community Primary School | Primary | Maintained | Coventry | 182 |
| Inspired Pathways | Alternative provision | Maintained | Coventry | 2 |
| John Gulson Primary School | Primary | Maintained | Coventry | 496 |
| John Shelton Community Primary School | Primary | Maintained | Coventry | 249 |
| Joseph Cash Primary School | Primary | Maintained | Coventry | 476 |
| Keresley Grange Primary School | Primary | Academy | Coventry | 314 |
| Kingsbury Academy | Special | Academy | Coventry | 105 |
| Leigh Church of England Academy | Primary | Academy | Coventry | 216 |
| Limbrick Wood Primary School | Primary | Academy | Coventry | 173 |
| Little Heath Primary School | Primary | Academy | Coventry | 191 |
| Longford Park Primary School | Primary | Maintained | Coventry | 224 |
| Lyng Hall School | Secondary | Academy | Coventry | 1,014 |
| Manor Park Primary School | Primary | Maintained | Coventry | 717 |
| Meadow Park School | Secondary | Academy | Coventry | 734 |
| Moat House Primary School | Primary | Maintained | Coventry | 470 |
| Moseley Primary School | Primary | Maintained | Coventry | 571 |
| Mount Nod Primary School | Primary | Maintained | Coventry | 304 |
| Our Lady of the Assumption Catholic Primary School | Primary | Maintained | Coventry | 215 |
| Park Hill Primary School | Primary | Maintained | Coventry | 416 |
| Parkgate Primary School | Primary | Academy | Coventry | 683 |
| Pearl Hyde Community Primary School | Primary | Academy | Coventry | 278 |
| Potters Green Primary School | Primary | Academy | Coventry | 414 |
| President Kennedy School Academy | Secondary | Academy | Coventry | 1,799 |
| Radford Primary Academy | Primary | Academy | Coventry | 237 |
| Ravensdale Primary School | Primary | Maintained | Coventry | 454 |
| Richard Lee Primary School | Primary | Academy | Coventry | 351 |
| Riverbank School | Special | Academy | Coventry | 219 |
| Sacred Heart Catholic Primary School | Primary | Academy | Coventry | 453 |
| Seva School | All-through | Free school | Coventry | 736 |
| Sherbourne Fields School | Special | Maintained special | Coventry | 263 |
| Sidney Stringer Academy | Secondary | Academy | Coventry | 1,496 |
| Sidney Stringer Primary Academy | Primary | Free school | Coventry | 416 |
| Southfields Primary School | Primary | Maintained | Coventry | 450 |
| Sowe Valley Primary School | Primary | Maintained | Coventry | 210 |
| Spon Gate Primary School | Primary | Maintained | Coventry | 224 |
| SS Peter and Paul Catholic Primary School | Primary | Academy | Coventry | 197 |
| St Andrew's Church of England Infant School | Primary | Maintained | Coventry | 158 |
| St Anne's Catholic Primary School | Primary | Maintained | Coventry | 235 |
| St Augustine's Catholic Primary School | Primary | Academy | Coventry | 293 |
| St Bartholomew's Church of England Academy | Primary | Academy | Coventry | 207 |
| St Christopher Primary School | Primary | Maintained | Coventry | 467 |
| St Elizabeth's Catholic Primary School | Primary | Academy | Coventry | 232 |
| St Gregory's Catholic Primary School | Primary | Academy | Coventry | 214 |
| St John Fisher Catholic Primary School | Primary | Academy | Coventry | 458 |
| St John Henry Newman Catholic School | Secondary | Academy | Coventry | 1,435 |
| St John Vianney Catholic Primary School | Primary | Academy | Coventry | 234 |
| St John's Church of England Academy | Primary | Academy | Coventry | 179 |
| St Laurences CofE Primary School | Primary | Academy | Coventry | 403 |
| St Mary and St Benedict Catholic Primary School | Primary | Maintained | Coventry | 345 |
| St Osburg's Catholic Primary School | Primary | Maintained | Coventry | 222 |
| St Patrick's Catholic Primary School | Primary | Academy | Coventry | 234 |
| St Thomas More Catholic Primary School | Primary | Academy | Coventry | 268 |
| Stanton Bridge Primary School | Primary | Academy | Coventry | 413 |
| Stivichall Primary School | Primary | Maintained | Coventry | 533 |
| Stoke Heath Primary School | Primary | Maintained | Coventry | 494 |
| Stoke Park School | Secondary | Academy | Coventry | 1,101 |
| Stoke Primary School | Primary | Maintained | Coventry | 474 |
| Stretton Church of England Academy | Primary | Academy | Coventry | 208 |
| Templars Primary School | Primary | Maintained | Coventry | 625 |
| The Westwood Academy | Secondary | Academy | Coventry | 843 |
| Tiverton School | Special | Maintained special | Coventry | 136 |
| Walsgrave Church of England Academy | Primary | Academy | Coventry | 444 |
| West Coventry Academy | Secondary | Academy | Coventry | 1,317 |
| Whitley Abbey Primary School | Primary | Maintained | Coventry | 403 |
| Whitmore Park Primary School | Primary | Maintained | Coventry | 677 |
| Whittle Academy | Primary | Academy | Coventry | 238 |
| Whoberley Hall Primary School | Primary | Maintained | Coventry | 219 |
| Willenhall Community Primary School | Primary | Maintained | Coventry | 452 |
| WMG Academy for Young Engineers | Secondary | Free school | Coventry | 504 |
| Woodfield | Special | Maintained special | Coventry | 163 |
| Wyken Croft Primary School | Primary | Maintained | Coventry | 899 |