Every year, schools and trusts renew their subscriptions to data dashboards. Attendance against the national figure. Results against similar schools. Inspection history, pupil characteristics, staffing. The charts are tidy, the logins are personal, and the invoice comes round again.
Most of those figures do not belong to the platform. The Department for Education and Ofsted publish them free, for every state-funded school in England, mostly under the Open Government Licence. Anyone can download them. What a dashboard adds is the work: joining the files up, putting each figure in context, and keeping it current.
That work used to need a development team. It no longer does. So I did it, for every school in England.
What I built
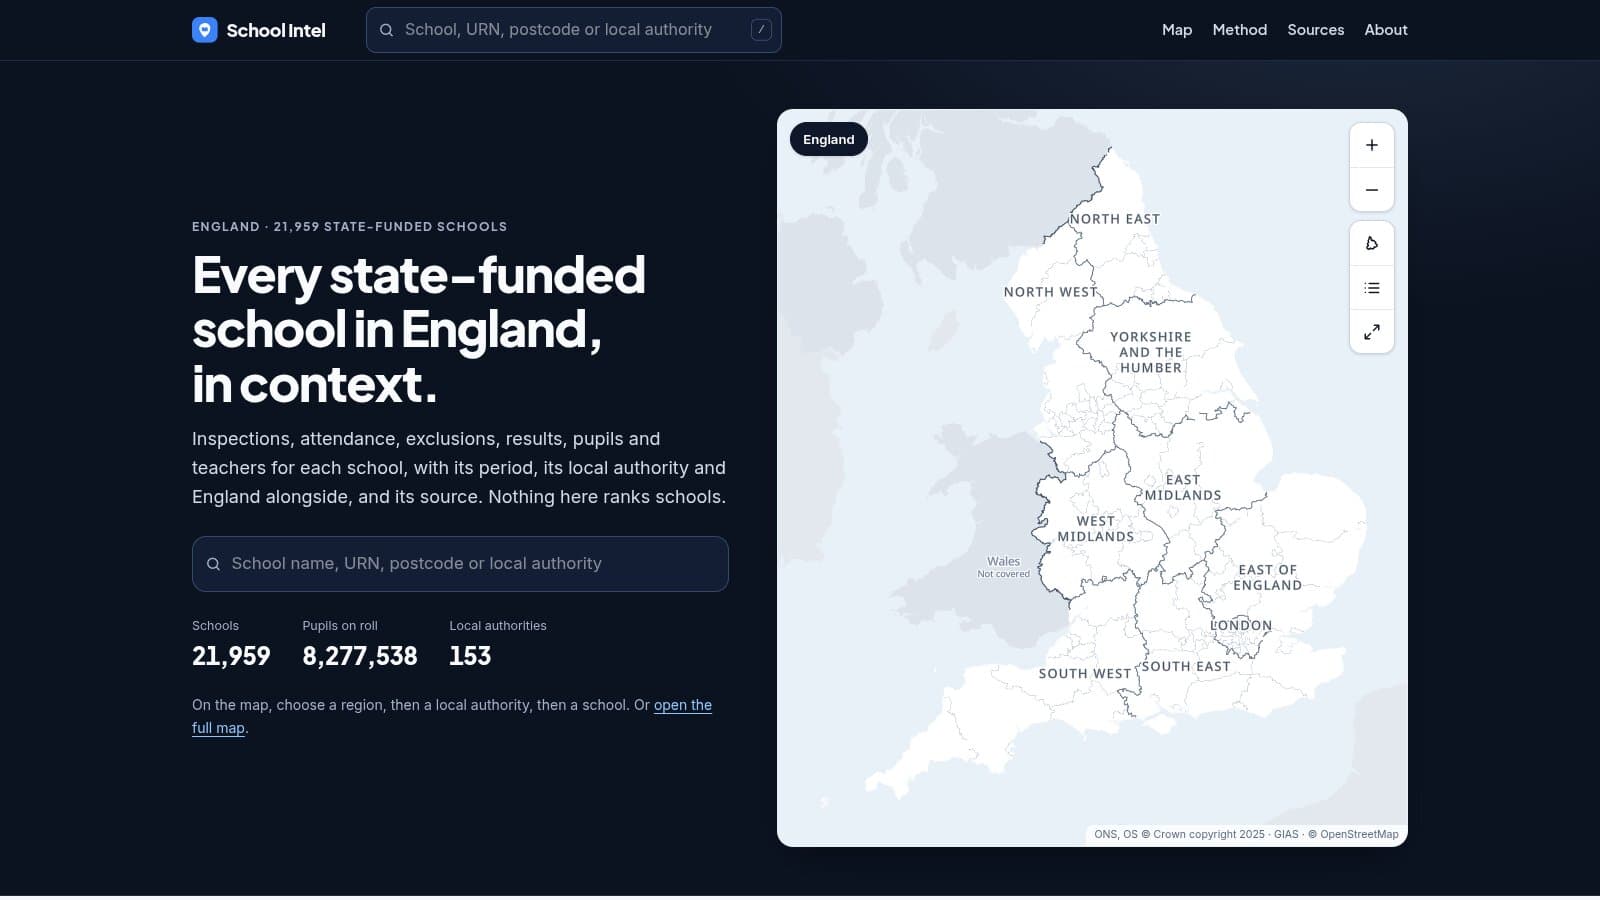
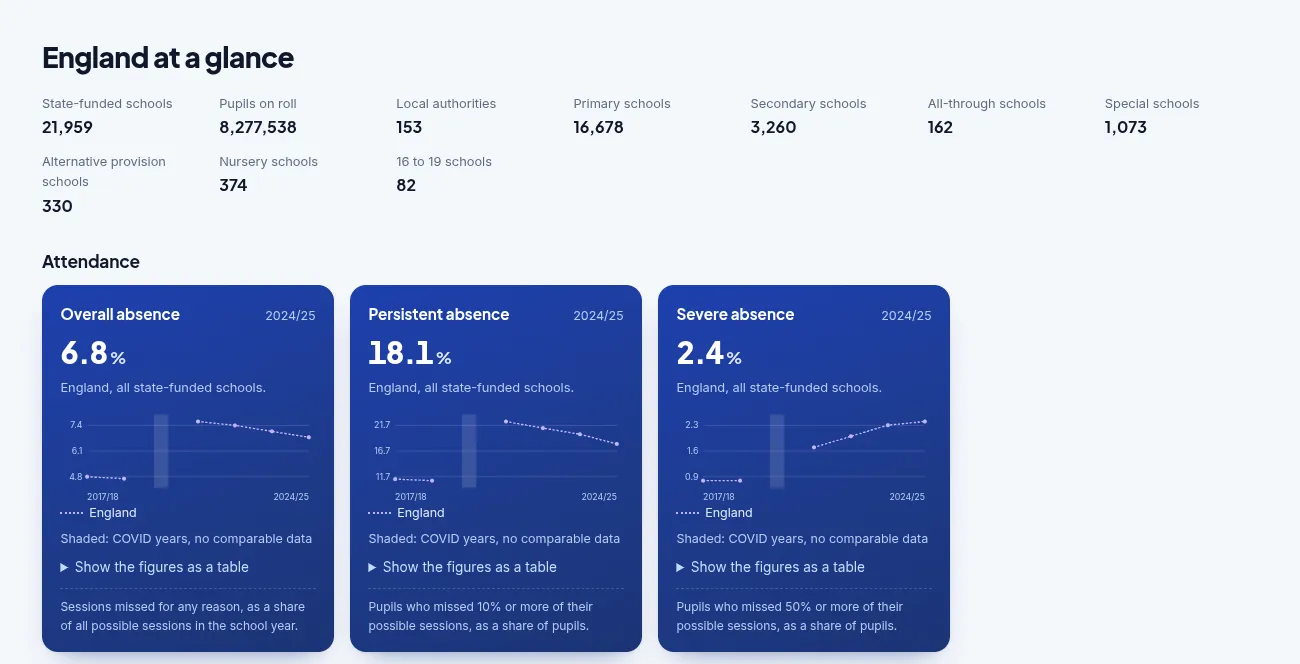
School Intel covers every state-funded school in England: around 22,000 schools in 153 local authorities. Each school has a page with its inspections, attendance, suspensions and exclusions, results, pupils and teachers. Every figure sits beside its local authority and England, with its period and its source.
 (opens the full-size screenshot in a new tab)
Nothing on it ranks a school or labels one. A special school is never set against mainstream results. Inspections under Ofsted's old graded framework and under the new report cards are kept apart, because they do not measure the same thing. The years when COVID stopped the collections show as gaps, not lines drawn through.
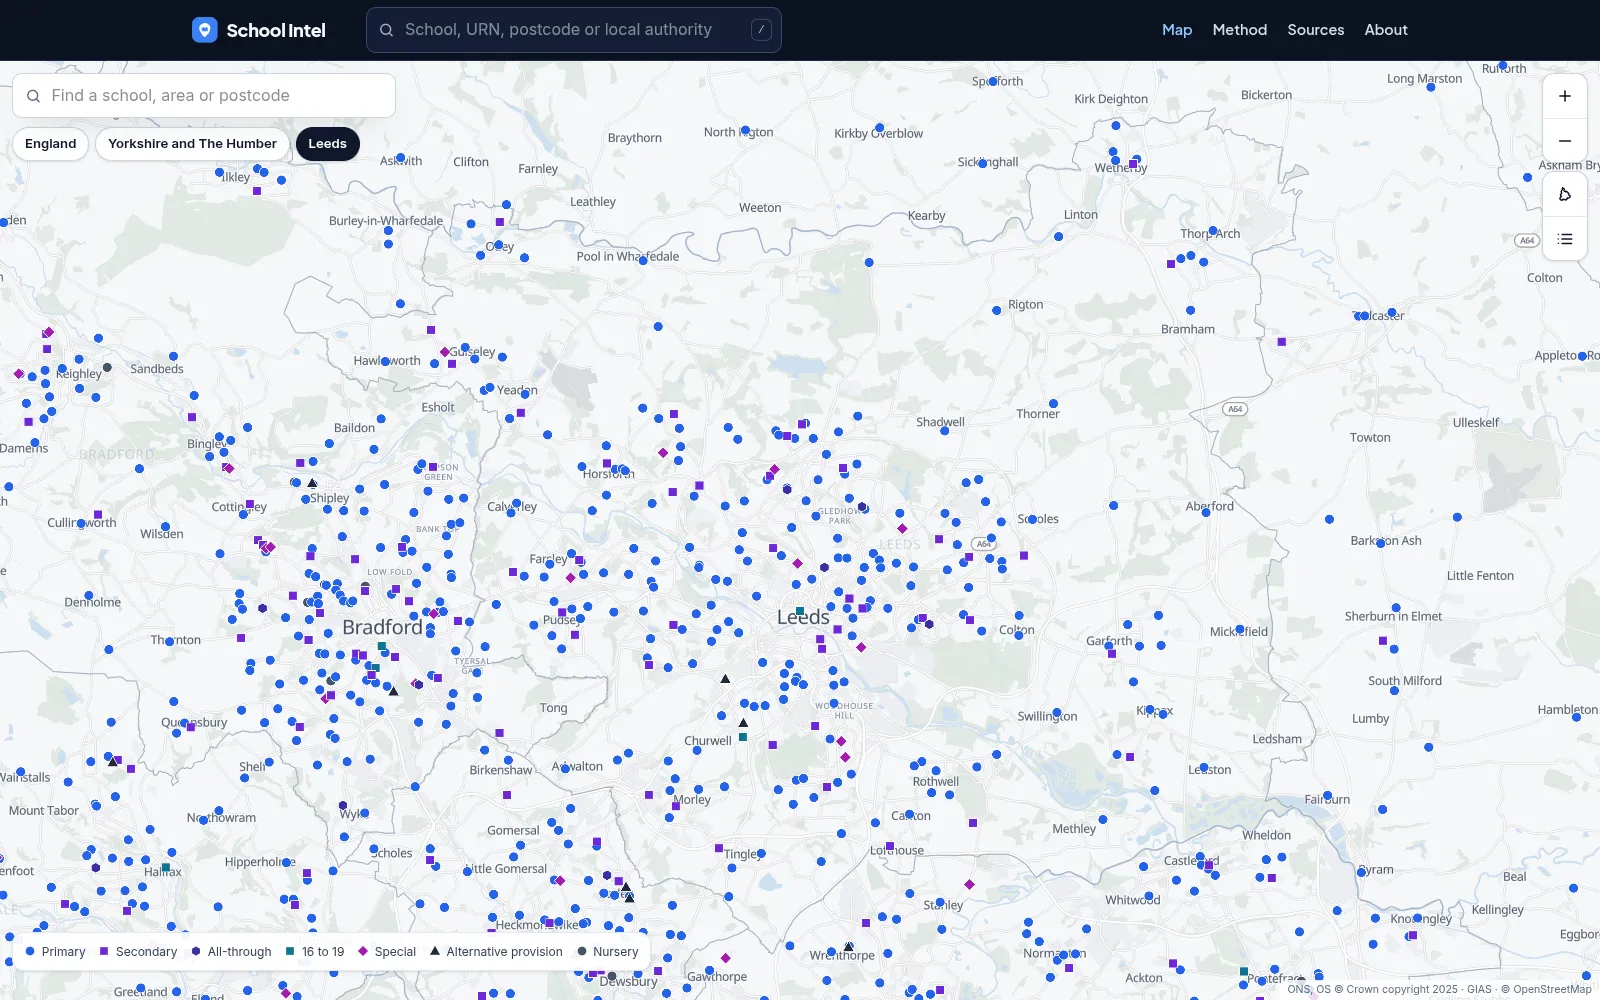
The map shows every authority and every school, drawn from the Office for National Statistics' boundaries and OpenStreetMap. It stays sharp at every zoom, it works with a keyboard and a screen reader, and there is a list view for anyone who would rather read than pan.
 (opens the full-size screenshot in a new tab)
How I made it
I started with questions, not screens. What does a governor want to know about a school before a meeting? What does a trust ask about a school it is about to take on? Each question pointed to a published source, and each source became a step in a pipeline.
Every week the pipeline fetches each source from its publisher, rebuilds the school, authority and England figures, and runs its checks. A release goes live only if every check passes. The checks are the rules I would otherwise have to remember:
- No scores, bands or rankings for any real school.
- Every figure has a period, and every missing figure says why.
- No names of headteachers, governors or staff.
- Figures rebuilt from school-level data must match the DfE's published totals exactly.
- Every school sits inside its own authority, or is a reviewed exception.
If a publisher renames a column or moves a file, the pipeline stops and names the file and the column. The site keeps serving the last good release until it is fixed.
I made the decisions. AI agents did the building: the pipeline, the checks, the map and the pages. I reviewed it before launch and asked for changes. It costs almost nothing to run, because the data is free and the refresh runs itself.
Before you renew
I am not saying every paid platform is poor value. Some bring in your own pupil-level data, assessment tracking or links to your management information system, and some come with support a school needs. Those are worth paying for.
But some of the spend is on the published layer: the same national files, drawn as charts. Three questions are worth asking before the next renewal.
- Which of these figures are published free? The DfE's Compare school and college performance, Get Information about Schools and Financial Benchmarking and Insights Tool already cover a great deal.
- What does the platform add that we use? Our own data, a workflow and support, or only the charts?
- Who decides what the screens show: our board's questions, or the vendor's roadmap?
If the honest answer is "mostly published data, shown their way", the money could work harder somewhere else.
Software made to your needs
Bespoke software used to be out of reach for a school. You bought what the market had built and fitted your questions to its screens.
That has changed. One person working with AI agents can now build and maintain a tool shaped around one school's or one trust's questions: the measures its board cares about, the comparisons it trusts, the words its governors use. School Intel shows it can be done with published data. The same approach works with a school's own data, with the care that brings: data protection, accessibility, and a named person accountable for keeping it right.
A school, a trust or a group of schools can own its intelligence platform instead of renting a view of national files.
If you want to do this
Start with the questions your board asks, not with a dashboard you have seen. List the published sources that answer them. Build a pipeline that fetches them every week and checks them before anyone sees them. Put each figure in context before you chart it. Keep named people out.
If you would like software built around your school's questions, get in touch.
- data
- schools
- agents