England · 21,959 state-funded schools
Every state-funded school in England, in context.
Inspections, attendance, exclusions, results, pupils and teachers for each school, with its period, its local authority and England alongside, and its source. Nothing here ranks schools.
- Schools
- 21,959
- Pupils on roll
- 8,277,538
- Local authorities
- 153
On the map, choose a region, then a local authority, then a school. Or open the full map.
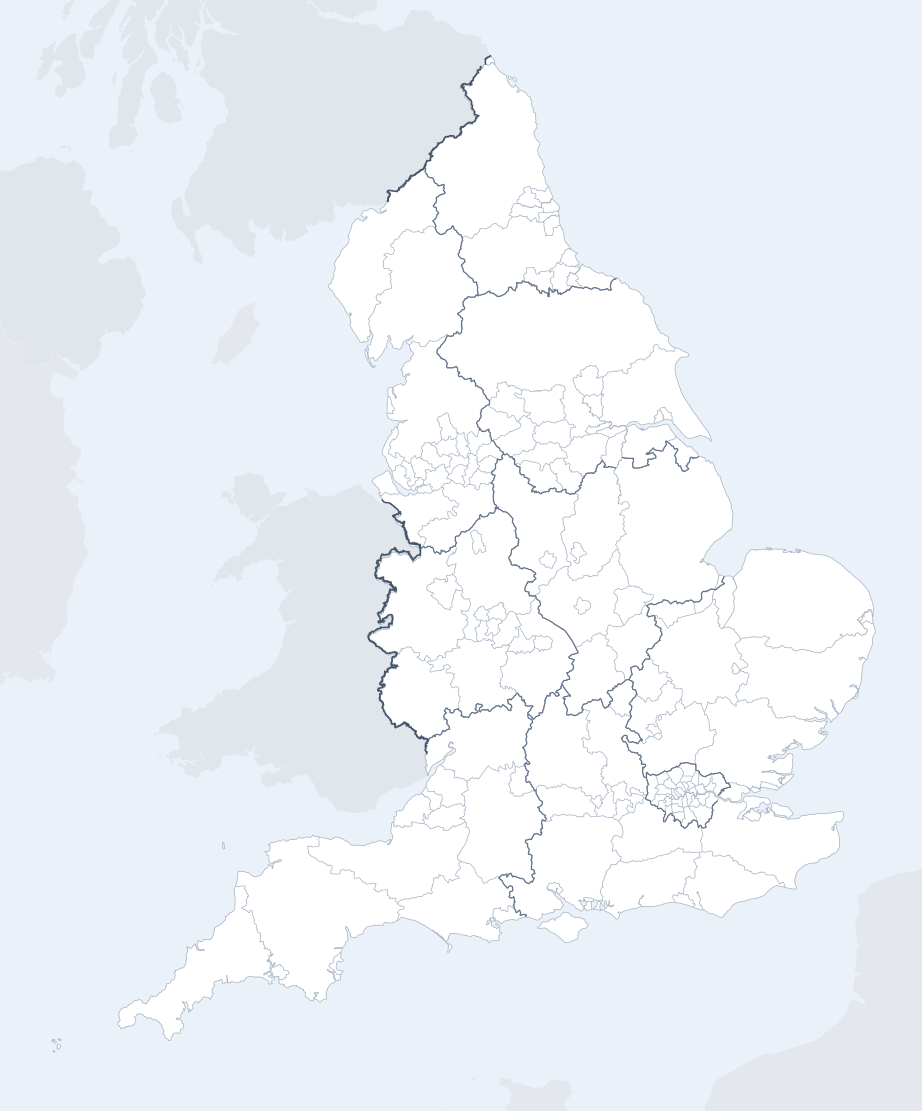
ONS, OS © Crown copyright 2025 · GIAS · © OpenStreetMap
England at a glance
- State-funded schools
- 21,959
- Pupils on roll
- 8,277,538
- Local authorities
- 153
- Primary schools
- 16,678
- Secondary schools
- 3,260
- All-through schools
- 162
- Special schools
- 1,073
- Alternative provision schools
- 330
- Nursery schools
- 374
- 16 to 19 schools
- 82
Attendance
Overall absence
2024/256.8%
England, all state-funded schools.
Show the figures as a table
| Year | England |
|---|---|
| 2017/18 | 4.8% |
| 2018/19 | 4.7% |
| 2020/21 | 4.6% |
| 2021/22 | 7.6% |
| 2022/23 | 7.4% |
| 2023/24 | 7.1% |
| 2024/25 | 6.8% |
Sessions missed for any reason, as a share of all possible sessions in the school year.
Persistent absence
2024/2518.1%
England, all state-funded schools.
Show the figures as a table
| Year | England |
|---|---|
| 2017/18 | 11.2% |
| 2018/19 | 10.9% |
| 2020/21 | 12.1% |
| 2021/22 | 22.5% |
| 2022/23 | 21.2% |
| 2023/24 | 20.0% |
| 2024/25 | 18.1% |
Pupils who missed 10% or more of their possible sessions, as a share of pupils.
Severe absence
2024/252.4%
England, all state-funded schools.
Show the figures as a table
| Year | England |
|---|---|
| 2017/18 | 0.8% |
| 2018/19 | 0.8% |
| 2020/21 | 1.1% |
| 2021/22 | 1.7% |
| 2022/23 | 2.0% |
| 2023/24 | 2.3% |
| 2024/25 | 2.4% |
Pupils who missed 50% or more of their possible sessions, as a share of pupils.
Suspensions and permanent exclusions
Suspensions per 100 pupils
2024/2510.88
England, all state-funded schools.
Show the figures as a table
| Year | England |
|---|---|
| 2017/18 | 5.08 |
| 2018/19 | 5.36 |
| 2019/20 | 3.76 |
| 2020/21 | 4.25 |
| 2021/22 | 6.91 |
| 2022/23 | 9.33 |
| 2023/24 | 11.31 |
| 2024/25 | 10.88 |
Suspensions in the school year for every 100 pupils on roll. One pupil can be suspended more than once.
Permanent exclusions per 100 pupils
2024/250.12
England, all state-funded schools.
Show the figures as a table
| Year | England |
|---|---|
| 2017/18 | 0.10 |
| 2018/19 | 0.10 |
| 2019/20 | 0.06 |
| 2020/21 | 0.05 |
| 2021/22 | 0.08 |
| 2022/23 | 0.11 |
| 2023/24 | 0.13 |
| 2024/25 | 0.12 |
Permanent exclusions in the school year for every 100 pupils on roll.
Key stage 2
Reading, writing and maths: expected standard
2025/26 (provisional)63%
England, primary schools.
Show the figures as a table
| Year | England |
|---|---|
| 2021/22 | 59% |
| 2022/23 | 60% |
| 2023/24 | 61% |
| 2024/25 | 63% |
| 2025/26 (provisional) | 63% |
Pupils at the end of key stage 2 who met the expected standard in reading, writing and maths combined.
Reading, writing and maths: higher standard
2025/26 (provisional)9%
England, primary schools.
Show the figures as a table
| Year | England |
|---|---|
| 2021/22 | 7% |
| 2022/23 | 8% |
| 2023/24 | 8% |
| 2024/25 | 8% |
| 2025/26 (provisional) | 9% |
Pupils at the end of key stage 2 who met the higher standard in reading, writing and maths combined.
Key stage 4
Attainment 8
2025/26 (provisional)47.4
England, secondary schools.
Show the figures as a table
| Year | England |
|---|---|
| 2021/22 | 49.8 |
| 2022/23 | 47.2 |
| 2023/24 | 46.9 |
| 2024/25 | 47.1 |
| 2025/26 (provisional) | 47.4 |
The average of pupils' points across eight GCSE-level qualifications, with English and maths counted twice.
English and maths: grade 4 or above
2025/26 (provisional)66%
England, secondary schools.
Show the figures as a table
| Year | England |
|---|---|
| 2021/22 | 70% |
| 2022/23 | 67% |
| 2023/24 | 67% |
| 2024/25 | 66% |
| 2025/26 (provisional) | 66% |
Pupils at the end of key stage 4 with grade 4 or above in both English and maths.
English and maths: grade 5 or above
2025/26 (provisional)48%
England, secondary schools.
Show the figures as a table
| Year | England |
|---|---|
| 2021/22 | 51% |
| 2022/23 | 46% |
| 2023/24 | 47% |
| 2024/25 | 47% |
| 2025/26 (provisional) | 48% |
Pupils at the end of key stage 4 with grade 5 or above in both English and maths.
Pupils
Eligible for free school meals
2024/2525.7%
England, all state-funded schools.
Show the figures as a table
| Year | England |
|---|---|
| 2021/22 | 22.5% |
| 2022/23 | 23.8% |
| 2023/24 | 24.6% |
| 2024/25 | 25.7% |
Pupils known to be eligible for free school meals on census day in January.
SEN support
2024/2514.0%
England, all state-funded schools.
Show the figures as a table
| Year | England |
|---|---|
| 2021/22 | 12.4% |
| 2022/23 | 12.9% |
| 2023/24 | 13.4% |
| 2024/25 | 14.0% |
Pupils receiving special educational needs support without an education, health and care plan.
Education, health and care plan
2024/255.2%
England, all state-funded schools.
Show the figures as a table
| Year | England |
|---|---|
| 2021/22 | 3.8% |
| 2022/23 | 4.2% |
| 2023/24 | 4.7% |
| 2024/25 | 5.2% |
Pupils with an education, health and care plan.
First language other than English
2024/2521.4%
England, all state-funded schools.
Show the figures as a table
| Year | England |
|---|---|
| 2021/22 | 19.6% |
| 2022/23 | 20.2% |
| 2023/24 | 20.8% |
| 2024/25 | 21.4% |
Pupils whose first language is known or believed to be other than English.
Workforce
Pupils per qualified teacher
2025/2618.5
England, all state-funded schools.
Show the figures as a table
| Year | England |
|---|---|
| 2017/18 | 18.4 |
| 2018/19 | 18.6 |
| 2019/20 | 18.8 |
| 2020/21 | 18.5 |
| 2021/22 | 18.5 |
| 2022/23 | 18.5 |
| 2023/24 | 18.6 |
| 2024/25 | 18.6 |
| 2025/26 | 18.5 |
Full-time equivalent pupils for each full-time equivalent qualified teacher.
Teacher sickness absence
2024/255.0 days
England, all state-funded schools.
Show the figures as a table
| Year | England |
|---|---|
| 2017/18 | 4.0 days |
| 2018/19 | 4.0 days |
| 2019/20 | Not published |
| 2020/21 | 3.9 days |
| 2021/22 | 6.3 days |
| 2022/23 | 5.2 days |
| 2023/24 | 5.3 days |
| 2024/25 | 5.0 days |
Days lost to sickness absence in the school year, averaged across all teachers.
Local authorities by region
Alphabetical. Each authority’s page has its schools, its figures against England and its map.
East Midlands
East of England
London
- Barking and Dagenham62
- Barnet135
- Bexley84
- Brent88
- Bromley100
- Camden57
- City of London1
- Croydon128
- Ealing94
- Enfield97
- Greenwich89
- Hackney73
- Hammersmith and Fulham58
- Haringey83
- Harrow60
- Havering83
- Hillingdon96
- Hounslow76
- Islington63
- Kensington and Chelsea39
- Kingston upon Thames52
- Lambeth89
- Lewisham86
- Merton56
- Newham102
- Redbridge79
- Richmond upon Thames60
- Southwark101
- Sutton64
- Tower Hamlets94
- Waltham Forest79
- Wandsworth80
- Westminster53
North East
North West
- Blackburn with Darwen77
- Blackpool44
- Bolton128
- Bury84
- Cheshire East156
- Cheshire West and Chester162
- Cumberland172
- Halton66
- Knowsley61
- Lancashire627
- Liverpool170
- Manchester189
- Oldham108
- Rochdale91
- Salford100
- Sefton102
- St. Helens69
- Stockport113
- Tameside99
- Trafford90
- Warrington88
- Westmorland and Furness147
- Wigan127
- Wirral125
South East
South West
West Midlands
- Birmingham443
- Coventry118
- Dudley108
- Herefordshire100
- Sandwell124
- Shropshire151
- Solihull84
- Staffordshire412
- Stoke-on-Trent93
- Telford and Wrekin77
- Walsall122
- Warwickshire252
- Wolverhampton111
- Worcestershire243